Doppler tomography of the black hole binary A0620-00 and the origin of chromospheric emission in quiescent X-ray binaries††thanks: Based on observations obtained with UVES at VLT Kueyen 8.2 m telescope in programme 66.D-0157(A)
Abstract
Context. Doppler tomography of emission line profiles in low mass X-ray binaries allows us to disentangle the different emission sites and study the structure and variability of accretion disks.
Aims. We present UVES high-resolution spectroscopic observations of the black hole binary A0620–00 at quiescence.
Methods. These spectroscopic data constrain the orbital parameters d and . These values, together with the mass ratio , imply a minimum mass for the compact object of , consistent with previous works.
Results. The H emission from the accretion disk is much weaker than in previous studies, possibly due to a decrease in disk activity. Doppler imaging of the H line shows for the first time a narrow component coming from the secondary star, with an observed equivalent width of Å, perhaps associated to chromospheric activity. Subtracting a K-type template star and correcting for the veiling of the accretion disk yields to an equivalent width of Å. A bright hot-spot is also detected at the position where the gas stream trajectory intercepts with the accretion disk.
Conclusions. The H flux associated to the secondary star is too large to be powered by X-ray irradiation. It is comparable to those observed in RS CVn binaries with similar orbital periods and, therefore, is probably triggered by the rapid stellar rotation.
Key Words.:
black hole physics – stars: accretion, accretion disks – binaries: close – stars: individual (V616 Mon) – X-rays: binaries – stars: activity1 Introduction
The black hole binary A0620–00 (V616 Mon) is one of the most studied low mass X-ray binaries (LMXBs), considered as the prototype soft X-ray transient (SXT). It was discovered in 1975 by the Ariel 5 (Elvis et al. 1975) satellite during a X-ray outburst where the optical brightness of the system increased by roughly 6 mag in few days. One year and several months after the system returned to its quiescent state at mag. The spectrum of a stellar counterpart was then identified and classified as a K5V-K7V star (Oke 1977; Murdin et al. 1980). Further spectroscopic observations allowed the determination of the orbital period of the secondary star at hr (McClintock & Remillard 1986) which implied the presence of a black hole of minimun mass (Marsh et al. 1994).
The orbital inclination of the system was later estimated from IR light curves at implying a primary black hole mass of (Gelino et al. 2001, see also Shahbaz, Naylor & Charles 1994). However, this study adopts a K4V stellar component with K, 300 K cooler than the effective temperature K derived by González Hernández et al. (2004) from high-resolution optical spectroscopic observations. This may affect the required veiling in the IR, and consequently, the derived inclination and black hole mass (Hynes et al. 2005). Furthermore, Cantrell et al. (2010) present evidence for substantial disk contamination in their IR light curves and find which translates into a lower black hole mass of . On the other hand, contradictory results have been reported using low-resolution IR spectra. Harrison et al. (2007) find a very small or negligible disk veiling at IR wavelengths whereas Froning et al. (2007) conclude that it can be 18% in the H band. The latter also argue that K is needed to fit their observations. However, we must note here that most studies just adopt a based on spectral classification, derived through comparison with low resolution template spectra, without determining the true of the template (Hynes et al. 2005). A similar inconsistency has been found for the black hole binary XTE J1118+480 for which Gelino et al. (2006) adopted a K where González Hernández et al. (2006, 2008b) derive a spectroscopic of K.
The accretion disk of A0620–00 has been studied in the UV (McClintock et al. 1995) and the optical (Marsh et al. 1994; Orosz et al. 1994), allowing the investigation of the inner and outer disk. Both works in the UV and optical seem to agree that the accretion disk is in a true quiescent state. However, this does not mean that the disk is inactive and probably its variability appears to be relevant (Shahbaz et al. 2004; Cantrell et al. 2008, 2010). Shahbaz et al. (2004) also suggested that the accretion disk in A0620–00 could be eccentric which may have been confirmed by more recent observations reported by Neilsen et al. (2008). As pointed out by these authors, to determine the definite mass of the compact object, it is very important to understand the structure and variability of the accretion disk as exemplified by Cantrell et al. (2010).
Here we present high-resolution spectroscopy of A0620–00 where we detect clear emission arising from the secondary star in the H Doppler map. This feature has only been observed before in the systems GU Mus (Casares et al. 1997), Nova Oph 77 (Harlaftis et al. 1997), Cen X-4 (Torres et al. 2002; D’Avanzo et al. 2005) and Nova Scorpii 1994 (Shahbaz et al. 1999). These data also allows us to revisit the orbital parameters of the system, which we find to be consistent with previous studies.
2 Observations
We obtained 20 spectra of A0620–00 with the UV-Visual Echelle Spectrograph (UVES) at the European Southern Observatory (ESO), Observatorio Cerro Paranal (Chile), using the 8.2 m Very Large Telescope (VLT) on 5, 17 and 21 December 2000, covering the spectral regions 4800–5800 Å and 5800–6800 Å at resolving power , with a dispersion of 0.029 and 0.035 Å pixel-1 for the blue and red arms, respectively. The total exposure time was 2.9 hours. The spectra were reduced in a standard manner using the UVES reduction package within the MIDAS environment. The exposure time was fixed at s to minimize the effects of orbital smearing which, for the orbital parameters of A0620–00, is in the range 2–54 , and therefore, in some cases, is larger than the instrumental resolution of . The signal-to-noise ratio per pixel in the individual spectra is and 8 in continuum regions close to the H and H lines, respectively. Thus the spectra were binned in wavelength with steps of 0.1 Å pixel-1, increasing the S/N6 and 12 at H and H, respectively. In this paper, we also use the K3-K4.5V template star HD209100, observed on 12 November 2000 with the Coralie spectrograph, installed on the 1.2m Euler Swiss Telescope at the ESO La Silla Observatory (Chile), with a spectral resolution of . This spectrum was rebinned to the same step and degraded to the same resolution of the spectra of A0620–00.
2.1 Revised orbital parameters
We extracted the radial velocities by cross-correlating each UVES spectrum of the target with the K3-4.5V template spectrum of HD209100, using the software MOLLY developed by T. R. Marsh.
Here we have concentrated in the H spectra only, which cover the spectral regions 4800–5800 Å, because they contain a larger number of metallic absorption lines for the cross-correlation and hence provide smaller errorbars by a factor of 2. In any case, the result of cross-correlating the H spectra yield identical results. Prior to the cross-correlation, the template spectrum was rotationally broadened by 96 to match the rotational velocity of the donor star (see Section 2.2).
A sine wave fit, , to the obtained velocities yields the following orbital solution (see Fig. 1): , , and d, where is defined as the heliocentric time of the inferior conjunction of the companion star. The orbital period was initially set to the value reported by McClintock & Remillard (1986) and subsequently refined to d after dividing the difference between our and the one quoted by Orosz et al. (1994) by an integer number of cycles (17957). The quoted uncertainties are at 1 and we have rescaled the errors by a factor 1.4 so that the minimum reduced is 1.0.
This orbital period, , together with the velocity amplitude of the orbital motion of the secondary star, , leads to a mass function of . Our value is consistent at the 1 level with previous results by Marsh et al. (1994, ) and Neilsen et al. (2008, ).
The derived radial velocity of the center of mass of the system also agrees at the 1 with previous studies (e.g. , Marsh et al. 1994). Note that our high-resolution data has a factor greater than 10 better spectral resolution than all previous data. For instance, the studies presented by Marsh et al. (1994) and Neilsen et al. (2008) used spectra with a resolving power of 70 and 130 , respectively. Despite this, Neilsen et al. (2008) provides a significantly lower uncertainty for the semiamplitude velocity of 0.5 given their resolving power. This is because our orbital coverage is much less complete than previous studies, specially around orbital phase 0.75.

2.2 Rotational velocity
Following Marsh et al. (1994), we also computed the optimal by subtracting broadened versions of the template star, in steps of 1 , and minimizing the residual. We used a spherical rotational profile with linearized limb-darkening , which is appropriate for the stellar parameters of the donor star (González Hernández et al. 2004) and our wavelength range Å (Al-Naimiy 1978). The best fit corresponds to a but the error is purely formal since it does not account for systematics due to our choice of which is adecuate for the continuum but likely overestimated for the absorption lines (Collins & Truax 1995). In an attempt to derive a more realistic error, we have also computed the rotational broadening for the extreme case and find . A more conservative value is then provided by the mean of the two determinations i.e. . As a result of the optimal subtraction we also find that the donor star contributes % to the total light in the H region and 85% in the H region. At this point we note that the absorption features of the secondary star can be smeared by as much as 53 according to the length of the exposure times and the orbital phase of the observations. We have also tried to correct for this by simulating the smearing in the template spectrum according to Casares et al. (1997) but found that the effect is completely negligible.
In the case of tidally locked Roche lobe filling stars, the rotational velocity relates to the velocity semiamplitude, , and the mass ratio, , through the expression (e.g. Wade & Horne 1988). Our derived rotational velocity, combined with our value of , implies a binary mass ratio . However, due to the Roche lobe geometry, displays a 10% modulation with maxima at the orbital quadratures (Casares et al. 1996). Most of our spectra are located at orbital phases around 0.25 and hence our previous determination is likely to be overestimated by a factor 5% which would make it consistent with Marsh et al. (1994) and Neilsen et al. (2008). Therefore, we think that the value provided by Marsh et al. (1994), , is more realistic. Using this result and our value for , we obtain , which is the same value given in Neilsen et al. (2008). This, combined with the mass function, provides a minimum mass for the compact object of .

3 Ellipsoidal variations of the H line
We have determined the equivalent width (EW) of H profiles for the 20 UVES spectra of A0620–00 by adding numerically the normalized fluxes multiplied by the wavelength step. In Fig. 2 we depict the evolution of the EW of H with orbital phase. The error bars were determined by measuring the change in EW from varying the continuum location according to the S/N ratio in the continuum regions. Despite our limited phase coverage, the orbital variation of the EWs hints at the ellipsoidal varibility seen by Marsh et al. (1994) and Neilsen et al. (2008) due to the dominance of the donor star’s light.
We have also displayed for comparison the solution of the fit to a sinusoid plus a constant to the data of Marsh et al. (1994), . Our mean EW is 43 Å, significantly lower than in Marsh et al. (1994), whose spectroscopic data were obtained in December 1991, and much lower than that in Neilsen et al. (2008), whose data were obtained in December 2006. This may be due to an increase in the continuum from the accretion disk, a decrease in the H flux or a combination of the two. Despite being in quiescence, A0620–00 shows significant variability and different states associated with changes in disk activity (e.g. Cantrell et al. 2008). Therefore, the lower EW seen in our spectra with respect to previous studies could well be associated to a different level of accretion disk activity. The relative contribution of the accretion disk to the continuum in the H region is 15% in our data and 6% in Marsh et al. (1994). This, combined with the variation in EWs between the two data sets, implies that the H flux has dropped 33% in our data with respect to Marsh et al. (1994). In fact, Cantrell et al. (2008) find that A0620–00 was in a lower level of activity (what they called “passive” state) most of the time between December 1999 and December 2003. Our observations were taken in December 2000, when the system was in the “passive” state and this seems to be the reason for the low level of H flux that we see.
4 Doppler images of H and H
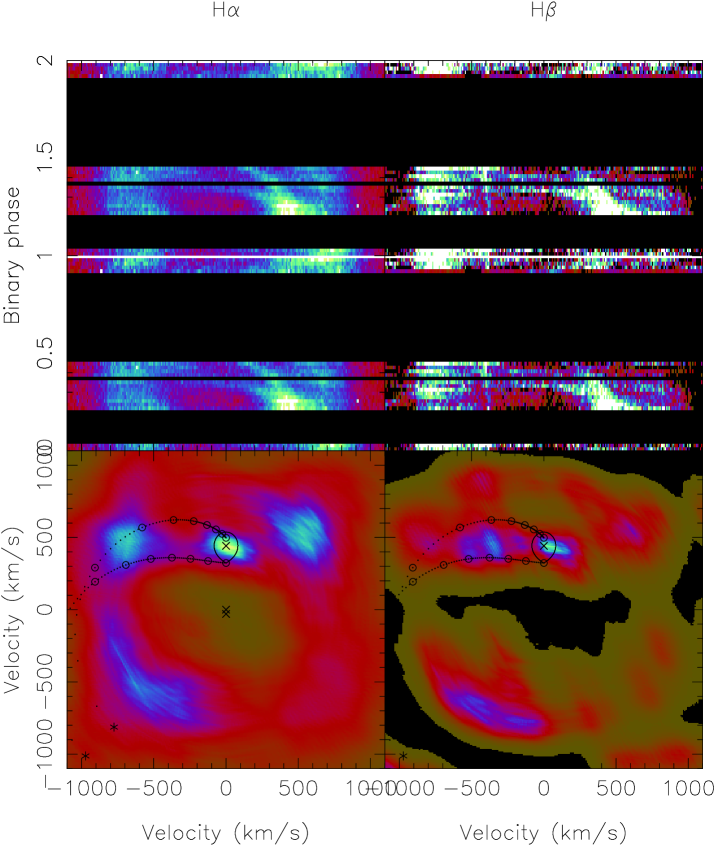
We have used Doppler tomography (Marsh & Horne 1988) to map the H and H emission in A0620–00. By combining the orbitally-resolved line profiles we are able to reconstruct the brightness distribution of the system in velocity space. The result is displayed in Fig. 3. The Doppler maps were built by combining the 20 profiles. The spectra of H and H were continuum subtracted, leaving the pure line emission, and rebinned to a velocity scale of 9 per pixel. The top panels show trailed spectra and the bottom panels the corresponding Doppler images. The location of the main components in the system, such as the Roche lobe of the secondary star and the predicted gas stream trajectory and the Keplerian trajectory of the disk along the stream are indicated. These tracks were calculated adopting the values and .
Although the disk activity seems to be lower than in previous studies (see Section 3), we can see a clear detection of the bright spot between the velocity trajectories of the gas stream and of the disk along the stream, as previously reported in Marsh et al. (1994); Neilsen et al. (2008) and in other systems.
We must note that the Doppler maps shown in Fig. 3 were constructed without subtracting any K-type template spectrum from the original data. We note here the presence of intense H emission exactly at the position of the secondary star. The emission coming from the secondary star can be also identified through the short tracks of the expected S-wave emission on the trailed spectrogram.
The H Doppler map also shows emission around the position of the Roche lobe but it is less clear. The S/N of the spectra at H is significantly lower and the line is also close the edge of the CCD which makes this map somewhat uncertain.
5 Narrow H component emission from the secondary star
Casares et al. (1997) already found a narrow H emission line associated to the donor star in the spectra of the black hole binary Nova Muscae 1991. This line was tentatively associated to chromospheric activity of the secondary star in this system. It is known that rapidly rotating stars as young T-Tauri stars (e.g. Appenzeller & Mundt 1989) and/or old, non-interacting RS CVn binaries (e.g. Herbig 1985; Fekel et al. 1986) show a high level of chromospheric activity, with significant filling-in of the H core and, occasionally, reversal into emission. Rapidly rotating and convective stars are capable of manifesting surface magnetic fields through the dynamo process (Parker 1955). The induced magnetic fields lead to confinement and heating of plasma, which produce chromospheric and coronal emissions (e.g Ca ii H and K lines, H and X-rays). Observations of these phenomena in solar type stars have shown that the chromospheric activity increases with rotation rate (e.g. Noyes et al. 1984).
Companion stars of X-ray transients are tidally locked, with short orbital periods and, therefore, large rotational velocities. Thus, it is not surprinsing that the secondary star in A0620–00, with , is chromospherically active. However, this is the first time that chromospheric emission from the secondary star has been clearly detected in this system before subtracting the spectrum of a template K-type star. Note that Marsh et al. (1994) do detect a narrow S-wave in their trailed spectra but only after subtracting the template star, which, as a matter of fact, provides a limit on the chromospheric emission set by the equivalent width of the H absorption in the template star. The reason this chromospheric component has not been detected in previous studies seems to hold on variability arguments, perhaps related to the low level of accretion disc activity seen in our data (which ortherwise might somehow dilute the chromospheric component) or simply due to variations in the donor star’s activity (magnetic cycles).

We attempted to detrend the narrow H component from the broad underlying accretion disk contribution. The K3-4.5V template spectrum used in this work shows an H line in absorption of Å. This could be considered as a lower limit to the EW of the chromospheric emission of the secondary star in A0620–00. In fact, the derived effective temperature of K by González Hernández et al. (2004) favours a slightly earlier spectral type, i.e. K2V, which would shift this limit up to 1.4–1.5 Å.
In the Doppler corrected average of the 20 spectra of the system, this narrow component appears as a narrow feature on top of the broad doubled-peak H emission produced by the accretion disk (see spectrum (c) of Fig. 4). The emission of the accretion disk can be approximated by a Doppler-shifted average (in the rest frame of system center-of-mass) of the double-peaked profile (spectrum (a) of Fig. 4). This is not exactly the real accretion disk emission profile since it also contains the smeared S-wave component of the secondary star. We then shifted in velocity 20 versions of spectrum (a) to the rest frame of the secondary star at the given phase of each individual spectrum and computed again the average using the same weights as before. The resulting profile (spectrum (b) of Fig. 4) was subsequently subtracted from the original Doppler corrected average, i.e. spectrum (c), leaving completely isolated the narrow H component associated with the secondary star (spectrum (d) of Fig. 4). After this subtraction we added a constant value equal to 1 since the continuum level of the resulting spectrum was at zero. We did this to avoid to work with negative spectral points. We performed a second iteration of the whole process by firstly subtracting each original spectrum by spectrum (d), properly corrected by the star’s velocity at each orbital phase, in order to eliminate the smeared narrow component of the secondary star from the profiles (a) and (b). In fact, the spectra displayed in Fig. 4 shows the results of this last iteration.
The spectrum (d) of Fig. 4 is the normalized spectrum of the secondary star without the accretion disk contribution. We measure the equivalent width of the narrow H component from the secondary star in this spectrum to be Å. The error bar has been estimated by changing the position of the continuum, taking into account the S/N ratio of the spectrum of the secondary star. In order to measure the real chromospheric emission H line, one needs to subtract the photospheric component using a template star with the same spectral type (see e.g. Montes et al. 1995). We then subtracted a K-type template star properly broadened (spectrum (e)) and scaled by a veiling factor of 0.76, and find an EW of Å (spectrum (f)), which has to be corrected for the same veiling factor, leading to a final value of EW(H Å.
| Object | EW(H)a | b | Refs.c | ||||||
|---|---|---|---|---|---|---|---|---|---|
| [Å] | [K] | [dex] | [ erg cm-2 s-1] | [dex] | [days] | [days] | [dex] | ||
| A0620–00 | 4.2 | 22.7 | 0.32 | -1.85 | 1,2 | ||||
| Nova Muscae 1991 | d | 4.1d | 24.6 | 0.43 | -1.74 | 3,4 | |||
| Cen X-4e | 3.9 | 24.7 | 0.63 | -1.58 | 5,6 | ||||
| Cen X-4f | 3.9 | 24.7 | 0.63 | -1.58 | 6,7 | ||||
| Nova Scorpii 1994 | 3.7 | 7.6 | 2.62 | -0.60 | 8,9,10 |
-
a
Corrected equivalent width of narrow H component of the secondary star.
- b
-
c
References: (1) González Hernández et al. (2004), (2) McClintock & Remillard (1986), (3) Casares et al. (1997), (4) Remillard et al. (1992), (5) Torres et al. (2002), (6) González Hernández et al. (2005), (7) D’Avanzo et al. (2005), (8) Shahbaz et al. (1999), (9) González Hernández et al. (2008a), (10) van der Hooft et al. (1998).
-
d
Adopted values according to the effective temperature and surface gravity for the spectral type and orbital period.
-
e
H equivalent width obtained from Torres et al. (2002)
-
f
H equivalent width obtained from D’Avanzo et al. (2005)
6 Discussion
Strassmeier et al. (1990) measured the H EWs of a sample of F6-M2 single and binary stars, showing that the H EW increases towards shorter rotation periods, . Extrapolation of this trend EW vs. at the orbital period of A0620–00 provides an expected EW of Å, assuming that the secondary star is a dwarf main-sequence star and its rotation is sychronized with the orbital motion. This EW is marginally consistent (at 1.5) with the observed EW of the secondary star. However, the extrapolation might not be adequate since chromospheric features powered by rotation typically saturates for period shorter than 1–3 days (e.g. Cardini & Cassatella 2007, for chromospheric Mg ii lines).
We can also compare the H EW, converted into flux following the approach of Soderblom et al. (1993), with the observations of field stars and binaries. Thus, the H flux at the stellar surface, is erg cm-2 s-1 (see Table 1). We use a similar prescription than that of Equation 2 in Soderblom et al. (1993), i.e. , where is is the continuum flux at H and is derived using the flux calibration of Hall (1996), . Here we have used estimated from theoretical colours (Bessell et al. 1998) according to the stellar parameters of the secondary star (González Hernández et al. 2004). The surface flux is usually normalized to the bolometric flux, i.e. . The connection between chromospheric activity and rotation is obtained by studying the correlation with the Rossby number , where is the convective turnover time, , the rotation period of the secondary star and , its radius. Using the Rossby number is usually preferred over and since it does not depend on the mass of the star.
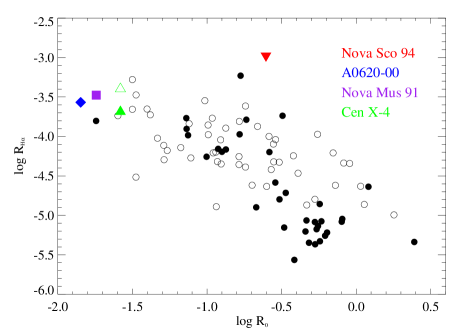
For the case of A0620–00, we adopt K (González Hernández et al. 2004), d and d, computed from Eq. (4) of Noyes et al. (1984). We derive and , and this is listed in Table 1, together with values derived for other quiescent X-ray transients. In Fig. 5 we compare these values with those of chromospherically active single stars (López-Santiago et al. 2010, in press) and binary systems (RS CVn and BY Dra classes) from Montes et al. (1995). Our value of the Rossby number places the secondary star of A0620–00 in the region of activity saturation, where all measurements tend to the same average value of , and is consistent with the general trend. The other X-ray binaries show similar results, except for the black hole X-ray binary Nova Scorpii 1994 which displays a too large value for its relatively low Rossby number. This is even more evident when comparing the H fluxes, with for Nova Scorpii 1994, significantly higher, by almost one order of magnitude, than the saturation level at . In addition, D’Avanzo et al. (2005) also suggested that the H EW of the secondary star in Cen X-4 is correlated with the veiling of the accretion disk (see Table 1), by comparing their values with those given by Torres et al. (2002). Although this is not expected in a chromospheric activiy scenario, the two Cen X-4 points in Fig. 5 fall in the saturation region, together with other X-ray and chromospherically active binaries. The behaviour seen in Nova Scorpii 1994 and Cen X-4 suggests that rapid rotation might not be the only explanation for the narrow H feature, at least in these LMXBs, but perhaps a combination of rotation and reprocessing of X-ray flux from the accretion disk into H photons in the secondary star. Hence, it is worth investigating in A0620–00 if X-ray heating could be an alternative explanation for this feature.
The system A0620–00 has been observed in quiescence with the Chandra X-ray satellite, providing a 0.5-10 KeV unabsorbed flux erg cm-2 s-1 (Gallo et al. 2006).
The X-ray flux at the stellar surface can be computed as erg cm-2 s-1, where we have adopted an orbital separation and a distance kpc. This means that almost 92% of the incident X-ray radiation would have to be reprocessed to H photons in order to power the observed H emission. Following Hynes et al. (2002), , where is the fraction of X-ray emission intercepted by the companion, i.e. the solid angle subtended by the companion from the compact object (), and is the fraction of input energy emitted in H (Hynes et al. 2002, and references therein). Adopting from González Hernández et al. (2004), we obtain . This number is significantly lower than the observed value, what indicates that the incident X-ray irradiation is not enough to produce the narrow H line in the secondary star. D’Avanzo et al. (2005) also derived these quantities for the case of the neutron star binary Cen X-4 and found both estimates to be consistent, due to the fact that the X-ray flux in Cen X-4 is erg cm-2 s-1, i.e. almost two order of magnitude higher than in A0620–00.
There is still a remote posibility that the source of irradiating photons is hidden away in the EUV (Extreme UV) energy range, between 100–1200 Å. Although this energy range is not directly observed, we can roughly guess how much flux is involved through interpolating the nearby soft X-ray and Far-UV (FUV) emission. The Far-UV flux (in the range 1350–2200 Å) has been determined at erg cm-2 s-1 (McClintock et al. 1995), i.e. similar to the X-ray flux. This together with the absence of He ii 4686 Å line emission in the optical spectrum (Marsh et al. 1994) suggests that flux in the EUV should be of the order of erg cm-2 s-1. Even if we consider all the ionizing photons (X-rayEUVFUV), the total flux would be roughly three times the X-ray flux, i.e. erg cm-2 s-1. Therefore, if we assume that the incident irradiation is , then the 31% of the incident radiation would have to be reprocessed to H photons in order to power the observed H emission, which still is a too large fraction compared to the fraction previously estimated to be bellow 1%.
7 Summary
We have presented high-resolution UVES/VLT spectroscopy of the black hole binary A0620–00 at quiescence. Our orbital parameters are consistent with previous studies by Marsh et al. (1994) and Neilsen et al. (2008). In particular, we derive d and . These values, together with the mass ratio , implies a minimum mass for the compact object of .
We also performed a Doppler tomography of the accretion disk emission and we discover emission at the position of the secondary star in the Doppler maps of H and H, not detected in previous studies. We isolate the chromospheric H emission from the secondary star and measure an equivalent width of Å. This equivalent width is too large to be explained by X-ray and/or UV irradiation from the inner accretion disk and, therefore, chromospheric activity, induced by rapid rotation, seems the most likely origin of this feature in the black hole binary A0620–00.
Acknowledgements.
J.I.G.H. acknowledges support from the project AYA2008-00695 of the Spanish Ministry of Education and Science. J.C. acknowledges support from the Spanish Ministry of Science and Technology through the project AYA2007-66887. This work has been partially funded by the Spanish MICINN under the Consolider-Ingenio 2010 Program grant CSD2006-00070: First Science with the GTC (http://www.iac.es/consolider-ingenio-gtc). We are grateful to Tom Marsh for the use of the MOLLY analysis package. J.I.G.H. is grateful to Javier López Santiago for providing us with the data of chromospherically active single and binary stars. J.I.G.H. also thanks helpful discussions with Javier López Santiago, David Montes and Raquel Martínez Arnáiz.References
- Al-Naimiy (1978) Al-Naimiy, H.M. 1978, Ap&SS, 53, 181
- Appenzeller & Mundt (1989) Appenzeller, I., & Mundt, R. 1989, A&A Rev., 1, 291
- Basri (1987) Basri, G. 1987, ApJ, 316, 377
- Bessell et al. (1998) Bessell, M. S., Castelli, F., & Plez, B. 1998, A&A, 333, 231
- Cardini & Cassatella (2007) Cardini, D., & Cassatella, A. 2007, ApJ, 666, 393
- Cantrell et al. (2008) Cantrell, A. G., Bailyn, C. D., McClintock, J. E., & Orosz, J. A. 2008, ApJ, 673, L159
- Cantrell et al. (2010) Cantrell, A. G. et al. 2010, ApJ, submitted (arXiv:1001.0261)
- Casares et al. (1996) Casares, J., Mouchet., M., Martínez-Pais, I.G., & Harlaftis, E.T. 1996, MNRAS, 282, 182
- Casares et al. (1997) Casares, J., Martin, E. L., Charles, P. A., Molaro, P., & Rebolo, R. 1997, New Astronomy, 1, 299
- Casares et al. (2007) Casares, J., Bonifacio, P., González Hernández, J. I., Molaro, P., & Zoccali, M. 2007, A&A, 470, 1033
- Casares et al. (2009) Casares, J., González Hernández, J. I., Israelian, G., & Rebolo, R. 2009, MNRAS, in press
- Collins & Truax (1995) Collins, G.W.II & Truax, R.J. 1995, ApJ, 439, 860
- D’Avanzo et al. (2005) D’Avanzo, P., Campana, S., Casares, J., Israel, G. L., Covino, S., Charles, P. A., & Stella, L. 2005, A&A, 444, 905
- Elvis et al. (1975) Elvis, M., Page, C. G., Pounds, K. A., Ricketts, M. J., & Turner, M. J. L. 1975, Nature, 257, 656
- Fekel et al. (1986) Fekel, F. C., Moffett, T. J., & Henry, G. W. 1986, ApJS, 60, 551
- Froning et al. (2007) Froning, C. S., Robinson, E. L., & Bitner, M. A. 2007, ApJ, 663, 1215
- Gallo et al. (2006) Gallo, E., Fender, R. P., Miller-Jones, J. C. A., Merloni, A., Jonker, P. G., Heinz, S., Maccarone, T. J., & van der Klis, M. 2006, MNRAS, 370, 1351
- Gelino et al. (2001) Gelino, D. M., Harrison, T. E., & Orosz, J. A. 2001, AJ, 122, 2668
- Gelino et al. (2006) Gelino, D. M., Balman, Ş., Kililoğlu, Ü., Yilmaz, A., Kalemci, E., & Tomsick, J. A. 2006, ApJ, 642, 438
- González Hernández et al. (2004) González Hernández, J. I., Rebolo, R., Israelian, G., Casares, J., Maeder, A., & Meynet, G. 2004, ApJ, 609, 988
- González Hernández et al. (2005) González Hernández, J. I., Rebolo, R., Israelian, G., Casares, J., Maeda, K., Bonifacio, P., & Molaro, P. 2005, ApJ, 630, 495
- González Hernández et al. (2006) González Hernández, J. I., Rebolo, R., Israelian, G., Harlaftis, E. T., Filippenko, A. V., & Chornock, R. 2006, ApJ, 644, L49
- González Hernández et al. (2008a) González Hernández, J. I., Rebolo, R., & Israelian, G. 2008a, A&A, 478, 203
- González Hernández et al. (2008b) González Hernández, J. I., Rebolo, R., Israelian, G., Filippenko, A. V., Chornock, R., Tominaga, N., Umeda, H., & Nomoto, K. 2008b, ApJ, 679, 732
- Hall (1996) Hall, J. C. 1996, PASP, 108, 313
- Harrison et al. (2007) Harrison, T. E., Howell, S. B., Szkody, P., & Cordova, F. A. 2007, AJ, 133, 162
- Harlaftis et al. (1997) Harlaftis, E. T., Steeghs, D., Horne, K., & Filippenko, A. V. 1997, AJ, 114, 1170
- Harlaftis et al. (1999) Harlaftis, E., Collier, S., Horne, K., & Filippenko, A. V. 1999, A&A, 341, 491
- Herbig (1985) Herbig, G. H. 1985, ApJ, 289, 269
- van der Hooft et al. (1998) van der Hooft, F., Heemskerk, M. H. M., Alberts, F., & van Paradijs, J. 1998, A&A, 329, 538
- Hynes et al. (2002) Hynes, R. I., Zurita, C., Haswell, C. A., Casares, J., Charles, P. A., Pavlenko, E. P., Shugarov, S. Y., & Lott, D. A. 2002, MNRAS, 330, 1009
- Hynes et al. (2005) Hynes, R. I., Robinson, E. L., & Bitner, M. 2005, ApJ, 630, 405
- López-Santiago et al. (2010) López-Santiago, J. et al. 2010, A&A, in press
- Marsh & Horne (1988) Marsh, T. R., & Horne, K. 1988, MNRAS, 235, 269
- Marsh et al. (1994) Marsh, T. R., Robinson, E. L., & Wood, J. H. 1994, MNRAS, 266, 137
- McClintock & Remillard (1986) McClintock, J. E., & Remillard, R. A. 1986, ApJ, 308, 110
- McClintock et al. (1995) McClintock, J. E., Horne, K., & Remillard, R. A. 1995, ApJ, 442, 358
- Montes et al. (1995) Montes, D., Fernandez-Figueroa, M. J., de Castro, E., & Cornide, M. 1995, A&AS, 109, 135
- Murdin et al. (1980) Murdin, P., Allen, D. A., Morton, D. C., Whelan, J. A. J., & Thomas, R. M. 1980, MNRAS, 192, 709
- Neilsen et al. (2008) Neilsen, J., Steeghs, D., & Vrtilek, S. D. 2008, MNRAS, 384, 849
- Noyes et al. (1984) Noyes, R. W., Hartmann, L. W., Baliunas, S. L., Duncan, D. K., & Vaughan, A. H. 1984, ApJ, 279, 763
- Oke (1977) Oke, J. B. 1977, ApJ, 217, 181
- Orosz et al. (1994) Orosz, J. A., Bailyn, C. D., Remillard, R. A., McClintock, J. E., & Foltz, C. B. 1994, ApJ, 436, 848
- Parker (1955) Parker, E. N. 1955, ApJ, 122, 293
- Remillard et al. (1992) Remillard, R. A., McClintock, J. E., & Bailyn, C. D. 1992, ApJ, 399, L145
- Shahbaz et al. (1999) Shahbaz, T., van der Hooft, F., Casares, J., Charles, P. A., & van Paradijs, J. 1999, MNRAS, 306, 89
- Shahbaz et al. (1994) Shahbaz, T., Naylor, T. & Charles, P. A. 1994, MNRAS, 268, 756
- Shahbaz et al. (2004) Shahbaz, T., Hynes, R. I., Charles, P. A., Zurita, C., Casares, J., Haswell, C. A., Araujo-Betancor, S., & Powell, C. 2004, MNRAS, 354, 31
- Soderblom et al. (1993) Soderblom, D. R., Stauffer, J. R., Hudon, J. D., & Jones, B. F. 1993, ApJS, 85, 315
- Strassmeier et al. (1990) Strassmeier, K. G., Fekel, F. C., Bopp, B. W., Dempsey, R. C., & Henry, G. W. 1990, ApJS, 72, 191
- Torres et al. (2002) Torres, M. A. P., Casares, J., Martínez-Pais, I. G., & Charles, P. A. 2002, MNRAS, 334, 233
- Wade & Horne (1988) Wade, R. A., & Horne, K. 1988, ApJ, 324, 411