Star Formation and UV Colors of the Brightest Cluster Galaxies
in the Representative XMM-Newton Cluster Structure Survey
Abstract
We present UV broadband photometry and optical emission-line measurements for a sample of 32 Brightest Cluster Galaxies (BCGs) in clusters of the Representative XMM-Newton Cluster Structure Survey (REXCESS) with . The REXCESS clusters, chosen to study scaling relations in clusters of galaxies, have X-ray measurements of high quality. The trends of star formation and BCG colors with BCG and host properties can be investigated with this sample. The UV photometry comes from the XMM Optical Monitor, supplemented by existing archival GALEX photometry. We detected H and forbidden line emission in 7 (22%) of these BCGs, in optical spectra obtained using the SOAR Goodman Spectrograph. All of these emission-line BCGs occupy clusters classified as cool cores based on the central cooling time in the cluster core, for an emission-line incidence rate of 70% for BCGs in REXCESS cool core clusters. Significant correlations between the H equivalent widths, excess UV production in the BCG, and the presence of dense, X-ray bright intracluster gas with a short cooling time are seen, including the fact that all of the H emitters inhabit systems with short central cooling times and high central ICM densities. Estimates of the star formation rates based on H and UV excesses are consistent with each other in these 7 systems, ranging from solar masses per year. The incidence of emission-line BCGs in the REXCESS sample is intermediate, somewhat lower than in other X-ray selected samples (), and somewhat higher than but statistically consistent with optically selected, slightly lower redshift BCG samples (). The UV-optical colors (UVW1-R ) of REXCESS BCGs without strong optical emission lines are consistent with those predicted from templates and observations of ellipticals dominated by old stellar populations. We see no trend in UV-optical colors with optical luminosity, color, X-ray temperature, redshift, or offset between X-ray centroid and X-ray peak (). The lack of such trends in these massive galaxies, particularly the ones lacking emission lines, suggests that the proportion of UV-emitting (200-300 nm) stars is insensitive to galaxy mass, cluster mass, cluster relaxation, and recent evolution, over the range of this sample.
Subject headings:
galaxies:clusters:general, cooling flows, galaxies: elliptical and lenticular, cD1. Introduction
In current models of hierarchical galaxy formation, Brightest Cluster Galaxies (BCGs) are the trash heaps of the universe. As galaxies fall through and past the center of a cluster of galaxies, tidal forces strip them of their stars, and ram pressure stripping by the dense intracluster medium (ICM) removes some of their gas. The BCG settles to the cluster’s center of mass and accretes stars and gas, developing a huge extended stellar halo characteristic of central dominant (cD) galaxies. These galaxies are therefore not simply overgrown massive ellipticals, but represent a category of galaxies that appear to have very special growth histories.
Modern simulations have great difficulty reproducing the observed properties of these singular objects, which form deep in the potential well of a cluster. Apparently, the star formation in these systems must be quenched in order to explain their optical luminosities and colors (e.g., Kauffmann & Charlot, 1998). In the most massive galaxies, the primary agent of feedback at late times is thought to be the central supermassive black hole. The vast majority of the stars in the most massive elliptical galaxies were already present billions of years ago, based on studies of their color-magnitude relation and spectral energy distributions (e.g., Bower et al., 1992; Kodama et al., 1998; Andreon, 2008), and the mass of a galaxy’s central black hole tends to be about 0.2% the mass of its spheroidal component (e.g., Magorrian et al., 1998; Gebhardt et al., 2000; Ferrarese & Merritt, 2000). Somehow, formation and growth of the black hole is coupled to the formation and growth of the galaxy. Meanwhile, the downsizing phenomenon (Cowie et al., 1999), wherein massive galaxies stop forming stars earlier than low-mass galaxies, suggests that star formation somehow decouples from the growth of the galaxy by hierarchical accretion (e.g., Benson et al., 2002). Galaxy formation models without feedback from an active galactic nucleus (AGN) predict high-mass galaxies that are far too blue and luminous (Kauffmann & Charlot, 1998), but the situation may be resolved when (sufficient) feedback from an AGN is included (e.g., Ciotti & Ostriker, 1997; Silk & Rees, 1998; Binney, 2004).
The star formation in today’s BCGs, if present at all, is a mere shadow of what it must have been billions of years ago when most of the stars were formed. Nevertheless, some BCGs apparently do persist in forming stars, with the trend that the clusters with the shortest cooling times appear to be much more likely to host emission line systems and blue cores (e.g., Cowie et al., 1983; Heckman et al., 1989; McNamara & O’Connell, 1992; Rafferty et al., 2006; Cavagnolo et al., 2008; Voit et al., 2008). Such clusters comprise about half of X-ray luminous ( erg s-1) clusters at low redshift (Edge et al., 1992; Donahue et al., 1992; Crawford et al., 1999). Hicks & Mushotzky (2005), in an XMM Optical Monitor study of 33 galaxies, of which 9 were BCGs, showed a connection between excess ultraviolet (UV) emission and recent X-ray estimates of mass cooling rates. There appears to be a clear empirical connection between the state of the hot gas and the activity in the BCG.
Observationally, multi-wavelength studies of clusters of galaxies and their BCGs provide some insight into how this feedback process may proceed. Cavities in the X-ray intracluster gas that surrounds radio lobes provided smoking-gun evidence for AGN feedback (e.g., Böhringer et al., 1993; McNamara et al., 2005). Estimates of the work required to inflate such cavities have shown that the kinetic energy outputs from these AGNs are surprisingly high compared to their radio luminosities and estimated lifetimes (e.g., McNamara & Nulsen, 2007). Central radio sources are quite common at the centers of galaxy clusters with cool, dense ICM cores (Burns, 1990). Sporadic AGN outbursts with kinetic outputs of can plausibly stabilize cooling and star formation in the BCGs of those clusters, explaining why those galaxies are less red and less luminous than BCGs modeled without AGN feedback (e.g., Voit & Donahue, 2005). While this is not necessarily the feedback mode that quenches star formation in elliptical galaxies at high redshift, this is the only form of AGN feedback that we can currently study in such detail.
Multi-wavelength studies of a well-chosen X-ray sample without any particular morphological criteria, with uniform and accurate X-ray measurements, are the best way to study the relationship of star formation, intracluster gas, and AGN feedback at low redshift. Such studies shed light on what regulates star formation in large galaxies at earlier times in the universe. Ultraviolet observations are sensitive to the continua of OB stars, and H is produced by photoionization of the interstellar medium (ISM) by O-stars. Elliptical galaxies, and therefore older stellar populations, exhibit an increasing UV emission towards shorter UV wavelengths (“UV upturn”) from extreme horizontal branch stars. However, recent discussions suggest that relatively tiny amounts of young stars can contribute to the observed scatter in this component for UV starlight (e.g., Han et al., 2007).
In this work we investigate the UV properties of BCGs including both UV from recent star formation and from older stellar populations. We present new UV observations from the XMM-Newton Optical Monitor and archival results from the Galaxy Evolution Explorer (GALEX), together with a census of BCG emission-line activity from ground-based observations from the SOAR Goodman Spectrograph. These observations are of BCGs in the Representative XMM–Newton Cluster Structure Survey (REXCESS) (Böhringer et al., 2007). We provide a small number of supplemental observations to complete the spectroscopic coverage of a comparison sample of BCGs. We assume cosmological parameters km s-1 Mpc-1 () and a flat geometry with throughout.
2. Sample Description
The Representative XMM-Newton Cluster Structure Survey (REXCESS) (Böhringer et al., 2007) was designed to investigate how the properties of galaxy clusters scale with mass. Its primary scientific goal was to further the understanding of how cluster observables such as luminosity and temperature depend on cluster mass, in order to improve the calibration of the scaling relations essential for cluster cosmology and to provide a comparison sample for galaxy cluster simulations. The sample was selected on the basis of X-ray luminosity alone, with no bias regarding morphology or central surface brightness. It was also selected to span a wide range in mass, luminosity, and X-ray temperature ( keV). The sample was chosen to optimally cover the full range of cluster X-ray luminosities, at redshifts such that the cluster is compact enough for local background estimation with XMM yet extended enough for measuring temperature and surface-brightness structure ().
The REXCESS sample differs in important respects from that of a previous XMM Optical Monitor study (Hicks & Mushotzky, 2005). The Hicks & Mushotzky sample was smaller (only 9 BCGs) and heterogeneous, chosen from the literature for the existence of published optical and X-ray properties and for their proximity, with a few added at moderate redshift for their extreme cool core properties. In contrast, the REXCESS sample is specifically designed to be representative for a given cluster luminosity range, which means that we can now ask whether the UV colors, star formation rate (as sampled by H or a UV excess over that of an old population), or incidence of star formation signatures scale with cluster luminosity, cluster mass, or BCG stellar mass.
Ten of these REXCESS BCGs reside in clusters classified as cool cores on the basis of their short central cooling times ( Gyr) and large central ICM electron densities (Pratt et al., 2009). Among the 10 BCGs in cool-core clusters, 8 have powerful radio luminosities ( W Hz-1 at 1.4 GHz). These estimates are based on NVSS fluxes and converted 843 MHz fluxes from SUMSS, assuming a spectral power law index of -0.7 (Heidenreich et al., in prep.), in accord with the finding that radio-loud BCGs are found only at the centers of cool-core clusters or in galaxy-scale ( kpc) coronae (Cavagnolo et al., 2008; Dunn & Fabian, 2008; Sun, 2009). One non-CC cluster, RXCJ0211.4-4017, is on the border between CC and non-CC based on its cooling time, also has a similarly powerful radio source, a source which should be in a compact X-ray corona, based on the predictions by Sun (2009).
Pratt et al. (2009) present the key X-ray scaling relations between , , (product of gas mass and ), and among the REXCESS clusters. The measurement errors are negligible () compared to the intrinsic scatter. They found that the main source of scatter in the relation and other scaling relations is the variation of gas fraction with mass. Cool core (CC) clusters, defined by their central gas density and cooling time (Croston et al., 2008), occupy the high-luminosity envelope of the relations while morphologically disturbed (D) clusters, defined by size of their centroid shift, occupy the low-luminosity envelope. While exclusion of the central region significantly reduces the scatter in these relations, (see also Markevitch (1998); Fabian et al. (1994)), the segregation of CC and D systems persists. We show here that the CC and non-CC in REXCESS host distinctly different populations of BCGs, confirming trends seen in optical emission lines (e.g., Cowie et al., 1983; Heckman et al., 1989) and optical colors (e.g., McNamara & O’Connell, 1989).
Mergers may play an important role in setting the central entropy level of the non-CC systems in REXCESS (Pratt et al., 2010). Haarsma et al. (2010) present R-band photometry for the BCGs in REXCESS clusters and analyze it in context with the cluster X-ray properties (Pratt et al., 2009; Croston et al., 2008). The most intriguing correlation was between the central ICM electron density and the optical light in a metric kpc aperture, but only for non-CC clusters. They suggest that this correlation may be based on common physical processes - mergers and interactions - setting the density of stars and the density of gas in cluster cores with long cooling times. We use the same optical images and surface brightness profiles as in Haarsma et al. (2010), although we adopt a slightly smaller metric aperture ( kpc) than used in that work.
3. Ultraviolet Photometry
The Optical Monitor (OM) Telescope is a 30 cm optical/UV telescope co-aligned with the X-ray telescopes on board XMM- Newton (Mason et al., 2001). It is capable of simultaneous observations with the XMM X-ray detectors. We present data taken with the UVW1 (270 nm) and the UVM2 (220 nm) filters. The detector is a micro-channel plate intensified photon-counting CCD. The field of view is across, instrument pixels. Photons are centroided to within 1/8 of an instrument pixel, yielding effective centroiding pixels, each on a side, which are binned in the low resolution images (LR) and are unbinned in the high resolution (HR) images. Because of limitations on on-board memory, the LR images are limited to binned pixels, and HR images are up to unbinned pixels. The OM observations used for photometry are listed in Table 1.
In the LR-mode, 5 exposures are required to cover the full field of view. Therefore, we used public, mosaicked OM images created for each observation (ObsID) by Kuntz et al. (2008). Since coincidence-loss and dead-time corrections are negligible for faint sources, photometry of faint sources is possible with these mosaics (Kuntz et al., 2008). We also required upper limits for non-detections, photometry for newer data, and photometry in metric apertures, so we did our own photometry of the mosaics. For a handful of sources, we compared the photometry from individual frames with that obtained from the mosaic, and the results were consistent. Our photometry of well-detected, compact sources spatially coincident with those published in the OMCAT (Kuntz et al., 2008), as well as photometry in the XMM-OM SUSS111The Serendipitous Ultra-violet Source Survey (http://heasarc.gsfc.nasa.gov/W3Browse/all/xmmomsuss.html) was created by the University College London’s Mullard Space Science Laboratory on behalf of ESA. gave similar results. Some discrepancies were found for extended sources, which was not surprising, since the catalogs are optimized for point source photometry.
Each mosaic frame was normalized to an effective exposure of 1000 seconds. The actual exposure time in the regions covered by the aperture was derived from the exposure maps accompanying each mosaic, in order to reconstruct the true number of detected counts for estimates of statistical uncertainty. The images are marred by slightly elevated count rates in the center of the field from scattered light. The BCG was identified from R-band imaging to be the brightest cluster galaxy within kpc of the X-ray centroid; in two instances (RXCJ2234.5-3744 and RXCJ1311.4-0120) this was not a clearcut choice, and those are discussed in Haarsma et al. (2010). We have included the 2MASS identifier for the BCG we identified for each cluster.
We used circular apertures with a radius of kpc, where , in order to derive a UV-optical (R) color. The full width, half maximum (FWHM) of the point spread function (PSF) of the Optical Monitor in the UV is typically for the UVM2 and UVW1 filters, respectively. The aperture radii, chosen for ease of comparison with BCG photometry in the literature (e.g. Postman & Lauer, 1995), are over double the FWHM of the PSF even for the most distant sources in our sample. We masked contaminating UV foreground or background sources in source and background apertures. We measured the background count rate in an annulus around the source. We expected scattered light to be a factor in background estimates, but the galaxies were sufficiently compact compared to the gradient induced by scattered light that this light proved to be mainly a cosmetic nuisance. We also obtained a separate estimate of the background count rate in multiple apertures similar to the source aperture. A comparison of the histogram of aperture count rates indicated that the assumption of Poisson statistics in the background was good if we avoided areas of scattered light, but the local annulus provided the most reliable estimate of the background near the source. The count rates were then converted to AB magnitudes using the zeropoints from the XMM Data Handbook: 18.5662 and 17.4120 for UVW1 and UVM2, respectively. All colors plotted in this paper have been corrected for Galactic extinction using the listed in Table 2 and the attenuation model from Fischera et al. (2003); Fischera & Dopita (2005). For reference, the color term subtracted from the apparent magnitude was , where was 2.11 for the UVW1 filter, 3.25 for UVM2 and the GALEX NUV filters, and 2.5 for the GALEX FUV filter. This model gives optical attenuation estimates consistent with those derived from the infrared maps of the Galaxy (Schlegel et al., 1998).
The signal-to-noise of each source was estimated from the relation:
| (1) |
where is the total number of counts inside the aperture, is estimated background counts per pixel, is the measured dispersion in , in units of counts pixel-1, is the number of pixels inside the aperture, is the total number of sky pixels used to estimate the background. The quantity is the square of the uncertainty in the mean background counts. Rather than assume the background was Poisson, we measured the dispersion directly. (The OM background is close to Poissonian based on this comparison.) A upper limit was computed for each aperture based on the Poisson uncertainty and the uncertainty in the mean background level, and in cases where the net counts did not exceed this background, we report this upper limit.
Photometric errors, including Poisson uncertainties and background subtraction, dominate. Flat fielding errors are estimated to be a few percent. There is also a systematic absolute calibration uncertainty of 222Talavera, A., OM Cal Team XMM-Newton Optical and UV Monitor (OM) Calibration Status, XMM-SOC-CAL-TN-0019, Issue 5.0, 30 Oct 2008. xmm2.esac.esa.int/docs/documents/CAL-TN-0019.ps.gz. To account for these systematic errors in estimating colors based on photometry from other observatories, we add a magnitude uncertainty of 0.05 in quadrature to all UV-optical colors in our analysis and plots. Errors reported for photometry in Table 2 are statistical only.
We utilized cross-matches of our BCG locations with the source catalog from the Galaxy Evolution Explorer (GALEX) data archive General Release 4 (GR4).333The GALEX archive is hosted by the Multi-Mission archive at the Space Telescope Science Institute (MAST). The near ultraviolet filter (NUV, 231 nm) has a similar center to the UVM2 OM filter, but is broader, and the far ultraviolet filter (FUV, 153 nm) is centered at a shorter wavelength (Figure 1). The GALEX telescope is more sensitive than the OM (in the UV), but typical GALEX exposures are far shorter and do not cover our full sample. The GALEX PSF () is significantly poorer than the OM’s PSF. Seventeen of the 25 BCGs with GALEX observations were matched in the GALEX catalog to better than , (11 of these with magnitude uncertainties better than 0.3 mag). We inspected each GALEX field, including images lacking BCG detections. Low-confidence sources from the GR4 catalog were rejected based on this inspection, and their fluxes were converted to upper limits. Two low-confidence sources remain on the detection list (RXCJ0821.8+0112 and RXCJ2218.6-3853) because of possible extended, but low surface brightness, emission visible in the image. These two sources are flagged in Table 3. The remaining sources were either detected robustly (magnitude uncertainties mag) or were detected in both bands. We do not base any strong conclusions on the GALEX data or the UVM2 data because of the large number of upper limits.
For at least one NUV/FUV detection (the BCG in RXCJ2234.5-3744), the GALEX magnitude represents a blended source and is too bright. This source is flagged in the tables and plots where it appears. The GALEX catalog contains aperture magnitudes for radii from . We interpolate these magnitudes and uncertainties to match the OM and SOAR-R apertures of kpc. Six of the eleven had FUV detections with better than 0.3 magnitude uncertainties. No believable FUV detection was found for sources lacking NUV detections. RXCJ2014.8-2430 lacked a corresponding FUV observation. We report these aperture measurements and total flux estimates in Table 3. The upper limits of sources observed by GALEX are for the shallow, wide-area all-sky survey (AIS) with exposures of seconds, not too different from the OM upper limits; however four of our GALEX fields have much deeper observations.
4. Optical Spectroscopy
4.1. SOAR Goodman Spectrograph
Optical spectra of the objects were obtained with the newly installed Goodman Spectrograph (Clemens et al., 2004) on the 4.1m Southern Astrophysical Research (SOAR) Telescope in Cerro Pachón, Chile. The observations were taken between September 2008 and May 2009. For all objects, a wide slit and a 600 lines-per-mm grating was used, for a wavelength coverage of 640-915 nm. Beginning 2009 April 17, a blue blocking filter (GG-495) was used to prevent second-order scattering of blue light onto the CCD, which was not a serious issue for any of these data. All data were taken during photometric observing conditions. All observations were taken under excellent conditions, nearly photometric, and good seeing (). Our strategy was to observe each object twice: once along the major axis and once along the minor axis. Due to hardware limitations for rotating the spectrograph, a fully perpendicular observation was not always possible. Information about the observations can be found in Table 4. Observations of spectrophotometric standard stars (Hamuy et al., 1992) were made for flux calibration (Table 4).
Data reduction consisted of CCD overscan subtraction, trimming the image. The Goodman spectrograph suffers from peak-to-peak spectroscopic fringing redward of about 7000 Å. We used normalized quartz flats taken directly after the completion of each exposure to remove this fringing signature. However, the fringing pattern shifts and distorts, probably due to flexure of the instrument. The fringing redward of 8000 Å was the most difficult to remove. Since the wavelength scale of a fringe feature was broader than a typical emission line, it was straightforward to determine which sources had emission lines brighter than Å in equivalent width. Wavelength solutions were obtained based on night sky lines. We measured redshifts, line widths, and equivalent widths, and estimated the H line luminosity.
We extracted single spectra with widths of 20-40 pixels, corresponding to in the spatial direction. We detected emission lines (H, [NII]6584/6548Å, [SII]6717/6730Å, and usually [OI]6300Å) from 7 BCGs out of 31. (The 32nd, the BCG in RXCJ1311.4-0121, also known as Abell 1689, is discussed in the next section.) We report upper limits and H equivalent width detections in Table 4 and emission line properties in Table 5. Error estimates incorporate counting statistics and fit uncertainties based on bootstrap simulations of the spectra, accomplished with the task splot in IRAF (Tody, 1993). The residual fringing modulates red Goodman spectra continua on wavelength scales somewhat broader than typical linewidths, and it represents the most serious source of systematic uncertainty. Upper limits are thus typically 1-2 Å. For H emission lines, underlying stellar absorption can affect the total flux estimate. We have added 1 Å of uncertainty in quadrature to our H equivalent width uncertainties. This uncertainty only matters for the faintest systems. The two most prominent emission line systems, RXCJ1141.4-1216 and RXCJ2014.8-2430, were also the bluest in and were the two best detections in the bluest OM UV filter, UVM2. RXCJ2014.8-2430 and RXCJ1141.4-1216 were also the brightest GALEX NUV sources, and in AB magnitudes. They represent the most luminous GALEX NUV sources in REXCESS as well.
4.2. Las Campanas DuPont Telescope Modular Spectrograph
To complete the spectroscopic coverage of a relevant comparison sample of X-ray bright clusters of galaxies, the Brightest 55 X-ray Cluster sample (B55; Piccinotti et al. 1982), we report here upper limits for BCG H emission lines, as obtained using the Modular Spectrograph444http://www.lco.cl/lco/telescopes-information/irenee-du-pont/instruments/website/modspec-manuals/modular-spectrograph on the 2.5 meter DuPont Telescope on Las Campanas. These observations were taken and reduced as described in Donahue & Voit (1993). One of these clusters, Abell 1689 (RXCJ1311.4-0120), is also in the REXCESS sample. We provide here upper limits of H equivalent widths of Å for four additional BCGs in clusters with unknown emission-line properties: Abell 1650, Abell 3571, Triangulum Australis, and Abell 4038. Abell 4038 is also known as Klemola 44. Our results are reported in Table 6. Other optical emission line measurements for the B55 sample are provided in Peres et al. (1998), Crawford et al. (1999), and Cavagnolo et al. (2009). Non-detections of emission-line signatures from 3C129 and Abell 3532 (Klemola 22) are reported in Spinrad (1975) and Cristiani et al. (1987), respectively.
5. Ultraviolet - Optical Colors and UV Excess Estimates
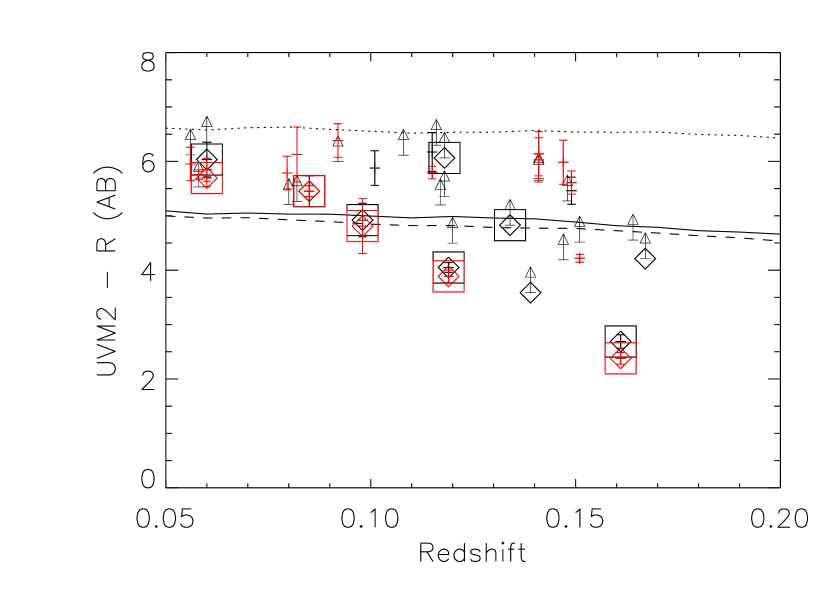
Examples of UV spectra of low redshift ellipticals, M60, NGC1399, and M49, kindly provided by Thomas Brown, are shown in Figure 1, along with the wavelength coverage of the four UV filters used in this work, OM-UVM2, OM-UVW1, GALEX-NUV, and GALEX-FUV. The observed UVW1-R, UVM2-R, and FUV-R colors are plotted as a function of redshift in Figures 2, 3, and 4. Figure 2 includes NUV-R colors for BCGs detected with GALEX, plotted in red.
The measured UV-optical colors of the REXCESS BCGs exhibit a scatter beyond that expected from measurement uncertainties alone. We assess a systematic uncertainty in the UV zero point magnitudes of magnitudes, added in quadrature to the statistical uncertainties reported in Table 2. The average UVW1-R AB color for the galaxies without H emission and with both R and UVW1 measurements (21 galaxies) is . This mean excludes the two bluest BCGs in UV-optical colors (, RXCJ2014.8-2430 and RXCJ1141.4-1216), and the other 5 BCGs with emission lines. Even with these exclusions, the scatter significantly exceeds the measurement error. For all 28 galaxies with R and UVW1 measurements, the average UVW1-R color is . The colors of the non-emission-line BCG sample are consistent with the redshifted template spectra of nearby ellipticals. Only the colors of galaxies with emission lines, and presumably recent star formation, deviate significantly from the colors of the templates (Figure 2). The same conclusion is true for the small sample of our clusters with bluer NUV and UVM2 colors (Figure 3).
One might worry that emission lines may contaminate the R-band measurement. We note that the two BCGs with the most excess UV () and brightest H emission are among the brightest BCGs in the sample, RXCJ1141.4-1216 and RXCJ2014.8-2430, with rest-frame R magnitudes of -23.4 and -23.2, respectively. But the least luminous BCG in our sample, RXCJ2319.6-7313 with a rest-frame R magnitude of -21.8, is also an emission-line system. The summed equivalent widths of the emission lines (only a few of which fall into the R bandpass) are quite small compared to the bandwidth of the R filter.
It is illustrative to consider the huge impact on the UVW1-R color of a tiny amount of star formation, predicted by stellar synthesis models. For example, Han et al. (2007) derive spectral energy distributions (SEDs) for a single age population wherein mass transfer in binary stars is the mechanism for producing the UV-upturn stars in the old population. The color of the 15 billion year old population is (), compared to a 100 million year old population color of (). A very small population of newly formed stars has a dramatic impact on the UV-optical colors.
Recent UV results for M87 from the Advanced Camera for Surveys Solar Blind Channel suggests that some of the far UV could even come from [C IV] (1549 Å) emission (Sparks et al., 2009). The GALEX FUV fluxes could also be affected by the presence of Lyman , for the sources; [C IV] may contribute to flux in the broad NUV filter. However, as we will show in §6, the lack of a redshift trend in colors suggests contributions from UV emission lines are insignificant, at least for this sample of BCGs.


6. Discussion
For the purposes of the following discussion, we classify galaxies as active if they host an emission line system with H equivalent width Å, and as inactive if they don’t.
6.1. UV Emission from Brightest Cluster Galaxies
Because we have reliable X-ray measurements for every cluster and because the X-ray sample is selected specifically to calibrate scaling relationships, our sample is particularly well-suited for studies of possible relationships between BCG star formation and BCG UV-optical colors, but also among BCG mass, luminosity, cluster mass, and cluster dynamic state. Our emission-line based classification of inactive vs. active is consistent with that used to classify elliptical galaxies for GALEX galaxy studies. Although our original intent for our BCG study was to examine the stellar mass (Haarsma et al., 2010) and star formation signatures (this paper) in these BCGs, the scope of this paper expanded to include quantifying the contribution of the UV from the older population, since an excess UV attributed to star formation must be over and above that contributed by old stars. That we detected nearly all of the BCGs in the UVW1 band of the XMM OM means at least some of them are dominated by old stellar populations.
All BCGs seem to have at least some UV emission despite their “red and dead” reputation. Elliptical galaxies exhibit differing amounts of UV shortward of 2500Å, sometimes called the UV upturn, because slopes upward to shorter wavelengths (see O’Connell (1999) for a review and references.) Brown et al. (2000, 2002), using HST observations, showed the culprits for this emission turn out to be extreme horizontal branch stars (eHBs). The UV continuum light from galaxies therefore can be produced by two different populations of stars: (1) the most massive, recently formed stars and (2) eHBs. In order to assess the amount of excess UV attributable to recent star formation, we need to establish the baseline contribution of the old population. This task is not as easy as it might sound. As long as these old UV stars are numerous, the UV-optical colors of an inactive BCG should be relatively constant for BCGs of similar metallicity, but observations show that the UV colors of ellipticals exhibit scatter. One explanation is that the UV-optical color of an elliptical galaxy is exquisitely sensitive to any star formation in the last 100 billion years. Studies of inactive elliptical galaxies show that tiny amounts of star formation can induce scatter in UV-optical or near infrared colors as large as observed, even though their line emission is below detection thresholds similar to those of our study (e.g. Yi et al., 2005; Kaviraj et al., 2007; Rawle et al., 2008). The REXCESS sample includes BCGs with and without line emission, so we discuss the implications of our data for both populations.
Commonly-used population synthesis codes, such as Bruzual & Charlot (1993) or Starburst99555http://www.stsci.edu/science/starburst99/ (Leitherer et al., 1999), do not predict the UV spectrum of an old stellar population (e.g., Magris & Bruzual, 1993). Therefore, in order to explore the baseline UV contributions of an old population, we turned to empirical UV spectral templates (M60, M49, and NGC 1399) to generate the inferred observed broadband colors as a function of redshift in Figures 2, 3, and 4. Our results suggest that BCGs hosting old populations with little to no star formation have a limited range of UV-optical colors, and that BCGs with UV-optical colors bluer than this range host the strongest emission-line systems, and presumably, recent star formation. Whether the latter is true or the H emission comes from a low-luminosity AGN, accretion of cold gas by the BCG has taken place.
The elliptical galaxies for which we have templates host old stellar populations, as confirmed by the presence of H equivalent widths, 1.4–1.6 Å in absorption (Kuntschner, 2000; Kuntschner et al., 2001). The templates demonstrate that over the redshift range of our sample, there is very little color change arising from shifting the baseline spectrum as a function of wavelength, so we do not k-correct our UV magnitudes, in order to stay as close to the data as possible. The templates also show that for a galaxy, the UVW1 bandpass sits at the local minimum between the UV upturn feature shortward of 250 nm and the near-UV (250 nm rest) emission from normal stars (Figure 1). Therefore the sensitivity of the UVW1-optical color to the behavior of eHB stars is minimized compared to UV-optical colors based on the GALEX filters. The templates also show variation in this color between them.
The inactive BCGs in our sample seem to represent a sample of galaxies with less dispersion in their UV-optical colors than that of ellipticals as a whole, and their colors are consistent with colors of inactive ellipticals. Whether this uniformity means that they have much less contamination from star formation, or are more uniform in their metallicity and age than their lower-mass cousins, is an open question.
On the other hand, the BCGs in our sample with emission-lines show a consistent correlation between excess UV emission (over that expected from an old population) and the strength of the H emission line. This correlation suggests that star formation is occurring in the subset of BCGs where we expect star formation (e.g., Cavagnolo et al., 2008; Dunn & Fabian, 2008): the cool cores with the shortest central ICM cooling times. The UV-optical colors of these objects therefore appear to be sensitive to star formation.
6.2. Correlation of H Equivalent Width with Cluster Properties and UV-Optical BCG colors
BCGs with a UV excess over and above what is expected from an old population are more likely to exhibit H emission. Furthermore, the line strength of H is strongly correlated with the UV excess (Figure 5).

Seven BCGs in our sample exhibited detectable H emission (also [N II]6548Å, 6584Å, [S II]6717Å, 6731Å, and occasionally [O I]6300Å). All of these BCGs inhabit clusters identified as cool cores (CC) in Pratt et al. (2009), and all of these are associated with a 1.4 GHz radio source. All 3 CCs in Pratt et al. (2009) that were not detected in H have central cooling times estimated from XMM observations (at ) longer than years, while only 2 out of 7 in the detected sample have cooling times this long.
Six of these seven emission-line BCGs also showed a UV excess, as defined by having a UVW1-R color significantly bluer (UVW1-R or NUV-R) than that expected from ellipticals with no star formation (UVW1-R, NUV-R). The brightest two of these were the only two galaxies in the sample with detected OM UVM2 flux at a statistical confidence . Five of the six emission-line galaxies with public GALEX NUV observations were detected in the NUV, whereas 11 of the 17 non-emission line BCGs with such observations were detected, and none of them with .
Cluster ICM core properties of electron density () and cooling time are strongly correlated with H equivalent widths. In Figures 6-8 we show two strong correlations (with central electron density and cooling time), and, for comparison, a weak correlation (with cluster mass). We explored several tests of correlation, using tasks in the survival statistics package in IRAF/STSDAS (Isobe et al., 1986). Survival statistics utilize information in the upper limits as well as the detections. The measures of correlation (or lack thereof) were consistent from test to test. A generalized Kendall’s test and Spearman’s test showed the probability that the equivalent width of H was not correlated with central electron density or cooling time was . A similar set of tests showed that the probability the equivalent width of H was not correlated with the UV-optical color was . Similarly, pairing UV-optical colors with central electron density or cooling time produced probabilities of that the paired properties were not correlated. The UV correlations with H, central electron density, and cooling time are undoubtedly diluted by the fact that most of the galaxies in our sample have UV emission dominated by an old stellar population. For contrast, the same statistics for the correlation of X-ray mass and H equivalent width gave a probability that it was not correlated, which confirms the visual impression.
We computed the [NII]6583/H ratios for the seven BCGs with H emission. We note that the [NII]/H ratio is unusually high for HII regions, but in the range observed for cooling flow BCGs (e.g. Heckman et al., 1989) (Figure 9). This ratio, which is sensitive to the temperature and excitation of the emission line gas, trends with the relative strength of the H line, in equivalent width here. The most luminous H systems have lower [NII]/H ratios than the weak systems. The less luminous emission line systems may be increasingly dominated by excitation processes such as cosmic ray heating, conduction, and even weak shocks (e.g., Ferland et al., 2008), while the more luminous systems may have proportionally more heating from stars. Forbidden line emission can be elevated in photoionized systems with additional sources of heat (e.g. Voit & Donahue, 1997). This interpretation is consistent with the correlation of UV-optical color and H equivalent width. For this work, we interpret H and forbidden line emission as signs of activity, at least some of which is associated with recent star formation, but we note the many alternate sources of H that may be present in these systems (Ferland et al., 2008; Heckman et al., 1989; Voit & Donahue, 1990; Jafelice & Friaca, 1996; Begelman & Fabian, 1990).


6.3. Incidence and Rate of Star Formation in Cluster Samples
The star formation rates based on a UV excess or an H luminosity in terms of a specific star formation rate are model-dependent. H emission is sensitive to the most recent star formation, since only the hottest, shortest-lived stars ionize hydrogen. H rates are therefore closer to being an instantaneous measure of star formation. In contrast, the UV is sensitive to a broader range of hot stars, and therefore the age of the burst affects the magnitude of the star formation rate. The UV is easily obscured by gas and dust, and represents a lower limit, modulo the age assumption. Furthermore, the lack of certainty about the exact level of UV light contributed by eHBs affects the estimate of UV excess for the fainter systems (the level of the baseline is irrelevant for strong UV excesses.) Finally, any given amount of UV excess light can be associated with a nearly limitless amount of stars associated with a single burst, since a tiny amount of UV can represent the UV tail of a huge burst, say years ago. The UV rates computed here are based on an assumption of continuous star formation, which provides SFRs at the low end of the scale (Kennicutt, 1998).
The excess UV of the two bluest galaxies in UV-optical light is consistent with that emitted by an unobscured population continuously forming stars for timescales longer than years, at about 2 solar masses per year for RXCJ1141.4-1216 and 8 solar masses per year for RXCJ2014.8-2430, based on a UV excess over a baseline color of (Kennicutt, 1998). Similar star formation rates are inferred from relations produced by models in Hirashita et al. (2003), in which the onset of constant star formation ranges between years in the past (Table 5). The rates for the more recent times of onset are about 60% higher because the UV luminosity increases to a maximum at a population age of years (Hirashita et al., 2003). These rates are underestimates, since we have not taken into account attenuation of the UV by the interstellar medium of the host galaxy.
H is produced by ionization by the hottest, youngest stars, and therefore the star formation rate based on H emissions is an indicator of the nearly instantaneous star formation rate. Table 5 shows that the H rates are consistent with the range of derived UV rates. The approximate diameter of the brightest two emission lines systems is kpc (of order twice the slit width), similar to that of the emission line nebula in Abell 2597 (Voit & Donahue, 1997). Given the unknowns in the estimation process (attenuation, star formation history, slit for an extended source H measurement), any differences in the rates can be easily explained. For example, somewhat higher UV rates can be explained by an older starburst and slit losses, and somewhat higher H rates can be explained by moderate UV attenuation. Therefore, to first order, the production of UV (in excess of that from an old population) and optical emission lines in these systems is not pathologically different from that seen in star-forming galaxies.
The main result is that the appearance of emission lines together with a UV excess is consistent with star formation being the source of both. None of these galaxies has an X-ray or optically-bright AGN; however, since 8 out of 10 (9 out of 11 if one includes RXCJ0211.4-4017 as a cool core) of the cool core clusters in this sample have radio loud AGN, some of the H may be associated with the AGN. For example, cosmic-ray heating from relativistic particles may be important in generating some of the H emission (Ferland et al., 2008), especially in the weaker systems, in which the larger [NII]/H () ratios suggest that the interstellar gas may be hotter than typical of regions photoionized by stars. We showed in the previous section that the H equivalent width is correlated with the UV excess; so at least some of the H luminosity is likely generated by UV-producing stars.
The incidence of emission-line sources in the REXCESS sample (22%) is slightly low compared to the incidence of H-emitting systems in other low-redshift cluster samples, but not remarkably so. The B55 sample (Piccinotti et al., 1982; Peres et al., 1998), including the spectroscopic observations reported in Table 6, has an incidence rate of for the now complete sample. For the sample of X-ray clusters in Crawford et al. (1999), the incidence was . Bauer et al. (2005) show that in the BCS/EBCS (Ebeling et al., 1998) sample with , 13 of the 33 clusters with public Chandra data and available optical spectroscopy had H, an incidence rate of . A study of luminous Extended Medium Sensitivity (EMSS) X-ray clusters (Stocke et al., 1991; Gioia et al., 1990), at from the Einstein Observatory, (Donahue et al., 1992), showed rates of 40-50% in a flux-limited, complete, but high X-ray luminosity, sample. They reported only weak evidence for lower incidence at the highest redshifts of this study, so there was very little evidence for evolution in the incidence rate for . In contrast, Vikhlinin et al. (2007) claim there is a lack of X-ray evidence for cool cores at high redshift (), which implies also that very few high-redshift BCGs will host emission line systems.
BCGs of optically-selected clusters have a much lower incidence rate of emission lines. von der Linden et al. (2007) found an incidence rate of in a study of 625 Sloan Digital Sky Survey BCGs in optically-selected clusters (Miller et al., 2005) with a control sample matched in absolute magnitude, redshift, and color. This rate was not much higher than that of the control sample. However, this study omitted the most massive BCGs because of the lack of truly massive galaxies in their control sample. Edwards et al. (2007) examine 93 clusters (selected somewhat heterogeneously, including both X-ray selected clusters and optically selected C4/DR3 clusters) between . Of these, had emission lines, with no trend in galaxy magnitude or velocity dispersion. Of the “cooling flow” clusters, had optical emission; if those BCGs were within 50 kpc of the X-ray centroid, 85-100% had optical emission. If the cooling flow clusters were omitted, only 10% of the sample had any line emission, similar to the control sample.
Statistically, the incidence rate in the REXCESS sample is somewhat lower than that of other X-ray samples (B55 and EMSS, for example), and similar to that of optically selected samples. The binomial probability of finding seven or fewer BCGs with emission lines given an expectation of 15% is about 9.8%, statistically consistent with the incidence rate in optically-selected cluster surveys. If the expectation of detecting emission lines is 35%, the probability of finding seven or fewer is 4.5%, indicating a result about different from expectations for X-ray selected surveys. REXCESS therefore has a somewhat lower number of BCGs with optical emission lines than the B55 (Crawford et al., 1999) or EMSS (Donahue et al., 1992) samples. The incidence of emission line systems inside the cool-core sample (7 out of 10) is certainly consistent with the high incidence () found in Edwards et al. (2007).
We note that the comparisons presented here are not of cluster samples matched in mass. The number density of clusters in the wide-area optical surveys is high, so their average masses must be lower and the range of masses sampled greater than the X-ray selected surveys under discussion here. The B55 and EMSS samples are complete, flux-limited samples, which REXCESS is not. We do not see, to the limit of our small detection statistics, evidence for some dependence of the incidence rate of emission-line BCGs on the mass of the cluster, but the REXCESS sample does not include low mass clusters or groups.
The explanation - if one is needed for a 2 discrepancy - is not clear. X-ray flux-limited samples have on average higher-mass clusters than the larger optically-selected samples. They may preferentially include objects with higher gas mass fractions for a given mass or objects with X-ray bright cool cores (Pratt et al., 2009; Fabian et al., 1994; Edge et al., 1992). Analysis of the REXCESS sample itself shows no evidence whatsoever of any mass dependence of the presence of a cool core (Böhringer et al., in preparation). Certainly, the EMSS may have included a few more cool-core clusters because of its fixed-size sliding-box selection method, as discussed in Donahue et al. (1992). However, the B55 survey was selected by collimator flux, and therefore is unlikely to be biased towards cool core clusters. The REXCESS selection had no specific morphological criterion, so one might expect the selection to be similar to that of the B55 sample. The relatively small sample size, however, does not allow hard conclusions to be drawn, since the similarity in REXCESS BCG emission-line incidence to that of an optically selected sample could be coincidental. Other X-ray samples are limited in their size, dynamic range in mass or redshift, and the degree to which the sample contents are representative of the full population of clusters of galaxies (Vikhlinin et al., 2007; Santos et al., 2008; Sun et al., 2007).
The discrepancy in the emission-line BCG incidence rates between optically- and X-ray-selected samples does not appear to have a ready explanation in terms of incidence rates varying with cluster masses, X-ray temperatures, or BCG optical luminosity, at least to the limits probed by the REXCESS cluster sample. However, we do see a strong correlation with the presence of low entropy gas, short central ICM cooling times, high central electron densities, and, as we will show below, relaxed dynamical state. If optical samples include a larger proportion of unrelaxed, disturbed clusters and a smaller proportion of clusters with cool cores, then the lower incidence rates of emission-line BCGs in optical samples is easier to understand. Larger and more inclusive studies, with attention to sample selection, are required for further progress in exploring the incidence of star formation in BCGs of clusters of galaxies of all types, in order to understand how and why the thermodynamic state of the intracluster gas is coupled to star formation in the BCG.
6.4. Are Inactive BCGs Nearly Identical?
For reasons unknown, BCGs are surprisingly good standard candles, at least at low redshifts (Postman & Lauer, 1995), and inactive BCGs may be an even more homogeneous set. In the following sections we will explore the apparent similarity of the UV and optical properties in the inactive BCGs in our sample, as well as the tendency for outliers to host H emission line systems. We will show that the UVW1-R color, a quantity sensitive to metallicity and age of the stellar populations, is insensitive to BCG R-band luminosity and color in a metric aperture and to the redshift range spanned by our sample. Because the REXCESS clusters have homogeneous and high quality X-ray measurements, we are also able to show that the UVW1-optical colors of inactive BCGs do not vary with halo gas temperature (equivalently cluster halo mass) or dynamical state.
6.4.1 Lack of Trends in UV-Optical and Optical-Infrared Colors
As we showed in § 5, the UVW1-R colors of the inactive galaxies are , with a typical reddest color of . The galaxies with emission lines comprise the outliers in the observed color relationships. Because this sample includes brightest cluster galaxies only, the dynamic range in stellar mass and optical luminosity is not large. Over the luminosity range spanned by our sample, we do not detect any trend in the observed UV-optical colors of the BCG sample with R magnitude or, if M/L is similar, stellar mass inside a kpc aperture (Figure 10). Notably, the emission-line systems identify nearly all of the systems that differ the most from the mean UV, optical and near-IR relations for these BCGs.
We note that the scatter in the corresponding rest-frame R-K colors for the 30 galaxies in our sample with 2MASS (Skrutskie et al., 2006) K-band measurements is only 0.15 (), from Haarsma et al. (2010). Excluding the two BCGs with red colors (R-K), RXCJ 1302.8-0230 and RXCJ 2319.6-7313 (both of these are emission-line BCGs in cool core clusters), the dispersion drops to 0.11 (), and is not much larger than the B-R scatter () in metric colors reported for a low redshift BCG sample by Postman & Lauer (1995). A similar result is obtained if all REXCESS cool-core BCGs are omitted from the estimation of the mean color. The typical measurement uncertainty for R-K is about 0.10 mag, including systematics. Most of the statistical uncertainty arises from the 2MASS K-band photometry. But some mag of this uncertainty is the systematic offset between SOAR and 2MASS photometry, and should not add to the scatter. Therefore some of the scatter in R-K is intrinsic, and is related to the metallicity and age of the underlying populations. If R-K and UVW1-R colors were sensitive to the same underlying condition (metallicity and age) there might be a correlation, with the UVW1-R scatter being more sensitive. To test whether the scatter in R-K is correlated with the scatter in UVW1-R, we plotted these colors in Figure 11. Since we see that UVW1-R is not correlated with R-K for the inactive BCGs, we can conclude that whatever variations in the stellar population drive variations in the UV-R color (presumably metallicity and age), those variations are not detectable in R-K colors measured to 8% or better.
The BCGs in the sample with the reddest outlier R-K colors (RXJ 1302.8-0230 and RXJ 2319.6-7313) exhibit somewhat bluer UV-optical colors (a , compared to a mean of ). They show no obvious central point sources (indeed, no BCG in our sample does), and these two galaxies exhibit weak but detectable H emission. The H emission and a redder R-K color may be indicative of the contribution from a recently formed sub-population of stars. There are at least two counter arguments to this hypothesis. (1) The [NII]/H ratios in these two systems are higher than seen in HII regions. As mentioned in § 6.2, the high ratios in weak emission-line systems may indicate processes at work other than star formation. (2) The two most powerful emission-line BCGs (RXJ 2014.8-2430 and RXJ 1141.4-1216), exhibit R-K colors typical for the REXCESS sample, suggesting that excess flux from emission lines themselves is not sufficient to cause color anomalies. The equivalent widths of the emission lines in the 2 R-K outliers are also very small compared to the width of the R-band filter. Therefore, we have no ready explanation for the two outliers, aside from the fact they are notably BCGs with line emission, clearly not inactive.


6.4.2 Lack of Trend of UVW1-Optical Color with Redshift or Halo Properties
Our data show no trend of UV-optical colors with redshift, galaxy mass, or the mass of the cluster of galaxies. Figure 2 shows that inactive BCGs in the sample exhibit no correlation of UVW1-optical color with redshift. Within the range of absolute magnitudes probed by these BCGs, we do not see a trend with optical luminosity or R-K color. Since the optical mass-to-light ratios of these galaxies are likely to be similar, this lack of trend implies that the UVW1-optical colors of our inactive sample are also insensitive to the mass of the host galaxy. Figure 12 shows no correlation of UV-optical color with X-ray temperature for the inactive BCGs in our sample. Since is strongly correlated with cluster gravitating mass, this result suggests the UVW1-optical color of the BCG is insensitive to the mass of the host cluster.
In Figure 13 we show a plot of UV excess vs. , where the latter is the standard deviation of the distance between the X-ray peak and emission centroid evaluated in increasing apertures, as detailed in Boehringer et al. (2009). This parameter has been shown to reflect quite closely the true dynamical state of a system in the simulations of Poole et al. (2006). As can be seen in Figure 13, there is no clear trend of UV excess with dynamical state.


In summary, we can say that the lack of observed trends suggests that no matter what the level of undetected star formation in the inactive BCGs might be, the UVW1-R colors of inactive BCGs are not affected by the degree of dynamical relaxation measured by the parameter , by the mass of the host cluster, or indeed by anything we have measured thus far.
6.5. Potential for Insights into the UV-Upturn Phenomenon
The bluer UV photometry measurements, including UVM2 photometry from the XMM Optical Monitor, and the NUV (with similar but broader than the UVM2 bandpass) and FUV photometry from GALEX, are more sensitive to the contributions of the UV-upturn population, the eHBs, than the UVW1 filter. However, for this analysis, the data were too shallow to detect most of the BCGs in the sample and the colors even for the detected galaxies are not very accurate, especially for the inactive galaxies. Our primary interest in this paper is in the star formation properties of the BCGs and how they correlate with cluster and BCG properties, but we briefly discuss the potential of this sample for studying the properties of UV emission from older stars.
The mechanism for creating an extreme horizontal branch star is unknown, but a survey of the literature revealed two classes of possibilities for prematurely exposing the hot core of a horizontal branch star: (1) Extreme winds, sensitive to metallicity (e.g. Yi, 2008) and (2) Mass transfer in binary stars (Han et al., 2007). A possibly relevant wrinkle to these mechansims is based on the idea that helium preferentially settles in the cores of massive clusters, enhancing the UV produced by helium core-burning stars (Peng & Nagai, 2009; Lee et al., 2005).
The wind-based explanations for the eHB stars predict a trend of reddening UV-optical colors with redshift since (e.g. Yi, 2008). Whether variations in the relative UV component from galaxy to galaxy are indeed correlated with metallicity is still a matter of debate: Burstein et al. (1988) reported a correlation between Mg2 index, considered a metallicity indicator, and UV excess, but Rich et al. (2005) see no correlation in a sample of 172 early-type galaxies. It is possible that star formation in lenticulars dilutes this relation in a sample of early-types, as Donas et al. (2007) see a weak correlation in ellipticals, but none in lenticulars. However, Rawle et al. (2008) show NUV-J colors of cluster red-sequence galaxies exhibit a strong correlation with metallicity, and suggest that a relatively tiny amount of star formation could introduce the large scatter seen even in this color.
In their GALEX study of a dozen BCGs at , Ree et al (2007) report evolution of GALEX FUV-V colors. In contrast, the inactive BCGs (plotted without diamonds or squares in Figure 4) in our sample do not differ in their UV-optical or FUV-optical color in a significant way from each other or from the three low redshift template galaxies, one of which (NGC1399) is the bluest local galaxy in Ree et al. (2007). Assuming , the 11 measurements in our sample are somewhat bluer than the dozen galaxies discussed in Ree et al. (2007). The REXCESS non-detections must be redder than the detections, and therefore the colors of those galaxies likely overlap their measurements. However, the presence of inactive but blue BCGs at suggests that the evolution may not be so strong as suggested by the single star wind models. Alternatively, UV emission from recently formed stars, in galaxies without detectable H emission, would confound empirical tests of this model. The comparison to the Ree et al. (2007) dataset is further compromised by several limitations. Ree et al. (2007) use estimated total optical magnitudes, while our colors are measured in fixed metric apertures. A total optical magnitude of a BCG is difficult to measure definitively, because they often have an extended halo of stars that fades into intracluster light, whose luminosity is comparable to that of the central portions of the BCG (Gonzalez et al., 2005). The UV emission seems more compact than the optical emission, and so the choice of aperture size affects the inferred color. Furthermore, the shallowness of most of the archival FUV observations covering our sample means we can only detect the bluest examples of the brightest galaxies, with color uncertainties ranging from 0.1-0.4, and thus we may be detecting only the galaxies in our sample with recent star formation. Given those limitations of the archival data, the similarity of the colors may even be surprising. Deeper observations with more accurate FUV fluxes and compatible optical measurements are required for a comparison with the full REXCESS BCG sample, to probe the range of FUV colors in this sample. Accurate FUV-NUV colors would be a useful diagnostic in distinguishing the contribution of UV upturn stars from non-ionizing but relatively young main-sequence stars.
The helium excess model, further developed by Peng & Nagai (2009), predicts that the amplitude of the UV upturn should correlate with the dynamical state of a cluster. A high helium abundance affects the production and the UV upturn strength of eHB stars (e.g. Dorman et al., 1995). In the model of Peng & Nagai (2009), the central helium abundance in a cluster of galaxies is enhanced by sedimentation in relaxed systems. If the UV emission in the inactive systems is dominated by these old stars (and not low levels of star formation), the lack of correlation with dynamical state suggests that helium sedimentation cannot explain the observed range of UV colors in these galaxies.
Intriguingly, a binary star model for origin of the UV upturn (Han et al., 2007) predicts an almost constant UV-optical color. In this model, binary interactions strip horizontal branch stars. This process is independent of metallicity and redshift.
All of the models are difficult to challenge with observations, because tiny amounts of star formation, impossible to detect with conventional emission line diagnostics, may obscure or induce trends, particularly at 250 nm. It is notable, for example, that to reproduce the observed level of scatter in UV-optical or UV-infrared colors, Han et al. (2007) must add a second, younger stellar population to produce significant amounts of excess UV in an otherwise inactive BCG or elliptical. Disentangling the contributions of the various populations of these systems (commonly regarded as simple, single age, elderly populations in the past) requires more UV work, particularly spectroscopy, to obtain the needed diagnostics. Deeper GALEX photometry of the REXCESS BCG sample would be useful to determine whether there are empirical trends in these high-mass objects. More sophisticated simulations are required to determine whether trends predicted from the simpler models we have in hand could be detected under more realistic conditions.
7. Summary and Conclusion
We report the results of UV broad-band photometry from the XMM Optical Monitor and from the GALEX mission and of long-slit optical emission-line spectroscopy for 32 BCGs in REXCESS. Seven of these clusters exhibit classic signatures of star formation activity associated with a cool-core cluster as a host. Indeed these seven BCGs inhabit the 10 clusters in the REXCESS sample with the shortest cooling times in the hot gas, as inferred from XMM observations, and the two most luminous of these in H are the most prominent cool core clusters in REXCESS. The incidence rate of emission-line BCGs is intermediate between that found in the B55 or EMSS cluster samples and that found in optically-selected SDSS clusters, possibly a consequence of the lack of morphological bias in the selection of REXCESS clusters. The BCGs with the largest H equivalent widths are also the BCGs with the bluest UV-optical colors. We report a correlation between the BCG H equivalent width and – to a lesser degree – the UV-optical color with conditions in the intracluster gas in the cluster core: the scaled core electron density and the gas cooling time. The incidence rates and the correlations suggest a physical connection between activity (emission-line excitation, recent star formation) in the BCG and the cooling time of the intracluster gas. We see no correlation between H equivalent width and X-ray temperature or cluster mass; we also see no correlation between the UV-optical color and cluster mass, temperature, or degree of relaxation, suggesting that whatever ignites BCG activity at low redshift is relatively insensitive to halo properties. This insensitivity is puzzling, given the difference in the incidence of emission-line BCGs in optically selected vs. X-ray selected samples of clusters of galaxies. A decreasing incidence (or strength) of emission-line BCGs with decreasing halo mass or BCG mass could have explained the discrepancy. However, we do not have evidence for a correlation of that nature, at least over the range probed by the REXCESS cluster sample. However, the strong correlation between the presence of low entropy gas and the appearance of star formation signatures suggests there is a connection between the nature of the cluster and conditions in its BCG. These star-forming BCGs also tend to inhabit clusters with low , characteristic of clusters with relatively relaxed dynamical states. Optically selected cluster samples may include a wider range of morphologies and dynamical states than that sampled by X-ray selected cluster samples.
Almost all () of the BCGs were detected in the OM UVW1 band, regardless of their emission-line activity. The UVW1-optical colors of these galaxies are consistent with the UV light of an old population, with excess UV coming from recent star formation. The UVW1 photometry is not strongly affected by the UV upturn stars, and therefore turns out to be a decent choice to study UV associated with star formation. We analyze archival GALEX and XMM OM UVM2 data at shorter wavelengths.
The inactive BCGs in our sample, classified as such by the lack of H emission, define a relatively homogeneous sample. The observed UV-optical colors of these BCGs (UVW1-R) are independent of redshift, BCG absolute rest frame R magnitude, and rest frame R-K color, suggesting that the UVW1-optical colors of inactive BCGs are also unrelated to BCG mass and metallicity. Their colors are independent of cluster temperature (a measure of the depth of the cluster’s gravitational potential) and degree of relaxation, as measured by the offset of the X-ray centroid from the X-ray emission peak. This lack of correlation means that the UVW1-R colors are not affected by the gravitating mass of the cluster or its dynamical state.
References
- Andreon (2008) Andreon, S. 2008, MNRAS, 386, 1045
- Bauer et al. (2005) Bauer, F. E., Fabian, A. C., Sanders, J. S., Allen, S. W., & Johnstone, R. M. 2005, MNRAS, 359, 1481
- Begelman & Fabian (1990) Begelman, M. C., & Fabian, A. C. 1990, MNRAS, 244, 26P
- Benson et al. (2002) Benson, A. J., Lacey, C. G., Baugh, C. M., Cole, S., & Frenk, C. S. 2002, MNRAS, 333, 156
- Binney (2004) Binney, J. 2004, MNRAS, 347, 1093
- Boehringer et al. (2009) Boehringer, H., Pratt, G. W., Arnaud, M., Borgani, S., Croston, J. H., Ponman, T. J., Ameglio, S., Temple, R. F., & Dolag, K. 2009, ArXiv:0912.4667
- Böhringer et al. (1993) Böhringer, H., Voges, W., Fabian, A. C., Edge, A. C., & Neumann, D. M. 1993, MNRAS, 264, L25
- Böhringer et al. (2007) Böhringer, H., et al. 2007, A&A, 469, 363
- Bower et al. (1992) Bower, R. G., Lucey, J. R., & Ellis, R. S. 1992, MNRAS, 254, 601
- Brown et al. (2000) Brown, T. M., Bowers, C. W., Kimble, R. A., Sweigart, A. V., & Ferguson, H. C. 2000, ApJ, 532, 308
- Brown et al. (2002) Brown, T. M., Ferguson, H. C., O’Connell, R. W., & Ohl, R. G. 2002, ApJ, 568, L19
- Bruzual & Charlot (1993) Bruzual, A. G., & Charlot, S. 1993, ApJ, 405, 538
- Burns (1990) Burns, J. O. 1990, AJ, 99, 14
- Burstein et al. (1988) Burstein, D., Bertola, F., Buson, L. M., Faber, S. M., & Lauer, T. R. 1988, ApJ, 328, 440
- Cavagnolo et al. (2008) Cavagnolo, K. W., Donahue, M., Voit, G. M., & Sun, M. 2008, ApJ, 683, L107
- Ciotti & Ostriker (1997) Ciotti, L., & Ostriker, J. P. 1997, ApJ, 487, L105+
- Clemens et al. (2004) Clemens, J. C., Crain, J. A., & Anderson, R. 2004, in Society of Photo-Optical Instrumentation Engineers (SPIE) Conference Series, Vol. 5492, Society of Photo-Optical Instrumentation Engineers (SPIE) Conference Series, ed. A. F. M. Moorwood & M. Iye, 331–340
- Cowie et al. (1983) Cowie, L. L., Hu, E. M., Jenkins, E. B., & York, D. G. 1983, ApJ, 272, 29
- Cowie et al. (1999) Cowie, L. L., Songaila, A., & Barger, A. J. 1999, AJ, 118, 603
- Crawford et al. (1999) Crawford, C. S., Allen, S. W., Ebeling, H., Edge, A. C., & Fabian, A. C. 1999, MNRAS, 306, 857
- Cristiani et al. (1987) Cristiani, S., D’Odorico, S., de Souza, R., Lund, G., & Quintana, H. 1987, A&A, 179, 108
- Croston et al. (2008) Croston, J. H., Pratt, G. W., Böhringer, H., Arnaud, M., Pointecouteau, E., Ponman, T. J., Sanderson, A. J. R., Temple, R. F., Bower, R. G., & Donahue, M. 2008, A&A, 487, 431
- Donahue et al. (1992) Donahue, M., Stocke, J. T., & Gioia, I. M. 1992, ApJ, 385, 49
- Donahue & Voit (1991) Donahue, M., & Voit, G. M. 1991, ApJ, 381, 361
- Donahue & Voit (1993) —. 1993, ApJ, 414, L17
- Donas et al. (2007) Donas, J., et al. 2007, ApJS, 173, 597
- Dorman et al. (1995) Dorman, B., O’Connell, R. W., & Rood, R. T. 1995, ApJ, 442, 105
- Dunn & Fabian (2008) Dunn, R. J. H., & Fabian, A. C. 2008, MNRAS, 385, 757
- Ebeling et al. (1998) Ebeling, H., Edge, A. C., Bohringer, H., Allen, S. W., Crawford, C. S., Fabian, A. C., Voges, W., & Huchra, J. P. 1998, MNRAS, 301, 881
- Edge et al. (1992) Edge, A. C., Stewart, G. C., & Fabian, A. C. 1992, MNRAS, 258, 177
- Edwards et al. (2007) Edwards, L. O. V., Hudson, M. J., Balogh, M. L., & Smith, R. J. 2007, MNRAS, 379, 100
- Fabian et al. (1994) Fabian, A. C., Crawford, C. S., Edge, A. C., & Mushotzky, R. F. 1994, MNRAS, 267, 779
- Ferland et al. (2008) Ferland, G. J., Fabian, A. C., Hatch, N. A., Johnstone, R. M., Porter, R. L., van Hoof, P. A. M., & Williams, R. J. R. 2008, MNRAS, 386, L72
- Ferrarese & Merritt (2000) Ferrarese, L., & Merritt, D. 2000, ApJ, 539, L9
- Fischera & Dopita (2005) Fischera, J., & Dopita, M. 2005, ApJ, 619, 340
- Fischera et al. (2003) Fischera, J., Dopita, M. A., & Sutherland, R. S. 2003, ApJ, 599, L21
- Gebhardt et al. (2000) Gebhardt, K., et al. 2000, ApJ, 539, L13
- Gioia et al. (1990) Gioia, I. M., Maccacaro, T., Schild, R. E., Wolter, A., Stocke, J. T., Morris, S. L., & Henry, J. P. 1990, ApJS, 72, 567
- Gonzalez et al. (2005) Gonzalez, A. H., Zabludoff, A. I., & Zaritsky, D. 2005, ApJ, 618, 195
- Haarsma et al. (2010) Haarsma, D. B., Leisman, L., Donahue, M., Bruch, S., Böhringer, H., Croston, J. H., Pratt, G. W., Voit, G. M., Arnaud, M., & Pierini, D. 2010, ApJ, 713, 1037
- Hamuy et al. (1992) Hamuy, M., Walker, A. R., Suntzeff, N. B., Gigoux, P., Heathcote, S. R., & Phillips, M. M. 1992, PASP, 104, 533
- Han et al. (2007) Han, Z., Podsiadlowski, P., & Lynas-Gray, A. E. 2007, MNRAS, 380, 1098
- Heckman et al. (1989) Heckman, T. M., Baum, S. A., van Breugel, W. J. M., & McCarthy, P. 1989, ApJ, 338, 48
- Hicks & Mushotzky (2005) Hicks, A. K., & Mushotzky, R. 2005, ApJ, 635, L9
- Hirashita et al. (2003) Hirashita, H., Buat, V., & Inoue, A. K. 2003, A&A, 410, 83
- Isobe et al. (1986) Isobe, T., Feigelson, E. D., & Nelson, P. I. 1986, ApJ, 306, 490
- Jafelice & Friaca (1996) Jafelice, L. C., & Friaca, A. C. S. 1996, MNRAS, 280, 438
- Kauffmann & Charlot (1998) Kauffmann, G., & Charlot, S. 1998, MNRAS, 294, 705
- Kaviraj et al. (2007) Kaviraj, S., et al. 2007, ApJS, 173, 619
- Kennicutt (1998) Kennicutt, Jr., R. C. 1998, ARA&A, 36, 189
- Kodama et al. (1998) Kodama, T., Arimoto, N., Barger, A. J., & Arag’on-Salamanca, A. 1998, A&A, 334, 99
- Kuntschner (2000) Kuntschner, H. 2000, MNRAS, 315, 184
- Kuntschner et al. (2001) Kuntschner, H., Lucey, J. R., Smith, R. J., Hudson, M. J., & Davies, R. L. 2001, MNRAS, 323, 615
- Kuntz et al. (2008) Kuntz, K. D., Harrus, I., McGlynn, T. A., Mushotzky, R. F., & Snowden, S. L. 2008, PASP, 120, 740
- Lee et al. (2005) Lee, Y., Joo, S., Han, S., Chung, C., Ree, C. H., Sohn, Y., Kim, Y., Yoon, S., Yi, S. K., & Demarque, P. 2005, ApJ, 621, L57
- Leitherer et al. (1999) Leitherer, C., Schaerer, D., Goldader, J. D., González Delgado, R. M., Robert, C., Kune, D. F., de Mello, D. F., Devost, D., & Heckman, T. M. 1999, ApJS, 123, 3
- Magorrian et al. (1998) Magorrian, J., Tremaine, S., Richstone, D., Bender, R., Bower, G., Dressler, A., Faber, S. M., Gebhardt, K., Green, R., Grillmair, C., Kormendy, J., & Lauer, T. 1998, AJ, 115, 2285
- Magris & Bruzual (1993) Magris, C. G., & Bruzual, A. G. 1993, ApJ, 417, 102
- Markevitch (1998) Markevitch, M. 1998, ApJ, 504, 27
- Mason et al. (2001) Mason, K. O., et al. 2001, A&A, 365, L36
- McNamara & Nulsen (2007) McNamara, B. R., & Nulsen, P. E. J. 2007, ARA&A, 45, 117
- McNamara et al. (2005) McNamara, B. R., Nulsen, P. E. J., Wise, M. W., Rafferty, D. A., Carilli, C., Sarazin, C. L., & Blanton, E. L. 2005, Nature, 433, 45
- McNamara & O’Connell (1989) McNamara, B. R., & O’Connell, R. W. 1989, AJ, 98, 2018
- McNamara & O’Connell (1992) —. 1992, ApJ, 393, 579
- Miller et al. (2005) Miller, C. J., et al. 2005, AJ, 130, 968
- O’Connell (1999) O’Connell, R. W. 1999, ARA&A, 37, 603
- Peng & Nagai (2009) Peng, F., & Nagai, D. 2009, ApJ, 705, L58
- Peres et al. (1998) Peres, C. B., Fabian, A. C., Edge, A. C., Allen, S. W., Johnstone, R. M., & White, D. A. 1998, MNRAS, 298, 416
- Piccinotti et al. (1982) Piccinotti, G., Mushotzky, R. F., Boldt, E. A., Holt, S. S., Marshall, F. E., Serlemitsos, P. J., & Shafer, R. A. 1982, ApJ, 253, 485
- Poole et al. (2006) Poole, G. B., Fardal, M. A., Babul, A., McCarthy, I. G., Quinn, T., & Wadsley, J. 2006, MNRAS, 373, 881
- Postman & Lauer (1995) Postman, M., & Lauer, T. R. 1995, ApJ, 440, 28
- Pratt et al. (2010) Pratt, G. W., Arnaud, M., Piffaretti, R., Böhringer, H., Ponman, T. J., Croston, J. H., Voit, G. M., Borgani, S., & Bower, R. G. 2010, A&A, 511, A85+
- Pratt et al. (2009) Pratt, G. W., Croston, J. H., Arnaud, M., & Böhringer, H. 2009, A&A, 498, 361
- Rafferty et al. (2006) Rafferty, D. A., McNamara, B. R., Nulsen, P. E. J., & Wise, M. W. 2006, ApJ, 652, 216
- Rawle et al. (2008) Rawle, T. D., Smith, R. J., Lucey, J. R., Hudson, M. J., & Wegner, G. A. 2008, MNRAS, 385, 2097
- Rich et al. (2005) Rich, R. M., et al. 2005, ApJ, 619, L107
- Santos et al. (2008) Santos, J. S., Rosati, P., Tozzi, P., Böhringer, H., Ettori, S., & Bignamini, A. 2008, A&A, 483, 35
- Schlegel et al. (1998) Schlegel, D. J., Finkbeiner, D. P., & Davis, M. 1998, ApJ, 500, 525
- Silk & Rees (1998) Silk, J., & Rees, M. J. 1998, A&A, 331, L1
- Skrutskie et al. (2006) Skrutskie, M. F., et al. 2006, AJ, 131, 1163
- Sparks et al. (2009) Sparks, W. B., Pringle, J. E., Donahue, M., Carswell, R., Voit, M., Cracraft, M., & Martin, R. G. 2009, ApJ, 704, L20
- Spinrad (1975) Spinrad, H. 1975, ApJ, 199, L1+
- Stocke et al. (1991) Stocke, J. T., Morris, S. L., Gioia, I. M., Maccacaro, T., Schild, R., Wolter, A., Fleming, T. A., & Henry, J. P. 1991, ApJS, 76, 813
- Sun (2009) Sun, M. 2009, ApJ, 704, 1586
- Sun et al. (2007) Sun, M., Jones, C., Forman, W., Vikhlinin, A., Donahue, M., & Voit, M. 2007, ApJ, 657, 197
- Tody (1993) Tody, D. 1993, in Astronomical Society of the Pacific Conference Series, Vol. 52, Astronomical Data Analysis Software and Systems II, ed. R. J. Hanisch, R. J. V. Brissenden, & J. Barnes, 173–+
- Vikhlinin et al. (2007) Vikhlinin, A., Burenin, R., Forman, W. R., Jones, C., Hornstrup, A., Murray, S. S., & Quintana, H. 2007, in Heating versus Cooling in Galaxies and Clusters of Galaxies, ed. H. Böhringer, G. W. Pratt, A. Finoguenov, & P. Schuecker, 48–+
- Voit et al. (2008) Voit, G. M., Cavagnolo, K. W., Donahue, M., Rafferty, D. A., McNamara, B. R., & Nulsen, P. E. J. 2008, ApJ, 681, L5
- Voit & Donahue (1990) Voit, G. M., & Donahue, M. 1990, ApJ, 360, L15
- Voit & Donahue (1997) —. 1997, ApJ, 486, 242
- Voit & Donahue (2005) —. 2005, ApJ, 634, 955
- von der Linden et al. (2007) von der Linden, A., Best, P. N., Kauffmann, G., & White, S. D. M. 2007, MNRAS, 379, 867
- Yi (2008) Yi, S. K. 2008, in Astronomical Society of the Pacific Conference Series, Vol. 392, Hot Subdwarf Stars and Related Objects, ed. U. Heber, C. S. Jeffery, & R. Napiwotzki, 3–+
- Yi et al. (2005) Yi, S. K., et al. 2005, ApJ, 619, L111
| Target | Observation ID | Filter | Mode | Exposure Time | Observation Date |
|---|---|---|---|---|---|
| 2MASS ID | (seconds) | (YYYY-MM-DD) | |||
| 00034964+0203594 | 0201900101 | uvm2 | HR | 9900 | 2004 Jun 24 |
| 00055975-3443171 | 0201903801 | uvm2 | HR | 12500 | 2005 May 13 |
| 00204314-2542284 | 0201900301 | uvm2 | HR | 12300 | 2004 May 26 |
| 00492282-2931069 | 0201900401 | uvm2 | HR | 16700 | 2004 Dec 04 |
| 01445891-5301110 | 0201900501 | uvm2 | HR | 15200 | 2004 Nov 12 |
| 02112484-4017261 | 0201900601 | uvm2 | HR | 13300 | 2004 Dec 27 |
| 02250904-2928383 | 0201900701 | uvm2 | HR | 11400 | 2004 Jul 06 |
| 05473773-3152237 | 0201900901 | uvm2 | HR | 10900 | 2004 Mar 07 |
| 06055401-3518081 | 0201901001 | uvm2 | LR | 4960 | 2004 Oct 29 |
| 06165166-4747434 | 0201901101 | uvm2 | HR | 21800 | 2004 Apr 26 |
| 06452948-5413365 | 0201903401 | uvm2 | HR | 8700 | 2004 Jun 12 |
| 08215065+0111495 | 0201901301 | uvm2 | LR | 2840 | 2004 Oct 13 |
| 09582201-1103500 | 0201903501 | uvm2 | HR | 5500 | 2004 Jun 17 |
| 10443287-0704074 | 0201901501 | uvm2 | HR | 9360 | 2004 Dec 24 |
| 11412420-1216386 | 0201901601 | uvm2 | HR | 17200 | 2004 Jul 09 |
| 12364125-3355321 | 0201901701 | uvm2 | LR | 2880 | 2004 Jul 28 |
| 13025254-0230590 | 0201901801 | uvm2 | HR | 9400 | 2004 Jun 22 |
| 15161794+0005203 | 0201902001 | uvm2 | HR | 12700 | 2004 Jul 23 |
| 15164416-0058096 | 0201902101 | uvm2 | LR | 2320 | 2004 Aug 03 |
| 20145171-2430229 | 0201902201 | uvm2 | HR | 9900 | 2004 Oct 08 |
| 20225911-2056561 | 0201902301 | uvm2 | HR | 13400 | 2005 Apr 06 |
| 20481162-1749034 | 0201902401 | uvm2 | LR | 1980 | 2004 May 13 |
| 21490737-3042043 | 0201902601 | uvm2 | HR | 9360 | 2004 Nov 29 |
| 21520957-1943235 | 0201902701 | uvm2 | LR | 2340 | 2004 Oct 28 |
| 21572939-0747443 | 0201902801 | uvm2 | LR | 2340 | 2005 May 11 |
| 22174585-3543293 | 0201902901 | uvm2 | LR | 2340 | 2005 May 12 |
| 22183938-3854018 | 0201903001 | uvm2 | HR | 10700 | 2004 Oct 24 |
| 22342463-3743304 | 0201903101 | uvm2 | LR | 2720 | 2004 Nov 11 |
| 23194046-7313366 | 0201903201 | uvm2 | LR | 2340 | 2004 Apr 18 |
| 00034964+0203594 | 0201900101 | uvw1 | HR | 9900 | 2004 Jun 24 |
| 00055975-3443171 | 0201900201 | uvw1 | HR | 12160 | 2004 Dec 08 |
| 00204314-2542284 | 0201900301 | uvw1 | HR | 12300 | 2004 May 26 |
| 00492282-2931069 | 0201900401 | uvw1 | HR | 16700 | 2004 Dec 04 |
| 01445891-5301110 | 0201900501 | uvw1 | HR | 16200 | 2004 Nov 12 |
| 02112484-4017261 | 0201900601 | uvw1 | HR | 12500 | 2004 Dec 27 |
| 02250904-2928383aaAB magnitude was obtained by taking a weighted average of the two exposures. | 0201900701 | uvw1 | HR | 11400 | 2004 Jul 06 |
| 02250904-2928383aaAB magnitude was obtained by taking a weighted average of the two exposures. | 0302610601 | uvw1 | HR | 9700 | 2006 Jan 27 |
| 05473773-3152237 | 0201900901 | uvw1 | HR | 10900 | 2004 Mar 07 |
| 06055401-3518081 | 0201901001 | uvw1 | HR | 11800 | 2004 Oct 29 |
| 06165166-4747434 | 0201901101 | uvw1 | HR | 16900 | 2004 Apr 26 |
| 08215065+0111495 | 0201901301 | uvw1 | LR | 2240 | 2004 Dec 13 |
| 09582201-1103500 | 0201903501 | uvw1 | LR | 820 | 2004 Jun 17 |
| 10443287-0704074 | 0201901501 | uvw1 | HR | 12400 | 2004 Dec 23 |
| 11412420-1216386 | 0201901601 | uvw1 | HR | 13760 | 2004 Jul 09 |
| 12364125-3355321 | 0201903701 | uvw1 | LR | 1220 | 2004 Dec 30 |
| 13025254-0230590 | 0201901801 | uvw1 | HR | 1880 | 2004 Jun 22 |
| 13112952-0120280 | 0093030101 | uvw1 | HR | 6300 | 2001 Dec 24 |
| 15161794+0005203 | 0201902001 | uvw1 | HR | 12200 | 2004 Jul 22 |
| 15164416-0058096 | 0201902101 | uvw1 | LR | 2320 | 2004 Aug 03 |
| 20145171-2430229 | 0201902201 | uvw1 | HR | 9900 | 2004 Oct 08 |
| 20225911-2056561 | 0201902301 | uvw1 | HR | 7740 | 2005 Apr 06 |
| 20481162-1749034 | 0201902401 | uvw1 | LR | 1980 | 2004 May 13 |
| 21294244-5049260 | 0201902501 | uvw1 | LR | 2340 | 2004 Oct 16 |
| 21490737-3042043 | 0201902601 | uvw1 | HR | 11700 | 2004 Nov 29 |
| 21520957-1943235 | 0201902701 | uvw1 | LR | 2340 | 2004 Dec 28 |
| 21572939-0747443 | 0201902801 | uvw1 | LR | 2340 | 2005 May 11 |
| 22174585-3543293 | 0201902901 | uvw1 | HR | 11700 | 2005 May 12 |
| 22183938-3854018 | 0201903001 | uvw1 | HR | 10700 | 2004 Oct 24 |
| 22342463-3743304 | 0018741701 | uvw1 | HR | 5000 | 2001 May 03 |
| 23194046-7313366 | 0201903201 | uvw1 | HR | 11700 | 2004 Apr 18 |
| Cluster | 2MASS IDbbAll of these IDs are from the 2MASS Extended Source Catalog except for 02250904-2928383 and 00492282-2931069, which were compact and round enough in 2MASS observations for the Point Source Catalog. | z | r | UVW1 | UVW1 | UVM2 | UVM2 | R | |
|---|---|---|---|---|---|---|---|---|---|
| mag | Unc | mag | Unc | mag | |||||
| RXCJ0003.8+0203 | 00034964+0203594 | 0.092 | 8.3 | 20.54 | 0.10 | 21.61 | 0.00 | 15.35 | 0.11 |
| RXCJ0006.0-3443 | 00055975-3443171 | 0.115 | 7.0 | 20.64 | 0.06 | 22.13 | 0.35 | 15.80 | 0.061 |
| RXCJ0020.7-2542 | 00204314-2542284 | 0.141 | 5.8 | 21.18 | 0.10 | 22.21 | 0.00 | 16.44 | 0.052 |
| RXCJ0049.4-2931 | 00492286-2931124 | 0.108 | 7.2 | 20.42 | 0.05 | 22.04 | 0.00 | 15.75 | 0.073 |
| RXCJ0145.0-5300 | 01445891-5301110 | 0.117 | 6.8 | 21.53 | 0.09 | 21.93 | 0.00 | 16.48 | 0.104 |
| RXCJ0211.4-4017 | 02112484-4017261 | 0.101 | 7.7 | 20.98 | 0.10 | 21.86 | 0.31 | 15.84 | 0.06 |
| RXCJ0225.1-2928 | 02250904-2928383 | 0.06 | 12.3 | 19.84 | 0.08 | 21.31 | 0.00 | 14.81 | 0.06 |
| RXCJ0345.7-4112 | 03454640-4112149 | 0.06 | 0.0 | 18.63 | 0.06 | 20.2 | 0.3 | 14.05 | 0.046 |
| RXCJ0547.6-3152 | 05473773-3152237 | 0.148 | 5.5 | 21.81 | 0.13 | 22.08 | 0.00 | 16.57 | 0.098 |
| RXCJ0605.8-3518 | 06055401-3518081 | 0.139 | 5.8 | 21.53 | 0.12 | 20.45 | 0.00 | 16.37 | 0.2 |
| RXCJ0616.8-4748 | 06165166-4747434 | 0.116 | 6.8 | 20.68 | 0.06 | 22.23 | 0.00 | 15.53 | 0.169 |
| RXCJ0645.4-5413 | 06452948-5413365 | 0.164 | 5.1 | 20.2 | 0.00 | 22.00 | 0.00 | 16.69 | 0.312 |
| RXCJ0821.8+0112 | 08215065+0111495 | 0.082 | 9.2 | 20.09 | 0.16 | 21.04 | 0.00 | 15.43 | 0.139 |
| RXCJ0958.3-1103 | 09582201-1103500 | 0.167 | 5.0 | 20.94 | 0.00 | 21.64 | 0.00 | 16.90 | 0.214 |
| RXCJ1044.5-0704 | 10443287-0704074 | 0.134 | 6.0 | 21.43 | 0.11 | 21.75 | 0.00 | 16.63 | 0.122 |
| RXCJ1141.4-1216 | 11412420-1216386 | 0.119 | 6.6 | 19.64 | 0.03 | 20.01 | 0.05 | 15.72 | 0.102 |
| RXCJ1236.7-3354 | 12364125-3355321 | 0.08 | 9.5 | 20.77 | 0.33 | 21.07 | 0.00 | 15.25 | 0.251 |
| RXCJ1302.8-0230 | 13025254-0230590 | 0.085 | 9.0 | 19.67 | 0.09 | 20.99 | 0.27 | 15.34 | 0.078 |
| RXCJ1311.4-0120 | 13112952-0120280 | 0.183 | 4.6 | 21.25 | 0.00 | 0.00 | 0.00 | 16.89 | 0.088 |
| RXCJ1516.3+0005 | 15161794+0005203 | 0.118 | 6.7 | 21.67 | 0.15 | 21.98 | 0.00 | 16.18 | 0.183 |
| RXCJ1516.5-0056 | 15164416-0058096 | 0.12 | 6.6 | 21.41 | 0.25 | 21.21 | 0.00 | 16.15 | 0.23 |
| RXCJ2014.8-2430 | 20145171-2430229 | 0.155aaThe X-ray spectra were incompatible with the NED redshift for RXCJ2014.8-2430 of 0.16. Our optical spectroscopy reported in this work indicates a redshift of 0.1555, consistent with the redshift estimated from the X-ray spectrum of 0.1538 from Pratt et al. (2009). | 5.4 | 19.96 | 0.04 | 20.51 | 0.10 | 16.62 | 0.494 |
| RXCJ2023.0-2056 | 20225911-2056561 | 0.056 | 13.1 | 19.89 | 0.13 | 21.07 | 0.00 | 14.48 | 0.192 |
| RXCJ2048.1-1750 | 20481162-1749034 | 0.147 | 5.5 | 21.32 | 0.22 | 20.81 | 0.00 | 16.13 | 0.199 |
| RXCJ2129.8-5048 | 21294244-5049260 | 0.0796 | 9.5 | 20.49 | 0.17 | 0.00 | 0.00 | 15.31 | 0.085 |
| RXCJ2149.1-3041 | 21490737-3042043 | 0.118 | 6.7 | 20.71 | 0.09 | 21.80 | 0.00 | 15.51 | 0.093 |
| RXCJ2152.2-1942 | 21520957-1943235 | 0.096 | 8.0 | 20.10 | 0.10 | 20.32 | 0.00 | 0.107 | |
| RXCJ2157.4-0747 | 21572939-0747443 | 0.058 | 12.7 | 19.56 | 0.13 | 20.48 | 0.00 | 14.64 | 0.129 |
| RXCJ2217.7-3543 | 22174585-3543293 | 0.149 | 5.5 | 21.06 | 0.07 | 21.86 | 0.24 | 16.25 | 0.059 |
| RXCJ2218.6-3853 | 22183938-3854018 | 0.141 | 5.8 | 21.26 | 0.11 | 22.06 | 0.00 | 16.25 | 0.05 |
| RXCJ2234.5-3744 | 22342463-3743304 | 0.151 | 5.4 | 21.77 | 0.16 | 21.34 | 0.00 | 16.68 | 0.057 |
| RXCJ2234.5-3744b | 22342463-3743304 | 0.151 | 5.4 | 20.59 | 0.07 | 22.10 | 0.33 | 0.057 | |
| RXCJ2319.6-7313 | 23194046-7313366 | 0.098 | 7.9 | 20.91 | 0.07 | 21.81 | 0.30 | 16.64 | 0.101 |
Note. — All magnitudes are in the AB system and measured within an aperture of radius kpc, reported in column 4, along with a flat, geometry. The R band magnitudes have a systematic uncertainty of . The magnitudes listed are not corrected for Galactic extinction. No internal extinction is applied. The in the direction of the BCG listed, and we used this to correct the UV and optical colors. All colors in the plots have been corrected for Galactic extinction.
| Matched Aperture (r=14 kpc) | Total Flux | Exposure Time | ||||||||
|---|---|---|---|---|---|---|---|---|---|---|
| Cluster | NUV | NUV | FUV | FUV | NUV | NUV | FUV | FUV | NUV | FUV |
| AB | Unc | AB | Unc | AB | Unc | AB | Unc | (s) | (s) | |
| RXCJ0003.8+0203 | 22.0 | 0.3 | 21.6 | 0.5 | 21.1 | 0.3 | 21.5 | 0.4 | 112 | 342 |
| RXCJ0006.0-3443 | 22.0 | 0.4 | 21.85 | 0.85 | 21.12 | 0.28 | 21.57 | 0.22 | 1608 | 1608 |
| RXCJ0020.7-2542 | 22.7 | 0.4 | 22.1 | 0.4 | 21.7 | 0.4 | 22.4 | 0.4 | 325 | 325 |
| RXCJ0049.4-2931 | 20.93 | 0.16 | 20.22 | 0.13 | 203 | 203 | ||||
| RXCJ0225.1-2928 | 20.75 | 0.20 | 20.04 | 0.23 | 169 | 169 | ||||
| RXCJ0345.7-4112 | 19.85 | 0.14 | 20.50 | 0.27 | 19.40 | 0.15 | 20.5 | 0.3 | 106 | 106 |
| RXCJ0821.8+0112aaThe fluxes for these galaxies are included in the table for completeness, but are highly uncertain, and represent the lowest confidence GALEX detections in the sample. | 21.9 | 0.5 | 20.0 | 0.4 | 173 | 168 | ||||
| RXCJ1141.4-1216 | 19.85 | 0.09 | 20.19 | 0.30 | 19.68 | 0.09 | 19.74 | 0.24 | 186 | 75 |
| RXCJ1302.8-0230 | 20.99 | 0.06 | 21.59 | 0.11 | 20.31 | 0.08 | 21.34 | 0.12 | 1700 | 1700 |
| RXCJ2014.8-2430bbNo FUV data were available for RXCJ2014. | 20.20 | 0.08 | 19.84 | 0.085 | 365 | |||||
| RXCJ2023.0-2056 | 20.9 | 0.3 | 21.0 | 0.4 | 21.1 | 0.3 | 20.7 | 0.3 | 184 | 184 |
| RXCJ2129.8-5048ccThis GALEX source is off-center by , but is within the BCG. | 21.3 | 0.3 | 21 | 0.3 | 207 | 207 | ||||
| RXCJ2157.4-0747 | 20.73 | 0.08 | 22.00 | 0.17 | 20.65 | 0.06 | 21.7 | 0.11 | 2973 | 2973 |
| RXCJ2217.7-3543 | 22.0 | 0.2 | 22.0 | 0.3 | 21. | 0.2 | 21.7 | 0.3 | 404 | 311 |
| RXCJ2218.6-3853aaThe fluxes for these galaxies are included in the table for completeness, but are highly uncertain, and represent the lowest confidence GALEX detections in the sample. | 22.4 | 0.4 | 22.2 | 0.4 | 180 | 180 | ||||
| RXCJ2234.5-3744abddThe BCG for RXCJ2234 is included in a blended GALEX source. Higher resolution OM data show two relatively bright components and a faint component. The bright source is unlikely to be associated with the BCG. | 21.04 | 0.01 | 21.37 | 0.02 | 20.57 | 0.01 | 21.04 | 0.02 | 27789 | 27789 |
| RXCJ2319.6-7313 | 21.7 | 0.5 | 21.3 | 0.4 | 108 | 108 | ||||
Note. — Metric aperture ( kpc) photometry is interpolated to match the apertures reported in Table 2. No GALEX data were available for RXCJ0145, RXCJ0547, RXCJ0605, RXCJ0645, RXCJ1311, RXCJ1516.3, RXCJ2149, or RXCJ2152. The seven remaining undetected BCGs have only upper limits ( in FUV, NUV: RXCJ0211, RXCJ0616, RXCJ0958, RXCJ1044, RXCJ1236, RXCJ1516.5, RXCJ2048.
| Target | Observation | Exposure | St. Star | Position Angles | H EQW |
|---|---|---|---|---|---|
| Date | (seconds) | (degrees E of N) | (Å) | ||
| 00034964+0203594 | 2008 Oct 05 | 1200 | LTT7379 | 75, 165 | |
| 00055975-3443171 | 2008 Nov 02aaThe blue blocking filter GG-495 was used for these observations. | 1500 | LTT377 | 15, 105 | |
| 00204314-2542284 | 2008 Nov 26 | 1500 | LTT1020 | 20, 110 | |
| 00492286-2931124 | 2008 Nov 26 | 1500 | LTT1020 | 0, 90 | |
| 01445891-5301110 | 2008 Nov 26 | 1500 | LTT1020 | 0, 90 | |
| 02112484-4017261 | 2008 Oct 04 | 1500 | LTT377 | 30 | |
| 02250904-2928383 | 2008 Oct 04 | 1200 | LTT377 | 5, 95 | |
| 03454640-4112149 | 2008 Sep 30 | 1200 | LTT9239 | 133, 43 | |
| 05473773-3152237 | 2008 Sep 30 | 1200 | LTT9239 | 111 | |
| 06055401-3518081 | 2008 Oct 04 | 1200 | LTT377 | 110,200 | |
| 06165166-4747434 | 2008 Nov 02aaThe blue blocking filter GG-495 was used for these observations. | 1500 | LTT377 | 0 | |
| 06452948-5413365 | 2008 Nov 02aaThe blue blocking filter GG-495 was used for these observations. | 1500 | LTT377 | 65, 155 | |
| 08215065+0111495 | 2008 Nov 26 | 1500 | LTT1020 | 75 | |
| 09582201-1103500 | 2009 Apr 17aaThe blue blocking filter GG-495 was used for these observations. | 1500 | LTT3864 | 65, 155 | |
| 10443287-0704074 | 2009 Apr 17aaThe blue blocking filter GG-495 was used for these observations. | 1500 | LTT3864 | 85, 175 | |
| 11412420-1216386 | 2009 Apr 17aaThe blue blocking filter GG-495 was used for these observations. | 1500 | LTT3864 | 70, 160 | |
| 12364125-3355321 | 2009 Apr 27aaThe blue blocking filter GG-495 was used for these observations. | LTT3864 | 50 | ||
| 13025254-0230590 | 2009 Apr 27aaThe blue blocking filter GG-495 was used for these observations. | LTT3864 | 85, 175 | ||
| 13112952-0120280 | bbBased on a H luminosity upper limit of erg s-1 for the BCG in Abell 1689, based on Las Campanas Modular Spectrograph, in June 1993. See Table 6. | ||||
| 15161794+0005203 | 2009 Apr 17aaThe blue blocking filter GG-495 was used for these observations. | 1500 | LTT3864 | 45, 135 | |
| 15164416-005809 | 2009 Apr 27aaThe blue blocking filter GG-495 was used for these observations. | 1500 | LTT3864 | 50, 140 | |
| 20145171-2430229 | 2009 Sep 30 | 900 | LTT9239 | 40, 130 | |
| 20225911-2056561 | 2008 Oct 04 | 1200 | LTT377 | 20, 110 | |
| 20481162-1749034 | 2008 Nov 02aaThe blue blocking filter GG-495 was used for these observations. | 1500 | LTT377 | 0, 90 | |
| 21294244-5049260 | 2008 Oct 05 | 1200 | LTT7379 | 14, 104 | |
| 21490737-3042043 | 2008 Oct 04 | 1200 | LTT9239 | 20,110 | |
| 21520957-1943235 | 2008 Sep 30 | 900 | LTT9239 | 9, 99 | |
| 21572939-0747443 | 2008 Nov 26 | 1500 | LTT1020 | 170, 260 | ccSpectroscopic fringing severely limited the sensitivity of this observation. |
| 22174585-3543293 | 2008 Sep 30 | 1200 | LTT9239 | 78, 168 | |
| 22183938-3854018 | 2008 Sep 30 | 900 | LTT9239 | 62, 152 | |
| 22342463-3743304 | 2008 Oct 05 | 1200 | LTT7379 | 85, 355 | |
| 23194046-7313366 | 2008 Nov 02aaThe blue blocking filter GG-495 was used for these observations. | 1500 | LTT377 | 85 |
Note. — An Exposure Time of “” indicates 3 images of length 500 seconds were taken at each position angle.
| BCG | z | EQW (H) | NII6584/H | FWHM | No. Lines | SFR (H) | SFR (UV) | |
|---|---|---|---|---|---|---|---|---|
| (Å) | (km s-1) | (No. spectra) | erg s-1 | M⊙ yr-1 | M⊙ yr-1 | |||
| RXCJ0345.7-4112 | 5 (2) | 5.3 | 0.4 | 0.24-1.0 | ||||
| RXCJ1044.5-0704 | 3 (2) | 5.4 | 0.4 | 0.1-0.4 | ||||
| RXCJ1141.4-1216 | 6 (2) | 35 | 2.8 | 2-4 | ||||
| RXCJ1302.8-0230 | 5 (2) | 2.5 | 0.2 | 0.5-1.2 | ||||
| RXCJ2014.8-2430 | **In this case, the [NII]6583 line was attenuated by an atmospheric absorption line, so the [NII]6583/H ratio for RXCJ2014 is based on the measurement of the [NII]6548 line flux, which is 1/3 [NII]6583 from atomic physics. | 6 (2) | 64 | 5.0 | 8-14 | |||
| RXCJ2149.1-3041 | 5 (2) | 2.0 | 0.16 | 0 | ||||
| RXCJ2319.6-7313 | 5 (1) | 1.6 | 0.13 | 0.3-0.6 |
Note. — Equivalent width and FWHM are reported for the H line in the observer frame. Column 6 lists the number of emission lines detected, and the number in parenthesis reports the number of distinct spectra (different position angles) used. If two spectra were available, we averaged the emission line properties. Column 7 is an estimate of the H luminosity, based on the maximum emission line flux in the slit, corrected for Galactic extinction. This estimate is a lower limit, since the emission line flux is usually more extended than the slit width and no correction is applied for intrinsic absorption. Column 8 is the star formation rate based on this luminosity (Kennicutt, 1998). Column 9 is the star formation rate based on an estimate of the UV excess, uncorrected for intrinsic absorption, with a baseline color of UVW1-R ranging between 4.7-5 and for starbursts ranging in ages from to years (the former giving the highest rates) (Kennicutt, 1998; Hirashita et al., 2003).
| Target | Observation | Exposure | Position Angles | H EQW |
|---|---|---|---|---|
| Date | (seconds) | (degrees E of N) | (Å) | |
| Abell 1650 | 1993 Jun 23 | 900, 1800 | 90, 0 | |
| Abell 1689 | 1993 Jun 23 | 1200, 900 | 90, 18 | |
| Abell 3571 | 1992 Apr 11/12 | 90,0 | ||
| TriAus | 1992 Apr 11/12 | 90 | ||
| Abell 4038aaAlso known as Klemola 44. | 1992 Dec 17 | 117, 27 |