Isotope effect on electron paramagnetic resonance of boron acceptors in silicon
Abstract
The fourfold degeneracy of the boron acceptor ground state in silicon, which is easily lifted by any symmetry breaking perturbation, allows for a strong inhomogeneous broadening of the boron-related electron paramagnetic resonance (EPR) lines, e.g. by a random distribution of local strains. However, since EPR of boron acceptors in externally unstrained silicon was reported for the first time, neither the line shape nor the magnitude of the residual broadening observed in samples with high crystalline purity were compatible with the low concentrations of carbon and oxygen point defects, being the predominant source of random local strain. Adapting a theoretical model which has been applied to understand the acceptor ground state splitting in the absence of a magnetic field as an effect due to the presence of different silicon isotopes, we show that local fluctuations of the valence band edge due to different isotopic configurations in the vicinity of the boron acceptors can quantitatively account for all inhomogeneous broadening effects in high purity Si with a natural isotope composition. Our calculations show that such an isotopic perturbation also leads to a shift in the g-value of different boron-related resonances, which we could verify in our experiments. Further, our results provide an independent test and verification of the valence band offsets between the different Si isotopes determined in previous works.
I Introduction
Electron paramagnetic resonance (EPR) and related techniques like electron nuclear double resonance have contributed extensively to the understanding of substitutional shallow donors in the different allotropes of silicon throughout the last 50 years. Feher (1959); Feher and Gere (1959); Wilson and Feher (1961); Stutzmann et al. (1987); Müller et al. (1999); Huebl et al. (2006); Pereira et al. (2009) On the contrary, EPR had been ineffective for the study of shallow acceptors for a long time. The reason behind this asymmetry lies in the different structure of the respective dopant ground states. While the electronic ground state of substitutional shallow donors in silicon is -like and only twofold spin degenerate, shallow acceptors states have -character and show a fourfold degeneracy. Kohn (1957) This latter degeneracy can partially be lifted by any symmetry breaking perturbation. Such perturbations, e.g. electric fields or strain, can strongly alter or even dominate the level scheme of acceptor Zeeman energies for external magnetic fields that are typically used for EPR measurements. If the perturbation is not homogeneous across the sample, this can easily lead to an extreme inhomogeneous broadening of the EPR resonances. Therefore, the observation of a boron-related EPR signal had initially only been possible under application of a strong and homogeneous external stress. Feher et al. (1960)
It was only in 1978, when Si became available with sufficient crystalline quality, that EPR of B acceptors in externally unstrained Si (Si:B) was reported for the first time by Neubrand. Neubrand (1978a, b) In particular, a correlation between the linewidths of the different boron-related EPR resonances and the concentrations of C and O point defects was established. However, a number of fundamental questions have remained unsolved: (i) Although a random strain distribution that is induced by point defects should lead to a purely Lorentzian broadening of the EPR resonances, the experimentally obtained lines could only be fitted with Voigt profiles, taking into account a significant Gaussian contribution that was found to be independent of the concentrations of C and O. The origin of this additional broadening, which dominates the overall linewidths in samples with small point defect concentrations and which shows a large angular dependence, has essentially remained unclear. (ii) For the samples of highest crystalline purity, the Lorentzian contribution to the Voigt profiles did not fall below a threshold value of 10 mT which, in the model developed by Neubrand, would correspond to an unreasonably high concentration of point defects. In Ref. Neubrand, 1978b, Si interstitials were suggested as a possible explanation for this finding. (iii) For two of the six B-related resonances, a distinct substructure was observed. It was proposed that this structure originates from a dynamic effect, however, the specific mechanism remained unknown. Neubrand (1978a); Köpf and Lassmann (1992)
Karaiskaij and coworkers proposed in Ref. Karaiskaj et al., 2002 that the random distribution of the different stable Si isotopes 28Si, 29Si, and 30Si in Si crystals with a natural isotope composition plays an important role for the inhomogeneous broadening of B-related EPR resonances. In that work, it was shown that the valence band offsets between isotopically pure Si crystals consisting of different isotopes, which lead to local fluctuations of the valence band edge in the vicinity of the different B acceptors in natSi, are responsible for the residual ground state splitting of shallow acceptors in this material, which is e.g. observed in photoluminescence spectra of acceptor-bound excitons. Karaiskaj et al. (2002, 2003) However, it has remained unclear which of the open questions listed above can be attributed to local valence band fluctuations and whether a quantitative understanding of the observed effects is possible. In the present paper, we extend the theoretical model established in Ref. Karaiskaj et al., 2003 to explain the acceptor ground state splitting in the absence of an external magnetic field (=0) to non-zero magnetic fields and investigate the influence of isotope-induced perturbations on the line shape of B-related EPR resonances in Si with the natural and with isotopically engineered isotope compositions. We show that the inhomogeneous broadening effects described in (i) and (ii) can quantitatively be explained by isotope-induced random local fluctuations of the valence band edge in the vicinity of the B acceptors. We verify this finding experimentally via a direct comparison of EPR spectra obtained from B-doped natSi and isotopically purified B-doped 28Si. The isotope-induced broadening is discussed for different orientations of the magnetic field and different isotope compositions. Additionally, the asymmetric line shape of the B-related EPR resonances observed in natSi, which was not addressed in previous work can quantitatively be explained using our model. We show that the random distribution of the different Si isotopes in natSi also shifts the effective g-values of different boron-related EPR resonances with respect to pure 28Si. This effect is quantitatively verified by our experimental data. The crucial parameters for the agreement between this model and the experimental data are the valence band offsets between pure 28Si, 29Si, and 30Si, which were extracted from calculations of the temperature dependence of electronic band states. Cardona and Gopalan (1989); Karaiskaj et al. (2003) Using our model to recalculate the residual acceptor ground state splitting for =0, we show that the 30 % discrepancy between theory and the experimental value determined by phonon absorption spectroscopy in Ref. Karaiskaj et al., 2003 is not due to an uncertainty in the values assumed for the valence band offsets, but rather due to an inaccuracy of the acceptor wave function used in that publication. In our calculations, the best agreement with the experimental data is obtained when the assumed valence band offset between 28Si and 29Si is reduced by 8 % from the value determined in Refs. Karaiskaj et al., 2003; Cardona and Gopalan, 1989.
II Theoretical model
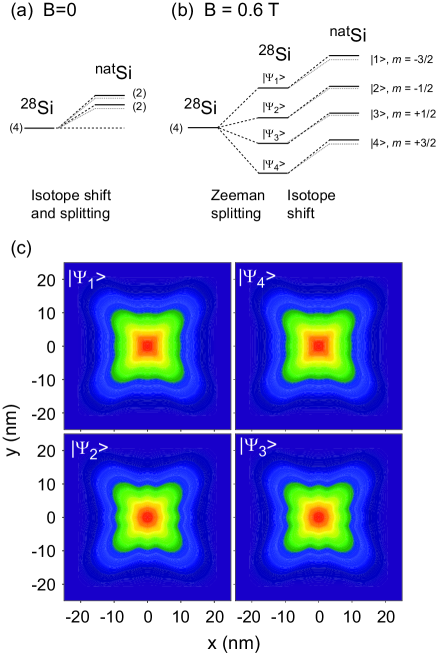
Boron acceptors in Si are conventionally described in the hydrogenic impurity model, where a hole is bound by the electrostatic potential of the singly charged B-ion which is screened by the dielectric constant of Si. Kohn (1957) The ground state envelope function of the hole is the 1 state of a hydrogen-like atom. As shown in Fig. 1(a) for B in pure 28Si, this ground state is fourfold degenerate at =0 due to the spin and Bloch basis angular momentum. Kohn (1957) This degeneracy is partially lifted in natSi due to the action of isotope-induced local fluctuations of the valence band edge in the spatial vicinity of the different B acceptor nuclei which constitute a symmetry breaking perturbation for the acceptor wave function. These fluctuations result from the dependence of the zero-point vibrational energy on the isotope mass in conjunction with the renormalization of the electronic states by electron-phonon interaction. Karaiskaj et al. (2003) In the ensemble average, the resulting two Kramers degenerate levels are shifted by an energy that equals the shift of the valence band edge from 28Si to natSi. However, for different B acceptors, the shift of the different energy levels will undergo slight variations depending on the specific distribution of Si isotopes in the vicinity of the acceptor nucleus.
When a strong external magnetic field is applied, the situation is different, as shown in Fig. 1(b). Already the Zeeman interaction between the acceptor-bound holes and the external magnetic field leads to a full lifting of the degeneracy of the heavy and light hole states and the energy eigenstates can approximately be classified in the total angular momentum basis =3/2, where and are the angular momentum and the magnetic quantum number, respectively. For strong enough external magnetic fields, the isotope-induced effects can then be treated as a small perturbation. As schematically shown in Fig. 1(b), on average this perturbation should lead to an upwards shift of the four Zeeman levels in energy similar to the situation shown in Fig. 1(a) for =0. The assumption that this picture holds for X-band EPR conditions is motivated by the experimental evidence that the measured electronic g-values of B in natSi are predominantly determined by the Zeeman interaction in samples with a low concentration of point defects. Neubrand (1978a) The isotopic disorder therefore only leads to a comparatively small perturbation that mostly manifests itself in a change of the linewidths and lineshapes of the different boron-related EPR resonances.
To assess the nature and the magnitude of these isotope-induced changes, we implement our theoretical model in the following way: First, we calculate the four Zeeman levels of the acceptor ground state using a envelope function model taking into account all six (23) spin-resolved valence bands including the split-off band. The Hamiltonian of the acceptor-bound hole can schematically be written in the form
| (1) |
which was solved on a real-space grid using the NextNano++ code. Birner et al. (2007) The first term on the right hand side represents the six-band effective mass Hamiltonian in a discrete real-space basis including the magnetic field in a non-perturbative and gauge-invariant manner, with only appearing in phase factors. The second term, where is the Bohr magneton, is the free electron g-value and the spin matrices = are determined by the Pauli matrices , couples the spin to the magnetic field. The impurity nucleus is represented by a negative charge at the center of the simulation domain screened by the bulk silicon dielectric constant of =11.7. The potential energy of the acceptor hole is given by
| (2) |
where we have included the so-called central cell correction . It phenomenologically corrects for deviations of from a purely hydrogenic potential close to the impurity nucleus due to changes in the dielectric properties in this spatial region. Pantelides and Sah (1974) To account for , we adopt the parametrization
| (3) |
used in Ref. Belyakov and Burdov, 2007, where the parameters =0.755/, =0.35/, =2.45/, and =1.14 are phenomenological fitting parameters and is the Bohr radius of the effective mass acceptor. Belyakov and Burdov (2007) In order to avoid a singularity of at =0, the Coulomb potential is replaced by for the central grid node following Ref. Belyakov and Burdov, 2007. The only free parameter in our model, , has been chosen to reproduce the correct mixing of the different valence band states in , which is responsible for the inhomogeneous energy splitting between the Zeeman levels in the absence of any further perturbations. A direct experimental measure for this mixing is the difference between the transition energies of the transitions and . This energy difference can directly be calculated from the difference in the resonance fields of the broad and the narrow =1 EPR lines observed in 28Si. We have fitted to reproduce the experimentally observed splitting of 49 mT for [001] (cf. Fig. 3(b), Sec. IV). For all further calculations, has been fixed to this value. In order to account for the long range character of as well as the strong confinement at the acceptor nucleus, we use a simulation domain size of 505050 nm3 and an inhomogeneous grid with a strong concentration of nodes close to the acceptor position, respectively. The wave functions were forced to zero at the boundaries of the simulation domain. With this model, we have calculated the four ground state Zeeman levels labeled by , , , and (corresponding to =, =, =, and =, respectively), as shown in Fig. 1(b), for external magnetic fields with different field strengths and orientations relative to the crystallographic axes. In Fig. 1(c), we exemplarily show typical wave functions obtained by these calculations for =0.6 T with =[001] as two-dimensional cross sections through the different Zeeman states at =0 and the B nucleus located at the origin. The band warping of the different valence bands is reflected in the structure of the envelope functions. While the two heavy hole- and light hole-like states are very similar to each other, between them there are distinct differences. From this it already becomes clear that the zeroth order effect of any perturbation will be an energy shift of the inner two light hole-like states and with respect to the outer two heavy hole-like states and as schematically indicated in Fig. 1(b).
Based on the calculated wave functions, the isotope-induced changes of the band edges are considered perturbatively. For this, we map the wave functions on a discrete atomistic silicon lattice. The values of the acceptor envelope functions at the position of the -th silicon site are evaluated by linear interpolation. For a silicon lattice that comprises 424242 unit cells, corresponding to the size of the simulation domain, we first choose random configurations of 28Si, 29Si, and 30Si isotopes, which on average corresponds to the isotope composition intended for the different calculations, e.g. 92.23 % 28Si, 4.67 % 29Si, and 3.1 % 30Si for natural Si. Following Ref. Karaiskaj et al., 2003, we introduce the isotopic perturbation potential
| (4) |
The valence band offsets =0.74 meV and =1.46 meV are taken relative to the 28Si valence band edge and were deduced from calculations of the temperature dependence of the electronic band states in Si. Karaiskaj et al. (2003); Cardona and Gopalan (1989) Next, we project the diagonal perturbation potential into the subspace spanned by the four Zeeman states , leading to a 44 perturbation Hamiltonian with the matrix elements
| (5) |
Finally, we diagonalize the total Hamiltonian including the diagonal Zeeman term , with being the energy of the -th Zeeman level determined from the model described above. The isotopic contribution leads to a mixing of the four Zeeman levels and to an upward shift of the states, as depicted in Fig. 1(b). The relative alignment of the four resulting states , , , and (cf. Fig. 1(b)) strongly depends on the specific isotopic configuration in the vicinity of the acceptor nucleus. We have therefore performed the calculation of the isotope shifts as described above for 200,000 different random isotope configurations, taking into account different magnetic fields, isotope compositions, and isotopic perturbation potentials. The resulting statistical distributions of EPR transition energies allow the quantitative comparison with the experimental data presented below.
III Experimental details
The natSi:B sample studied has a B doping concentration of 1014 cm-3, was grown using the float-zone technique, has a rectangular shape and a size of approximately mm3. The isotopically purified sample, referred to as 28Si:B in the text, comes from the neck region of a float-zone crystal and has an enrichment of 99.98 % 28Si. It is doped with boron to a concentration of 31014 cm-3, has a cylindrical shape with a length of 10 mm in [100] direction and a diameter of 3 mm.
EPR measurements were performed with a Bruker Elexsys E 500 spectrometer in conjunction with a super-high- resonator (ER-4122SHQE) operated at an X-band microwave frequency of 9.4 GHz. During the measurement, the samples were cooled to temperatures of typically 3 K using an Oxford ESR 900 helium-flow cryostat.
IV Results and Discussion
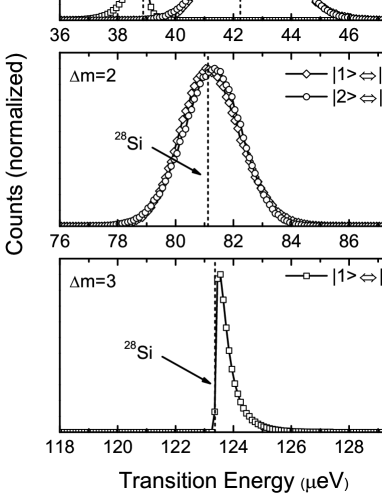
In Fig. 2 the statistical distributions that result from the calculations described above are shown for the six different EPR transitions in natSi for . We find that the distribution of the inner =1 transition () and the =3 transition () are relatively sharp, while the outer =1 ( and ) and the =2 ( and ) transitions show a full width at half maximum (FWHM) of approximately 10 % and 5 % of their mean value, respectively. This can be understood from the fact that the two former transitions occur between two states that are dominantly light holes or heavy holes, respectively, and experience a similar shift due to the isotopic perturbation. These transitions are therefore called intrasubband transitions. In contrast, the latter intersubband transitions comprise both light hole-like and heavy hole-like states that are differently perturbed by the random isotopic distribution. The asymmetric broadening of the and the transitions results from the mixing of the four unperturbed eigenstates that is obtained by the diagonalization of the total Hamiltonian . As can be seen, the statistical distribution of the two outer =1 transitions and the =2 transitions are also slightly asymmetric and do not exactly overlap with each other. For low temperatures, when spin polarization becomes significant and the equilibrium populations of the four Zeeman states strongly deviate from each other, this result should be reflected in an increasing asymmetry of the EPR lineshape. The dashed lines in Fig. 2 show the transition energies for pure 28Si, i.e. the transition energies between the unperturbed eigenstates obtained from our calculations. For the maxima of the distributions calculated for natSi, we observe a shift in energy with respect to the unperturbed case, which is significant for the outer =1 and the =2 transitions. The maxima of the and distributions are shifted to higher energies by 0.315 eV and 0.378 eV with respect to 28Si, respectively. For the and =2 transitions, we find shifts of 0.057eV and 0.151eV, respectively. These shifts manifest themselves in (temperature dependent) differences between the effective g-values of 28Si and natSi, which will be discussed further below.
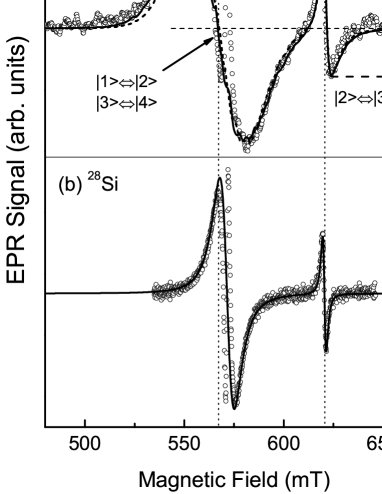
In order to see to which extent the properties of boron EPR spectra that have not been understood so far can be explained by the calculated distributions of the transition energies, we directly compare our results with experimental data. The open circles in Fig. 3(a) show a typical EPR spectrum of the =1 transitions measured on a natSi sample at . The spectrum shows a broad structured line at =567.2 mT, which is attributed to a superposition of the resonances originating from the and the transitions. Neubrand (1978a) Further, we observe a narrower asymmetric resonance at =621.1 mT, which can be assigned to the transition. Neubrand (1978a) The origin of the narrow substructure feature centered at =570.2 mT and discussed under (iii) in Sec. I is the result of an interplay between spin excitations and spin relaxations in the four level spin system and is the subject of a different publication. Tezuka et al. (2010) In Fig. 4(a), the open circles show the EPR spectrum measured on the same natSi sample in a magnetic field range where the =2 resonances are expected. The broad peak observed at =297.5 mT can be assigned to a superposition of the and resonances. Neubrand (1978a) Here, the narrow substructure line has the opposite sign as compared to the substructure of the broad =1 peak. The additional signal in the range from =314 mT to =324 mT is not related to boron but is due to a background signal of our natSi sample which is of unknown origin.
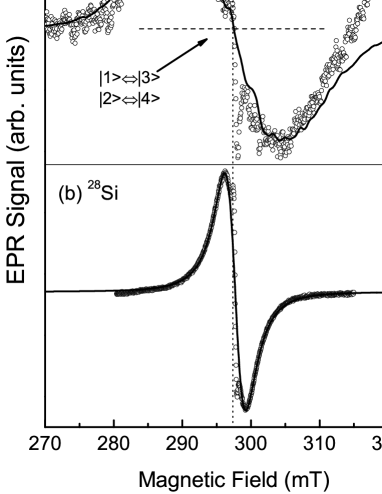
The curves (b) in Figs. 3 and 4 show the corresponding spectra that were measured on the 28Si sample. We observe the same features as in the spectra of the natSi sample, however, the linewidths and the line shapes of all resonances are strongly changed. The solid lines in Figs. 3(b) and 4(b) show computer simulations of the spectra using single Lorentzian lines for each resonance peak, neglecting the narrow substructures. The best fit which leads to a very good agreement with the experimental data, is obtained for peak-to-peak linewidths of 7.2 mT and 1.7 mT for the low-field and the high-field =1 resonances, respectively. For the =2 resonance, a linewidth of 3.1 mT is obtained. In spite of the Lorentzian line shapes, we conclude from the temperature dependence of the linewidths (not shown) that the , resonance and the =2 resonance shown are inhomogeneously broadened, since the linewidths of these two resonances become almost temperature independent below 3 K. We attribute this broadening to a distribution of the transition energies between the different energy levels induced by random local strains due to C, O, and B point defects. Neubrand (1978b); Bir et al. (1963) A quantitative estimation of the point defect concentration is given later in the text. For the narrow =1 resonance at higher magnetic fields, belonging to the transition, the strain induced broadening is only a second order perturbation. For this resonance, the linewidth continues to decrease for temperatures down to 0.3 K and at the temperature investigated here (3 K), the linewidth of this resonance is therefore a good estimate for the natural linewidth.
Therefore, we use the line shape of the resonance in 28Si for a convolution with the statistical distribution of spin packets shown in Fig. 2 in order to obtain simulated line shapes for natSi that can be compared to the experimental spectra of the =1 and =2 resonances in Fig. 3(a) and Fig. 4(a), respectively. To make a direct comparison of the line shapes easier, the calculated spectra have been shifted rigidly on the magnetic field axis so that they overlap with the experimental data. This shift corrects for the inaccuracy of the absolute g-values obtained from our calculations. However, we only performed a rigid shift of the entire spectrum by a constant field and the splitting of the =1 resonances has not been changed. As our model does not yield EPR transition probabilities, the amplitudes of the simulated peaks have manually been adjusted to the measured values. Neglecting the substructure of the broad transitions caused by dynamic effects, Tezuka et al. (2010) the calculated signals (black solid curves) show a striking agreement with the experimental spectra, which demonstrates that all inhomogeneous broadening effects in our natSi sample can be explained by isotope-induced fluctuations of the valence band edge alone. The apparent noise in the simulated spectra is the result of the still somewhat limited number of random isotope distributions used for the simulation. As indicated by the dotted vertical lines, also the shifts in the effective g-values between 28Si and natSi that have been predicted as shifts in the transition energies in Fig. 2, are found experimentally. For the broad =1 resonance in Fig. 3, we observe a shift of 4.2 mT which translates into a shift in transition energy of 0.3 eV at =0.6 T and is in good agreement with the theoretical values. For the narrow =1 resonance, we do not see a change in transition energy within the resolution of our measurement, as expected from our calculations. The =2 resonance shows a smaller shift of 0.5 mT corresponding to a change in transition energy of 0.1 eV at =0.6 T. We note that the resonance fields of the substructures, both for the =1 and =2 transitions, are not shifted due to the isotopic perturbation, which means that the substructure lines are not located exactly at the maximum of the broader absorption lines but are slightly shifted to higher fields in natSi.
We note that the narrow substructures on the broad =1 resonance showing a negative sign and the =2 resonance showing a positive sign for the temperature investigated here, do not originate from a superposition of two absorption peaks which are shifted with respect to each other on the magnetic field axis. Such a splitting of resonance lines could in principle result from slightly different g-values of the two boron isotopes 10B and 11B, which have a slightly different binding energy (1.910-2 meV higher for 10B). Cardona and Thewalt (2005) However, due to their natural abundance of 19.9 % and 80.1 %, respectively, such an effect has to lead to an asymmetric resonance line, which contradicts the highly symmetric line shape of the B-related resonances observed in 28Si, and can therefore be excluded. Another effect that in principle has to be considered for the understanding of the line shape is the hyperfine interaction of the acceptor holes with the nuclear spins of the corresponding acceptor nuclei and 29Si ligands. For 10B and 11B, the nuclear spin is 3 and 3/2, respectively. If the acceptor hyperfine splitting could be resolved in our spectra, we would therefore expect a multiplet of lines rather than a twofold splitting of the resonance line that might be invoked to account for the central substructures. We neither observe a resolved hyperfine signature in any of our spectra nor do we need a further source of inhomogeneous broadening for the description of our spectra that could be attributed to unresolved B hyperfine multiplets or a strong superhyperfine interaction with 29Si ligands. We conclude that the hyperfine coupling strength of B acceptors to their nuclei is much smaller than for the case of shallow donors in Si. This is a result of the -character of valence band Bloch states, which cancels the strong Fermi contact hyperfine term at the position of the dopant atom due to a vanishing probability amplitude of the acceptor hole at its nucleus. For heavy hole states in III-V semiconductor quantum dots, it has recently been pointed out that the anisotropic dipolar hyperfine coupling strength can amount to up to 10 % of the Fermi contact term of electrons. Fischer et al. (2008) However, it is not necessary to take into account an additional dipolar hyperfine or superhyperfine term for the description of our data.
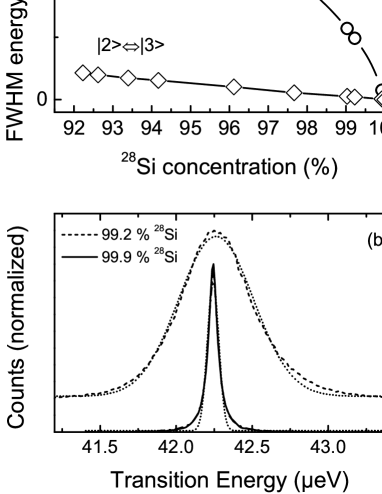
In Fig. 5(a), the FWHM of the sum of the transition energy distributions of the outer =1 transitions ( and ) (circles), and the distribution of the transition energies (diamonds) are shown as a function of the degree of isotopic purification. As an approximation, the ratio between the residual 29Si and 30Si concentrations was kept constant at the natSi value. For both resonances, we observe a monotonous decrease of the isotope-induced broadening when the 28Si concentration is increased. In Fig. 5(b), the line shape of the distributions of the outer =1 transition energies are exemplarily shown for 99.2 % (dashed line) and 99.9 % (solid line) 28Si. Both distributions are shown together with numerical fits assuming Gaussian lineshapes (dotted lines). For the 99.9 % 28Si distribution, a Lorentzian fit leads to a curve which cannot be distinguished from the actual distribution (solid line). Comparing the calculated distributions with the fits, it can be seen that the line shape of the distributions changes from Gaussian-like to Lorentzian in the regime of high isotopic purity with 99 % 28Si. This complicates the discrimination between isotope-induced and strain-induced broadening in the high 28Si concentration range, where both types of inhomogeneous broadening are Lorentzian. For 99.98 % 28Si, the expected FWHM due to isotope effects for the transition and for the sum of the and distributions has decreased to 0.002 eV and 0.02 eV, respectively. For the spectrum shown in Fig. 3(b), this means that the isotope-related inhomogeneous contributions to the observed linewidths are only 0.24 mT for the low-field resonance and 0.024 mT for the high-field line. These values fall more than one order of magnitude below the experimentally observed linewidths. The linewidth of the broad =1 resonance in the spectra of our 28Si sample should therefore only be determined by spin relaxation and the concentration of point defects inducing random strain fields. Under this assumption, we can directly use Eq. 6 in Ref. Neubrand, 1978b to estimate the total concentration of C and O point defects from the peak-to-peak linewidth at low temperatures. We find a value of 31016 cm-3, which is consistent with the 11016 cm-3 concentration of C impurities measured by infrared absorption spectroscopy on the 607 cm-1 C local vibrational mode. Sennikov et al. (2005) A further reduction of the total point defect concentration to 11015 cm-3 would be necessary to observe an isotope induced broadening in the 28Si sample investigated.
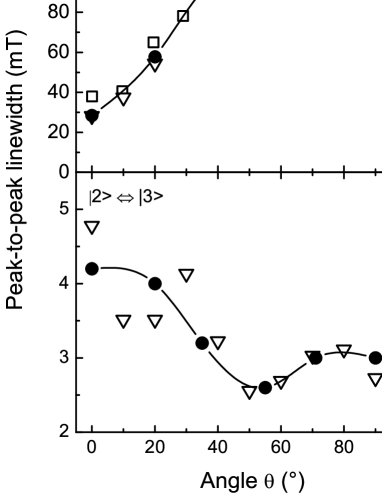
To obtain a more general picture, we have further investigated the anisotropy of the isotope-induced broadening effects. We have calculated the broadening of the =1 EPR lines for different directions of the magnetic field ranging from [001] (=0∘) to [110] (=90∘). In Fig. 6(a), the peak-to-peak linewidth of the broad =1 resonance ( and ) calculated for natSi using =0.74 meV and =1.46 meV is shown as a function of the angle (solid cirlces). We observe a strongly anisotropic behavior with a minimum of the linewidth at [001] and a maximum at [111]. A comparison with experimental data from Ref. Neubrand, 1978b (open squares) and those obtained in this work (open triangles) shows a very good agreement with our theoretical calculations. The experimental uncertainty should be the smallest for small values of where narrow lines with a large amplitude are observed. Regarding this, the experimental data from Ref. Neubrand, 1978b show a comparatively large deviation from our theoretical result for =0∘ and =20∘. These larger linewidths can however be understood from a higher concentration of C and O point defects in the sample measured by Neubrand, which imposes a lower limit to the experimentally observed linewidth via an additional inhomogeneous broadening induced by random local strain.
In Fig. 6(b), the theoretical and experimental data obtained for the resonance are shown. Compared to Fig. 6(a), the anisotropy is inverted. We find a maximum of the linewidth for [001] and a minimum for [111]. Again, the experimentally observed linewidth anisotropy for natSi is very nicely reproduced by our theoretical model. The origin of the relatively large scatter of the experimental data points for 30∘ is the asymmetry of the resonance shown in Fig. 3(a). For [001], the positive amplitude (with respect to the zero crossing) on the low-field side of the derivative line is smaller than the negative amplitude . This asymmetry of the line shape, which results from the mixing of the Zeeman states due to the isotopic perturbation, also leads to a relatively weak and broad negative peak on the high field side, which, for a given noise level, increases the experimental error for the determination of the overall linewidth. In Fig. 6(b), we find the best agreement between theory and experiment around [111], where we observe the smallest linewidths.
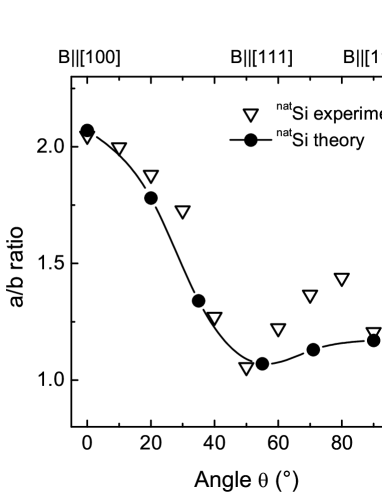
As shown in Fig. 7, also the asymmetry of the resonance line shape has a minimum at this orientation. Triangles show the experimental data, full circles represent the asymmetry that is deduced from the simulated line shapes. With the exception of two data points around =70∘, the angular dependence of the line shape anisotropy can also quantitatively be understood from our theoretical model. As mentioned above, the asymmetric broadening of the resonance originates from a mixing of the unperturbed Zeeman states via the off-diagonal matrix elements of the isotopic perturbation Hamiltonian . The difference between the experimental and the theoretical values of the asymmetry factor in the region of =70∘ could be a result of a slight anisotropy of the linewidth of the single spin packets contributing to the inhomogeneously broadened line, which has not been taken into account for the simulation. The scatter around =1 in Fig. 7 lies within the experimental error bars resulting from the different spectral overlap of the resonance lines for different orientations of the magnetic field.
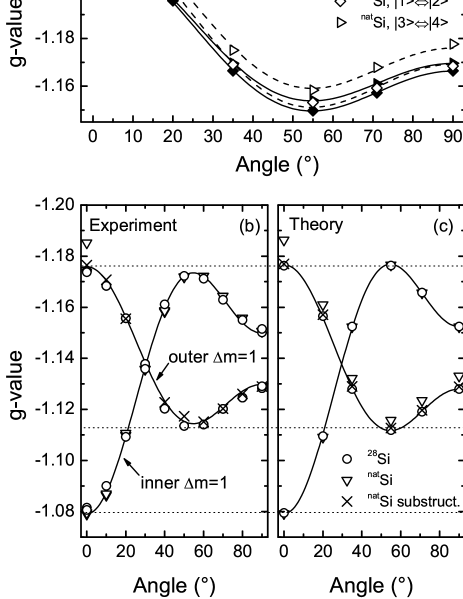
The calculated distributions of energy splittings in Fig. 2 and the experimental EPR spectra in Figs. 3 and Fig. 4 revealed that the maxima of the distributions of transition energies in natSi are shifted with respect to the corresponding transition energies observed for 28Si. In Fig. 8(a), we show how this effect depends on the orientation of the magnetic field for the outer =1 transitions. The effective g-values calculated from the theoretical and transition energies in pure 28Si are shown as full diamonds and triangles, respectively. The open symbols indicate the corresponding effective g-values for natSi calculated from the maxima of the transition energy distributions. According to Ref. Bir et al., 1963, we assume the g-values of B in Si to be negative. As guides to the eye, we also show numerical fits to the data based on the theoretical anisotropy given by Eq. 5 in Ref. Neubrand, 1978a as solid and dashed lines. For 28Si, we observe a splitting in energy of the two outer =1 transitions for . This splitting has a maximum for [111] and should result in a splitting of the broad =1 EPR resonance. However, we cannot resolve this splitting in our experiments due to the comparatively strong defect-induced inhomogeneous broadening. For natSi, the g-values are shifted to more negative values with respect to 28Si for both transitions. The resonance is shifted more strongly than the resonance.
In our EPR experiments we observe only one resonance with a g-value that corresponds to an average of the g-values of the two outer =1 transitions that is weighted according to the equilibrium populations of the different spin states. In Fig. 8(b), the experimentally obtained g-value anisotropies of the outer- as well as the inner =1 resonances for 28Si (open circles) and natSi (open triangles) are plotted. In addition, also the effective g-values of the substructure superimposing the outer =1 resonance are shown for natSi (crosses). For direct comparison, the corresponding theoretical results are shown in Fig. 8(c). The effective g-values of the outer =1 resonances were calculated by taking the maxima of the weighted sums of the and transition energy distributions assuming Boltzmann distributed populations of the four spin states (=3 K). The effective g-values at which the substructure line on the broad =1 resonance is expected were calculated under the assumption that the substructure lines result from a subensemble of acceptors for which the transition energies of the two outer =1 transitions are equal, i.e. the energy level scheme of the four level spin system is symmetric. Neubrand (1978a) The solid lines in Figs. 8(b) and (c) are again numerical fits using the model described in Ref. Neubrand, 1978a. We note that the g-value scale in Fig. 8(c) is shifted by 0.04 with respect to the one in Fig. 8(b) to enable a better comparison between the experimental and theoretical data. Disregarding this rigid shift, which is caused by the error of the absolute g-values obtained from our model, our calculations can be used to describe and understand the different experimental observations. For the inner =1 transition , we could already see in Figs. 2 and 3 that the isotopic perturbation does not lead to a measurable shift in the g-value for the 0∘ orientation. As can be seen in Fig. 8, this finding holds for all orientations of the magnetic field. Comparing the anisotropies of the outer =1 resonance in Figs. 8(b) and (c) for 28Si and natSi, we observe a similar shift of the g-values. Due to the large linewidth of the latter resonance of up to 100 mT in natSi, it was not possible to extract a reliable g-value for all intermediate orientations of the magnetic field from our experimental spectra.
The g-values of the substructure line in natSi, which could be determined for all orientations of the magnetic field and with a higher precision due to its comparatively small linewidth, show only a small deviation from the effective g-values of the outer =1 resonance in 28Si irrespective of . In clear contrast to what has been reported in Ref. Neubrand, 1978a, this means that the resonance field of the substructure line does not coincide with the center of the broad =1 resonance in natSi. The agreement between our theoretical model and the experimental data in this point strongly indicates that the substructure lines indeed originate from a subensemble of acceptors where the energy splittings between the states and and the states and are equal.
For the =1 substructure line in natSi, the best fits to our experimental data is obtained for =-1.0776 and =-0.0307. For the inner =1 resonance, we obtain =-1.0728 and =-0.0315. In Ref. Neubrand, 1978a, for comparison, =-1.0740 and =-0.0307 was determined for the =1 substructure and =-1.0676 and =-0.0317 was measured for the inner =1 resonance. We find a good agreement of our data with the original reports in particular for , which determines the angular dependence of the effective g-values. For , which causes an angle-independent offset of the g-value anisotropy, we obtain slightly lower values. This deviation might result from differences in the calibration of the magnetic field.
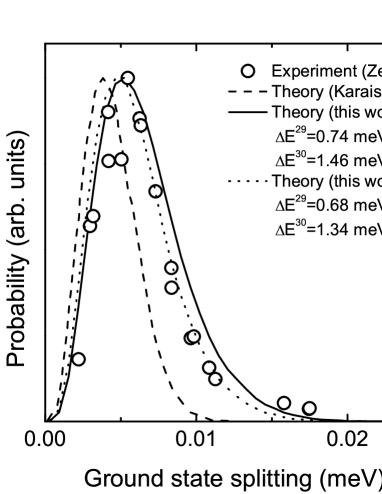
Figures 3 to 7 show that the line shape and width of the =1 and =2 resonances in natSi with a low concentration of point defects can quantitatively be understood by our model accounting for the fluctuations of the valence band position caused by the disorder in the placement of the different Si isotopes in the crystal lattice in the vicinity of the different B acceptor nuclei. In contrast, the original model used to calculate the acceptor ground state splitting for =0 could not explain the experimentally observed value quantitatively. Karaiskaj et al. (2003) In Fig. 9, the calculated statistical distribution of the B acceptor ground state splitting taken from Ref. Karaiskaj et al., 2003 (dashed line) is shown together with experimental data that were obtained from phonon absorption spectroscopy. Zeile and Lassmann (1982); Zeile et al. (1982). The shapes of the distributions are in good agreement, however, the maximum of the splitting energy shows a discrepancy of 30 %. To investigate the origin of this discrepancy, we have repeated the calculations for the distribution of the residual ground state splitting in natSi applying our theoretical method to =0. The result is depicted as the solid line in Fig. 9 and shows a much better quantitative agreement with the experimental data. Besides the potential at the central grid node, which was not adjusted for the calculations for =0, the most relevant parameters in our model are the valence band offsets between the different Si isotopes (). Since the values used for these parameters in this work so far are identical to the ones used in Ref. Karaiskaj et al., 2003, the discrepancy between the acceptor ground state splitting at =0 calculated in the original work and in the present work can not be attributed to an uncertainty in the valence band offsets deduced from Ref. Cardona and Gopalan, 1989. It should rather result from a less realistic modeling of the boron acceptor wave function. In order to see how sensitive the residual ground state splitting depends on the assumed valence band offsets, we have recalculated the distribution of splitting energies for different . The second parameter is directly linked to the value of by the dependence of the renormalization energy on the isotope mass . Using our wave functions, the best overall agreement with the experimental data shown in Fig. 9 is obtained when and are decreased by 8 % from their original value (dotted line). We have also recalculated the EPR spectrum of the =1 resonances in natSi with the reduced values and the result of this simulation is shown as the dashed line in Fig. 3(a). Using the lower band offsets, we obtain a slightly worse agreement with the experimental spectrum on the low-field edge of the broad , resonance, while an equally good or even slightly better agreement is found for the central region and the high field edge of this resonance as well as for the line. In view of the overall agreement with the experimental data and neglecting possible inaccuracies of the wave functions obtained from our calculations, we suggest a slight correction of the valence band offsets between the different Si isotopes to =0.68 meV and =1.34 meV. We note that a deviation from the original values by more than 5 % to higher energies and more than 10 % to lower energies would lead to a significant discrepancy between theory and experiment.
V Conclusions
We have set up a theoretical model that allows for a quantitative description of the isotopic effect on the Zeeman energy level scheme of paramagnetic B acceptors in Si, accounting for the isotopic perturbation via local fluctuations of the valence band edge at 29Si and 30Si lattice sites. Using this model, we can reproduce the experimentally observed line shapes of the B-related =1 and =2 resonances in natSi with excellent agreement between theory and experiment. Our results demonstrate that the inhomogeneous broadening of B-related EPR lines measured in ultra-pure natural silicon can quantitatively be understood from the isotopic perturbation, both in its magnitude as well as in the resulting line shapes, without the necessity to invoke hyperfine interaction with the B nucleus or with 29Si. Concretely, the open questions raised in the introduction can be answered as follows: (i) As can directly be deduced from a comparison of the data shown in Fig. 6 and Fig. 2 in Ref. Neubrand, 1978b, the Gaussian contribution to the line shape of the broad =1 resonance is merely a phenomenological way to account for the broadening induced by the isotopic randomness. However, a Gaussian line is no realistic representation of the isotope-induced broadening, which is determined by the distribution of transition energies shown in Fig. 2. Therefore, an additional Lorentz line was needed in Ref. Neubrand, 1978b to obtain a reasonable fit of the broad =1 resonance measured with the samples of highest crystalline purity. Consequently, the 10 mT threshold of the Lorentzian contribution to the line shape (ii) was an artifact that resulted from an inappropriate model of the line shape in the limit of low point defect concentrations. We have found that the perturbation due to the random distribution of the different Si isotopes also leads to a shift in the effective g-values, mainly of the broad =1 and the =2 resonances. We note that this isotope induced shift could in principle be used to control the g-values of a B acceptor by tailoring its isotopic surrounding. This could also be achieved dynamically by placing an acceptor close to an isotopic heterojunction and manipulating its wave function with the help of electric fields. This idea might particularly be of interest for applications e.g. in quantum computation technology, as it could be realized in a completely nuclear spin free environment only using 28Si and 30Si isotopes. To give an example, we obtain an average g-value of the broad =1 resonance of -1.267 for an isotopically engineered material composed of 50 % 28Si and 50 % 30Si (, =3 K), which corresponds to a 4.2 % change of the g-value compared to =-1.216 calculated for pure 28Si. Concerning issue (iii), our results suggest that the substructure lines of the =1 and =2 resonances originate from a subensemble of acceptors, where the Zeeman level scheme is perturbed such that the , transition energies are equal. We discuss these substructure lines and their dynamics in more detail in Ref. Tezuka et al., 2010. Finally, a comparison of our calculation with previous works investigating the B acceptor ground state in the absence of an external magnetic field, provides an independent verification of the energy offsets between the valence bands of the different isotopes of silicon.
Acknowledgements.
Work at Walter Schottky Institut has been supported by the DFG (Grants No. SFB 631, C1 and C3, and Br 1585/5). Further, we acknowledge support from the JST-DFG Strategic Cooperative Program on Nanoelectronics, the Grant-in-Aid for Scientific Research #18001002, Special Coordination Funds for Promoting Science and Technology, and a Grant-in-Aid for the Global Center of Excellence at Keio University.References
- Feher (1959) G. Feher, Phys. Rev. 114, 1219 (1959).
- Feher and Gere (1959) G. Feher and E. A. Gere, Phys. Rev. 114, 1245 (1959).
- Wilson and Feher (1961) D. K. Wilson and G. Feher, Phys. Rev. 124, 1068 (1961).
- Stutzmann et al. (1987) M. Stutzmann, D. K. Biegelsen, and R. A. Street, Phys. Rev. B 35, 5666 (1987).
- Müller et al. (1999) J. Müller, F. Finger, R. Carius, and H. Wagner, Phys. Rev. B 60, 11666 (1999).
- Huebl et al. (2006) H. Huebl, A. R. Stegner, M. Stutzmann, M. S. Brandt, G. Vogg, F. Bensch, and U. Gerstmann, Phys. Rev. Lett. 97, 166402 (2006).
- Pereira et al. (2009) R. N. Pereira, A. R. Stegner, T. Andlauer, K. Klein, H. Wiggers, M. S. Brandt, and M. Stutzmann, Phys. Rev. B 79, 161304(R) (2009).
- Kohn (1957) W. Kohn, Solid State Physics Vol. 5, edited by F. Seitz and D. Turnbull (Academic Press, New York, 1957), p. 257.
- Feher et al. (1960) G. Feher, J. C. Hensel, and E. A. Gere, Phys. Rev. Lett. 5, 309 (1960).
- Neubrand (1978a) H. Neubrand, phys. stat. sol. (b) 86, 269 (1978a).
- Neubrand (1978b) H. Neubrand, phys. stat. sol. (b) 90, 301 (1978b).
- Köpf and Lassmann (1992) A. Köpf and K. Lassmann, Phys. Rev. Lett. 69, 1580 (1992).
- Karaiskaj et al. (2002) D. Karaiskaj, M. L. W. Thewalt, T. Ruf, M. Cardona, and M. Konuma, Phys. Rev. Lett. 89, 016401 (2002).
- Karaiskaj et al. (2003) D. Karaiskaj, G. Kirczenow, M. L. W. Thewalt, R. Buczko, and M. Cardona, Phys. Rev. Lett. 90, 016404 (2003).
- Cardona and Gopalan (1989) M. Cardona and S. Gopalan, Progress in Electron Properties of Solids, edited by R. Girlanda et al. (Kluwer, Dordrecht, 1989), p. 51.
- Birner et al. (2007) S. Birner, T. Zibold, T. Andlauer, T. Kubis, M. Sabathil, A. Trellakis, and P. Vogl, IEEE Trans. Electron Devices 54, 2137 (2007).
- Pantelides and Sah (1974) S. T. Pantelides and C. T. Sah, Phys. Rev. B 10, 621 (1974).
- Belyakov and Burdov (2007) V. A. Belyakov and V. A. Burdov, J. Phys.: Condens. Matter 20, 025213 (2007).
- Tezuka et al. (2010) H. Tezuka, A. R. Stegner, A. M. Tyryshkin, S. Shankar, M. L. W. Thewalt, S. A. Lyon, K. M. Itoh, and M. S. Brandt, arXiv:1003.4339v1 (2010).
- Bir et al. (1963) G. L. Bir, E. I. Butikov, and G. E. Pikus, J. Phys. Chem. Solids 24, 1467 (1963).
- Cardona and Thewalt (2005) M. Cardona and M. L. W. Thewalt, Rev. Mod. Phys. 77, 1173 (2005).
- Fischer et al. (2008) J. Fischer, W. A. Coish, D. V. Bulaev, and D. Loss, Phys. Rev. B 78, 155329 (2008).
- Sennikov et al. (2005) P. Sennikov, T. Kotereva, A. Kurganov, B. Andreev, H. Niemann, D. Schiel, V. Emtsev, and H. J. Pohl, Semiconductors 39, 300 (2005).
- Zeile and Lassmann (1982) H. Zeile and K. Lassmann, phys. stat. sol. (b) 111, 555 (1982).
- Zeile et al. (1982) H. Zeile, U. Harten, and K. Lassmann, phys. stat. sol. (b) 111, 213 (1982).