Fast, gusty winds blowing from the core of the pre-planetary nebula M 2-56
Abstract
We report optical long-slit spectra and direct imaging (ground-based and with ) of the pre-planetary nebula (pPN) M2-56 obtained at different epochs. The optical nebula is composed by shock-excited material distributed in two pairs of nested lobes with different sizes and surface brightness. The compact, bright inner lobes (ILs) have an angular size of 151″ each and display closed, bow-shaped ends. The extended, faint outer lobes (OLs), which enclose the inner ones, have an agular size of 13″10″. Within the ILs and the OLs the velocity increases with the distance to the center, however, the ILs show expansion velocities larger than the OLs. Consistent with the large speeds reached by the ILs (of up to 350 km s-1 at the tips), we have measured the expansive proper motions of the knots (003 yr-1) by comparing images taken in 1998 and 2002. Moreover, we have discovered remarkable changes with time in the continuum and line emission spectrum of M 2-56. In 1998, we detected a burst of H emission from the nebula nucleus that is interpreted as an indication of a dense, fast (350-500 km s-1) bipolar wind from the nebula’s core (referred to as “F1-wind”). Such a wind has been recently ejected (after 1989) probably as short-duration mass-loss event. Our data also reveal an optically thick compact cocoon (or shell-like structure) and a H II region around the central star that result from further post-AGB mass-loss after the F1-wind. Recent brightening of the scattered stellar continuum as well as an increase of scattered H emission along the lobes is reported, both results pointing to a decrease of the optical depth of the circumstellar material enshrouding the star. The data presented here unveil the complex post-AGB mass-loss history of this object, whose rapid evolution is driven by multiple episodes of mass outflow, not regularly spaced in time, leading to: () acceleration of the molecular envelope that surrounds the optical nebula (kinematical age 1400 yr – Castro-Carrizo et al., 2002), () the OLs (350-400 yr), () the ILs (40 yr), () the F1-wind (10 yr), and () the nuclear cocoon and H II region (2 yr?). The sucessive multiple post-AGB winds in M 2-56 are characterized by ejection speeds increasing with time. In contrast, the mass-loss rate and linear momentum show a time decreasing trend.
1 Introduction
Planetary nebulae (PNe) evolve from Asymptotic Giant Branch (AGB) stars after a brief (103 yr), intermediate stage known as the pre-Planetary Nebula (pPN) or post-AGB phase. During the AGB to PN transition dramatic transformations occur: the spherical, slowly expanding ( 15 km/s) circumstellar envelope (CSE) expelled during the AGB becomes a nebula with, usually, clear departures from sphericity and fast ( 100 km/s) outflows directed along one or more axes. The varied PN and pPN morphologies include not only axisymmetric (elliptical and bipolar) shells but also multipolar (multiaxial) structures, multiple co-axial shells, highly collimated jet-like ejections sometimes arranged in a point-symmetric structure, etc (e.g. Sahai et al., 1998, 2007; Ueta et al., 2007; Siódmiak et al., 2008). Most of the observed PN and pPN morphologies are difficult to explain without invoking the action of precessing, perhaps episodic, collimated outflows (e.g. Miranda et al., 1999; Guerrero et al., 2001; Miranda et al., 2006). In fact, collimated outflows are considered as the main shaping agent of PNe through their interaction with the spherical AGB CSE (Sahai & Trauger, 1998).
The existence of very young, high velocity bipolar jets in some PPNe and evolved AGB stars is evidenced, for example, by water maser observations (e.g. Imai et al., 2002; Imai, 2007; Suárez et al., 2009, and references therein). In some pPNs/PNs, fast, post-AGB winds are also revealed by P-Cygni profiles in the H (and other recombination lines) emission close to the central star (Sánchez Contreras & Sahai, 2001; Sánchez Contreras et al., 2008). In spite of the growing evidence of jet-like ejections in PPNs, their origin, nature (episodic or continuous?), typical mass-loss rates, life-times, etc, are still very poorly known. Detailed studies of PPNs are crucial to obtain information about the properties and dynamics of post-AGB winds and their evolution. Optical spectroscopic observations of pPNs and PNs are particularly useful for probing the post-AGB winds and their interaction with the CSE formed in the previous AGB phase.
This work focuses on the pPN M 2-56 (= IRAS 23541+7031= PK 118+08), which so far remains relatively poorly characterized, especially in the visible. A ground-based optical image obtained by Goodrich (1991, hereafter G91) showed a 10″2″ bipolar nebula with its long axis oriented in the East-West direction (P.A.=90°). The limited quality of this image (PSF16 and low S/N) impeded a correct identification of the different nebular components in M 2-56 revealed by data presented in this work. High-angular resolution optical images obtained with the have been used as complementary data by Siódmiak et al. (2008) and Castro-Carrizo et al. (2002) although a detailed study based on these images has not been done so far. The images show that the bright nebulosity referred to as the “West lobe” by G91 is resolved into two compact lobes (151″) emerging from the center. The emission line optical spectrum of M 2-56, with strong forbidden lines of low-excitation ions, indicates major excitation by shocks (Goodrich, 1991; Trammell et al., 1993; Riera et al., 2006). The lack of substantial polarization in the observed line spectrum implies that the latter is locally produced in the shock-excited lobes of M 2-56 and that there is not a significant contribution by line emission from the central regions reflected by the nebular dust (”scattered spectrum”, Trammell et al., 1993). (In this work we show that this situation has recently changed). The optical spectrum of M 2-56 also shows a weak red continuum that is the light from a B-type central star attenuated and/or partially reflected by circumstellar dust (Cohen & Kuhi, 1977).
A detailed study of the dynamics and morphology of the molecular envelope of M 2-56 with high-angular resolution was carried out by Castro-Carrizo et al. (2002). Interferometric CO mapping shows an incomplete 30″15″ hourglass-like envelope surrounding the optical lobes and similarly oriented to the latter in the plane of the sky. The inclination of the symmetry axis of the CO envelope with respect to the plane of the sky is estimated to be =17°2°, with the East side of the nebula tilted towards us. The densest molecular material lies at the center, where the intersection of the two bipolar lobes shapes an equatorial ring/torus expanding at 7-8 km s-1. Two compact CO clumps are found at the tips of each lobe expanding axially with velocities of 100-200 km s-1. The total mass and linear momentum of the molecular envelope of M 2-56 is =0.05 and =2 km s-1, adopting a distance to the source of =2.1 kpc and a standard value of the CO-to-H2 relative abundance of X(CO)=2. The morphology and dynamics of the bipolar nebula is interpreted as the result of the interaction between fast, collimated post-AGB ejections and the slow CSE formed during the AGB phase. The Hubble-type expansion of the molecular outflow suggests that such an interaction took place approximately 1400 yr ago in a relatively short time, 300 yr.
In this paper we will adopt a distance to M 2-56 of =2.1 kpc based on the detailed discussion and final estimate by Castro-Carrizo et al. (2002). As estimated by these authors, for such a distance, the luminosity of M 2-56 obtained by integrating its spectral energy distribution (SED) from the optical to the mm-wavelength range is 5500 .
In this work, we report multi-epoch optical long-slit spectra and images of M 2-56 that have allowed us to describe the structure, kinematics, physical conditions, and mass-loss history of this object with unprecedented detail. Our results are discussed in terms of the formation and evolution of M 2-56, which is currently in rapid transition from the AGB to the PN stage and presents clear signs of on-going, variable wind activity at the nucleus. A summary of our findings is given in Section 8.
2 Observations and data reduction
2.1 Optical Imaging
2.1.1 Ground-based images
We have obtained broad- and narrow-band images of M2-56 using the Wide Filed Camera (WFC) at the prime focus of the 2.5m INT of the Roque de los Muchachos Observatory (La Palma, Spain). Observations were performed on service time mode on June 13th, 2009. The WFC consists of 4 thinned EEV 2k4k CCDs. The CCDs have a pixel size of 13.5 µm corresponding to 033 per pixel. Our target was observed with the chip CCD4, which has a field of view of 12′23′. Two filters were used: H (=6568Å, FWHM=95Å) and Harris (=6380Å, FWHM=1520Å). The integration times were about 530 and 2400 s for the R and H images, respectively. The compact, nuclear regions of M2-56 are saturated in the H image. The weather was good during the observations and the seeing was about 13-15.
Images have been debiased and flat field corrected following the standard procedure using IRAF111IRAF is distributed by the National Optical Astronomy Observatories, which are operated by the Association of Universities for Research in Astronomy, Inc., under cooperative agreement with the National Science Foundation.. Individual frames have been registered and combined for each filter to produce final images shown in Fig. 1.
2.1.2 images
We have used two (H and continuum) high angular resolution images of M 2-56 from the archive. The H image was obtained with the WFPC2 PC camera using the narrow band filter F656N (=6564Å, FWHM=21.5Å) on 1998-09-04 (GO 6761; PI: S. Trammell). This camera has a field of view (FoV) of 40″40″ and a plate scale of 005 per pixel. Total exposure time was 5000 s. The continuum ( band) image was obtained with the ACS/HRC camera using the broad-band filter F606W (=5907Å, FWHM=2342Å) on 2002-12-23 (GO 9463; PI: R. Sahai). The ACS camera has a field of view of 26″29″ and a plate scale of 0025 per pixel. Total exposure time was 800 s. The images (Figs. 1 and 2) were pipeline reduced.
2.2 Optical Spectroscopy
We have obtained optical long-slit spectra of M 2-56 using the Intermediate Dispersion Spectrograph (IDS) of the 2.5m Isaac Newton Telescope (INT) and the Andalucía Faint Object Spectrograph and Camera (ALFOSC) mounted on the 2.6 m Nordic Optical Telescope (NOT) of the Roque de los Muchachos Observatory (La Palma, Spain). Observations were performed in three different campaings in 1998, 2000, and 2009. The log of our multi-epoch spectroscopic observations is given in Table 1.
2.2.1 INT+IDS
For the first set of spectroscopic observations with IDS (run#1), the detector used was a TEK 24 µm CCD with 11241124 pixels mounted on the 500mm camera. Three slits positions were observed: one at position angle PA=90° (the symmetry axis of the nebula) passing through the nebula center (referred to as PA90) and two oriented along PA=0°, one passing through the bright nebula center (PA0) and the other approximately through the center of the East lobe (at offset +6″ from the center, PA0E) – see Fig. 3, leftmost panel. The slit was 1″ wide and long enough to cover the whole nebula. CuNe lamps were used for wavelength calibration. The achieved spectral resolution (FWHM of the calibration lamp lines) was 44 km s-1 around H.
For the second set of spectroscopic observations with IDS (run#2) the detector was the EEV10 CCD, with squared pixels of 13.5µm lateral size. Only a clear and unvignetted region of 7002600 pixels was used (the 2600 pixels were along the spectral axis). The CCD was mounted on the 500mm camera. A total of four slits positions were observed with the R1200Y grating (Fig. 3, leftmost panel): we repeated positions PA90 and PA0E, already observed in run #1, and also added two more, one oriented along PA=0° passing through the West lobe (at offset 6″ from the center, PA0W) and another one passing through the nebula center but oriented along PA=119° (PA119). For the slit position PA90 we also observed with the R900V grating. We used CuNe and CuAr lamps to perform the wavelength calibration. The spectral resolution achieved was 50 km s-1, at H, and 83 km s-1, at H.
In both runs, #1 and #2, flux calibration was done using sensitivity functions derived from spectrophotometric standards, namely, HR1544, HR3454, and HD217086, and taking into account the atmospheric extinction curve at La Palma. All observations were performed under photometric conditions and with a typical seeing of 1″ except for those carried out the first night of our run #2 (2000-11-11), during which an average seeing of 2″ was measured. A secondary flux calibration of the mentioned dataset observed under non-photometric conditions (i.e. within the 6200-6800Å range covered by grating R1200Y) was performed by matching the fluxes of the [S II]6716,6731Å doublet lines measured in 1998 and 2000, that is, assuming that the line fluxes have not changed with time. This is a reasonable assumption given the stability of the profile of these lines in all our campaigns (including run #3 in 2009). We derive a value for the scale factor of 4 (4). Once applied to all line fluxes in the range 6300-6740Å, this factor also corrects for the different seeing in our non-photometric data (2″), which affects the fraction of the nebular emission that enters the slit. We double-checked the obtained flux scale factor by comparing the fluxes integrated over the nebular core (the inner 2″) of all lines (not only [S II]) in the spectra taken in 2000 along PA90 (under non-photometric conditions) and along PA119 (under photometric conditions), since both slits pass through almost the same central regions.
2.2.2 NOT+ALFOSC
Observations were done in service time mode using the CCD #8 detector, with 20482048 13.5 µm sized pixels, and the VPH Grism #17. A 09-wide (53-long) slit oriented at PA=90° and passing through the nebula center (slit PA90) was employed. The effective spatial resolution (seeing) was 09. We observed and used Ne lamps for wavelength calibration. The achieved spectral resolution 61 km s-1 around H. The spectrophotometric standard star BD+284211 was observed and used for primary flux calibration. A secondary flux scale factor of 7 has been obtained, following the procedure described in the previous subsection 2.2.1, and applied to the data. Final spectra, obtained after standard data reduction with IRAF, are shown in Figs. 5-7.
3 Results
3.1 Imaging
In Fig. 1 we present images of M 2-56 that unveil the different components of the optical nebula and their morphology. We find two pairs of nested lobes similarly oriented in the plane of the sky (along P.A.90°) but with different sizes and a large contrast in surface brightness. The bright inner lobes (ILs), which can only be identified and spatially resolved in the images, have an angular size of 151″ and display closed, bow-like ends, which very likely represent shock fronts. A ’three finger’-like structure at the base of the east IL (within 05 from the core) can be seen in the F606W image. The faint, more extended (13″10″), outer lobes (OLs), which are probed by our deep ground-based images but are only barely detected in the images, enclose the inner ones. Both pairs of lobes present an overall axial symmetry, however, they display a remarkable clumpy structure, including strings of compact knots and curved features that do not always have an axial counterpart.
The surface brightness of the east lobes is larger than that of the west ones222Hereafter, we will refer to the east (west) ILs and OLs as eILs and eOLs (wILs and wOLS), respectively.. This is most likely a result of a larger extinction of the west side of the nebula, which is receding from us, given the hourglass distribution of the molecular, and presumably dust, envelope around the optical nebula (§ 1 and § 5). The larger brigthness contrast at the central parts of the nebula (e.g., note that the three-finger structure of the eIL does not have a counterpart in the west) is consistent with a larger extinction along the densest equatorial regions.
In spite of their different filter bandwidth, both the broad- and narrow-band images of M 2-56 trace approximately the same gas component, as deduced from our long-slit spectra (§ 3.2). First, the contribution of the continuum to the emission within the F606W and F656N filters was negligible at the time the images were acquired, except maybe in the innermost regions of the ILs (within 025) where a very weak continuum level is detected in our spectra. Second, although the broad-band filter F606W includes several lines other than H, e.g., [N I]5200Å, Na I5893Å, [O I]6300,6363Å, [N II]6548,6583Å and [S II]6717,6731Å (see also G91), the majority of these low-excitation transitions are expected to arise in the same H-emitting regions probed by the F656N filter. The only exception could be the [N II] and [S II] doublets, which may proceed from regions with a slightly higher excitation, however, these lines have a contribution to the total line flux within the F606W filter of less than 30% (see Table 2 and G91).
We have noticed some differences between the two images, F656N and F606W, which were observed in 1998 and 2002, respectively. In particular, the string of knots/clumps at the tips of the ILs in 2002 is located 010-016 ahead the same structure as it was observed in 1998 (Fig. 2). This is true for both the east and west ILs and we believe it is due to proper motions333Here the term ”proper motion” is not used to describe the apparent motion of the nebula as a whole with respect to more distant stars but to refer to the tangential motion of material in the expanding nebula (e.g. the knots). (003 yr-1) resulting from the fast expansion of the ILs (see § 3.2.1 and 4.1).
The base of the eIL also has a quite different appearance in the F606W and F656N images. In particular, the three finger-like structure visible in the F606W image is absent in the F656N image. In the latter image, the same region, i.e. the base of the eIL, shows an asymmetrical cone-like morphology but has a smoother brightness distribution slightly elongated to the north-east. These changes cannot be unambiguously attributed to real variations with time of the nebular structure since we cannot rule out some contribution from continuum emission (due to dust scattering in these innermost regions) that may be different in the F656N and F606W filters.
Finally, we have compared our two-epoch H images observed with the in 1998 and with the INT in 2009. There is an emission clump located at offset =5″, =8″ that is visible in both data sets (clump C1; Fig. 1). Surprisingly, there is another pair of even brighter clumps in the ground-based image, labeled C2 and C3, which are not detected in the images. Other fainter clumps or knots within the OLs (e.g. C3’) visible in our 2009 images may have remained below the noise level in the images.
3.2 Spectroscopy
In this section, we show the results from our multi-epoch spectroscopic observations. In Table 2 we report the fluxes () of the different lines detected. These fluxes have been measured from the PA90 spectrum integrating along the 1″-wide slit and over the full width of the spectral profile, after fitting and subtracting the continuum level. In the table, we also provide dereddened fluxes () for a mean logarithmic extinction coefficient of c(H)=1.50.1 (see § 5).
We have discovered significant changes with time in the line and continuum emission spectrum of M 2-56. Amongst the different lines detected, H is the transition displaying the most extreme profile variations. We will first report our results obtained from the spectra observed in 1998 and 2000, for which the differences found only affect the line emission from the nuclear regions. Next, we will describe the long-slit spectrum along PA90 obtained in 2009, which shows additional changes with respect to the data obtained in our two previous runs.
3.2.1 1998 and 2000 observations
In Figs. 3 and 4, we show the optical spectrum of M 2-56, which is composed of recombination and forbidden line emission plus a weak, red continuum. In 1998, the continuum emission arises from a central compact region that is unresolved in our data (with a PSF09). The continuum intensity near H (around 6510Å) in 1998 integrated over the 1″1″ central region of M 2-56 is 1.5(0.4)10-17 erg s-1 cm-2 Å-1. In 2000, we derive an upper limit for the continuum intensity within the same central region of 2.410-17 erg s-1 cm-2 Å-1 (i.e. 2 ). Therefore, the non detection of the continuum in 2000 is consistent with its intensity remaining constant from 1998 to 2000. (As shown in § 3.2.2, the continuum is brighter in 2009).
The long-slit H spectrum is characterized by a wide profile with a quite complex spectral and spatial distribution (Fig. 3). Along the nebula axis (slit PA90), the H emission can be traced from the brightest central regions up to the fainter tips of the OLs at 12″. The H emission from the east and west lobes (approaching to and receding from us, respectively, § 1) is, on average, blue- and red-shifted, consistent with an expansive nebular kinematics. The spatial distribution of the emission from the bright, compact ILs is only partially resolved in our long-slit spectra and can be traced from the center up to 2″. In these innermost regions, the much fainter OLs are not expected to contribute significantly to the H emission given the large brightness contrast with the ILs evidenced by the images. Along the ILs, the line-of-sight or radial expansion velocity increases with the distance reaching a maximum value of =110 km s-1 at the tips. In these outermost regions of the ILs, the H profile is rather broad, with a full width at zero intensity (FWZI) of 360 km s-1. The H long-slit profile along and across the OLs (e.g., along PA0E) is roughly consistent with the lobes being expanding bubble-like structures. We measure a value for the mean radial expansion velocity of the OLs of 50 km s-1, which is smaller than that derived for the ILs. In the outermost parts of the OLs, at axial offsets 10″-12″ (PA90), our spectra indicate a slightly smaller radial expansion velocity of =30-35 km s-1.
We have found remarkable differences between the H emission from the nucleus of M 2-56 as observed in 1998 and in 2000 (Fig. 3). In 1998: a) the H profile shows emission wings that are much broader (FWZI1000 km s-1) than in 2000 (FWZI450-500 km s-1) – this difference is not explained by the lower S/N achieved in 2000 (note that the fainter emission from the OLs is well probed in our 2000 spectrum); and b) the H emission peak is blue-shifted by 110 km s-1 from the systemic velocity, unlike the spectrum in 2000, which peaks at . We refer to the intense, blue-shifted emission feature and its broad wings observed in 1998 as feature F1. We have checked that feature F1 was not present either in the long-slit spectrum along the nebula axis acquired in 1989 by G91. The broad wings of feature F1 are not symmetric, the blue wing seems to be depressed relative to the red one, which may be interpreted as a blue-shifted (P-Cygni like) absorption in the profile. The blue-shift of the wing absorption is found at 430km s-1. The presence of the spectral component F1 is clearly appreciated also in the H spectrum taken with the slit oriented along the nebula equator PA0. The angular size of the region that produces feature F1 is very small, 05 along the main symmetry axis of the nebula and unresolved along the equator (06).
In 1998, feature F1 was not only visible in the H spectrum but also in the [N II]6548,6584Å lines. In contrast, feature F1 is not present in the [S II]6716,6732Å transitions: note that the two lines of the doublet have comparable profiles in 1998 and 2000 (see Fig. 7). The profiles of the [S II] lines are indeed very much alike to those of H and the rest of the transitions as observed in 2000 (and in 2009, see next subsection § 3.2.2).
3.2.2 2009 observations
Figs. 5 and 6 display the long-slit spectrum of M 2-56 obtained in 2009. Multi-epoch spectra extracted over the central 1″1″ region are compared in Fig. 7.
In 2009, a relatively faint, red continuum is observed not only at the center (as in 1998) but also along the lobes of M 2-56. As for most pPNs, the continuum emission is dominated by the stellar photospheric continuum scattered off by the nebular dust (we have checked that the contribution by nebular continuum is negligible given the intensity of the H emission). The spatial distribution of the scattered continuum peaks at the nebula center and has two relative maxima at axial offsets 65. The latter regions correspond to condensations C3 and C3’ in the ground-based images (Fig. 1). The central region where the continuum is observed has a deconvolved angular size along the axis of 15, i.e. significantly larger than in 1998 (05). The continuum flux near H (around 6510Å) within the 1″1″ central region in 2009 is 3.210-16 erg s-1 cm-2 Å-1, that is, larger than that measured in 1998 by a factor 20.
The shape of the H long-slit profile shows marked differences with respect to that observed earlier, not only in the central regions but also along the extended OLs. The H emission from both the approaching and receding (west and east, respectively) lobes is on average red-shifted, in contrast to what we observed in 1998 and 2000. The red-shift of the H emission from the aproaching eOL is smaller than that from the receding wOL. At the nebula center, the H emission has a broad asymmetric profile that peaks at =65km s-1, i.e. red-shifted (by 90km s-1) with respect to . The FWZI of the H nuclear profile cannot be accurately determined because of blending with the adjacent [N II] doublet; we estimate that it is larger than 1300km s-1 and probably reaches up to 2500km s-1.
The observed red-shift of the H line for both the approaching and receding lobes indicates that in 2009 a significant fraction of the H emission in the lobes is scattered, i.e. is not locally produced in the lobes but rather arises at the nebular core and is reflected by the nebular dust. In fact, the similar spatial distribution of the H emission and the reflected continuum beyond 6″ indicates that in these regions the H emission is mainly scattered. In the inner regions, however, some contribution of unscattered H emission (produced locally in the lobes) can still be appreciated. Composite H line profiles consisting of two components (scattered and unscattered) are also found in other pPNs, for example, M 1-92 (Trammell et al., 1993), M 2-9 (Solf, 2000), CRL 618 (Trammell et al., 1993; Sánchez Contreras et al., 2002), etc.
In contrast to H, the long-slit profiles of the forbidden transitions [O I]6363Å, the [N II]6545,6584Å and [S II]6716,6731Å in 2009 are totally consistent with those observed in our previous runs444Except for the presence of feature F1 in the [N II] doublet lines in 1998, § 3.2.1: roughly point-symmetric with respect to the spatial origin and and with the emission from the east and west lobes blue- and red-shifted, respectively. This is consistent with the forbidden lines being predominantly produced locally in the shocked nebular material.
We have discovered a number of emission lines in this work, including several Fe II, Fe I, and Si II permitted transitions (Fig. 5 and Table 2). We have also detected a broad (FWHM6Å) absorption feature centered near 6673Å at the nebula center but slightly blue-shifted, near 6670Å, along the east and west lobes. The relative blue-shift of the band between the center and the lobes indicates that it does not have an interstellar or telluric origin but rather is associated to M 2-56. We have not found a satisfactory identification for this broad absorption, which may be a solid state or ice feature given its large width; a blend of atomic lines cannot be ruled out either.
The emission distribution of the recombination lines discovered is quite different from that of the forbidden transitions. As for H, the former are red-shifted with respect to along the approaching eOL as well as at the nebula center (these transitions are not detected in the fainter west lobes). The red-shift measured in the eOL is smaller than that in the center. We conclude that the observed recombination lines most likely arise at the nebula nucleus and their emission is scattered by circumstellar dust.
Another important change detected in 2009 is the increase of the relative intensity of H with respect to the various forbidden transitions observed. For example, in 2009, the H-to-[N II]6584Å intensity ratio reaches a value of 15, much larger than in earlier epochs, 3.2-3.4. The large H-to-[N II]6584Å intensity ratio is consistent with the presence of a compact H II region at the heart of M 2-56 responsible for the extra H flux in 2009: note the brightnening of the H line by a factor 10 relative to the flux measured in 2000.
4 Nebular components and their spatio-kinematic structure
In this section we describe the main nebular components in M 2-56 revealed by our data and analyze their spatio-kinematical structure. We also estimate the inclination of the nebula axis, which is a critical parameter to correct for projection effects both in the geometry and expansion velocities observed.
4.1 The inclination of the nebula
The inclination of the nebula axis is derived in two different ways. First, from the proper motions observed in the images (Fig. 2 and § 3.1). For a distance to M 2-56 of =2.1 kpc (§ 1), the observed proper motions (003 yr-1) imply a tangential expansion velocity (i.e. projected on the plane of the sky) of 325 km s-1. Since the line-of-sight or radial velocity at the tips of the lobes measured from our long-slit spectra is 110 km s-1 (§ 3.2), we obtain an inclination angle to the plane of the sky of =tan-1(/ )=19°. This value is in very good agreement with the independent estimate of =17° for the symmetry axis of the bipolar CO envelope by Castro-Carrizo et al. (2002). We derive an absolute (deprojected) expansion velocity at the tips of the ILs of 350 km s-1. This value is similar to the FWZI of H emission at the ends of the ILs; the latter is known to be a reliable indicator of the shock velocity for bow-type shocks, independent of orientation angle, preshock density, bow shock shape, and preshock ionization stage (Hartigan et al., 1987).
An independent estimate of can be obtained from the radial velocities measured at clumps C3 and C3’ in the east and west OLs, respectively, where the H emission is mainly scattered (§ 3.2.2). Assuming that regions C3, C3’, and the nebula center are aligned along a given axis, which is inclined to the plane of the sky by , and that the clumps move away from the central star at the same expansion velocity, , then we can readily find and from the following expressions:
| (1) | |||
| (2) |
(see, for example, Solf, 2000). Taking into account the values of (C3)=31.3 km s-1 and (C3’)=60.9 km s-1 measured on the H spectrum along PA90 (Fig. 6), we obtain =46 km s-1 and =18.8°. The value of found is in excellent agreement with that computed for the ILs from the proper motions and that of the bipolar molecular envelope.
4.2 Spatio-kinematic model of OLs and ILs
In order to investigate the structure and velocity field of the optical lobes of M 2-56 we have developed a simple spatio-kinematical model that reproduces the 2D profile of our long-slit spectra. Although the model has been mainly applied to the PA90 spectrum, we have checked that it also qualitatively explains the spectra at the other slit orientations. Our model calculates the position-velocity (p-v) diagram assuming a certain morphology for the envelope (compatible with our direct images) and a given velocity field, and also taking into account the inclination of the nebula to the plane of the sky (=18°). We note that our code is not an emission model, that is, does not predict the H brightness distribution along PA90.
In Fig. 8 we present the geometry adopted and synthetic p-v diagrams predicted by our best model for the H line. The nebular component responsible for the spectral feature F1 is not included in our model because it is not spatially resolved in our spectra. We are assuming in our model that the lobes are hollow and show an overall axial symmetry, as suggested by the optical appearance of M 2-56. For the OLs and the ILs, the model fit yields a linear size of about (41017 cm)(31017 cm) and (61016 cm)(41016 cm), respectively, measured along the symmetry axis and the perpendicular direction where the lobes reach their maximum extension.
For the adopted geometry, the velocity field that best reproduces the long-slit spectrum of the OLs consists of three main components: 1) radial expansion with the modulus of the velocity at each point increasing linearly with the distance to the nebula center; 2) axial expansion with the velocity modulus increasing linearly with the distance to the equatorial plane; and 3) shear-flow kinematics, with the velocity vectors tangential to the curved surface adopted for the lobes and with a constant velocity modulus. The components that dominate the velocity field in M 2-56 vary from the base of the OLs, where components 1) and 3) prevail, to the external regions, where the velocity field is essentially axial. The velocity field described above, with the flow speed increasing with the distance to the center, works fine for most parts in the OLs, however, is not able to reproduce the relatively low radial velocities measured at the tips, 110 km s-1 around 10-12″, which implies an abrupt slow down of the flow. In these outer regions, represented in our model as bow-shaped caps detached from the main body of the OLs, the expansion seems to be dominated by a constant velocity axial field.
Since the spatial structure of the ILs is only partially resolved in our 2D spectra, we have adopted a simple axial velocity field that is able to reproduce the overall velocity gradient observed within the inner 2″. We deduce a rather steep variation of the deprojected expansion speed, increasing from tens of km s-1 near the center to 350 km s-1 at the lobe tips.
4.3 The wind responsible for the transient H feature F1
We believe that the H emission burst observed in 1998, referred to as feature F1, is the consecuence of a fast, dense, and short-lived post-AGB wind recently ejected (§ 7). We have measured a total angular size along the nebula axis of the region emitting feature F1 of 05 (1.571016 cm). The spectral profile of F1, notably asymmetrical, peaks at Vr 110 km s-1, i.e. bluewards of . This is consistent with a compact bipolar flow oriented similarly to the ILs and OLs, the red-shifted emission from the receding (west) side of the F1-wind being significantly extinguished by the optically thick equatorial regions of M 2-56. A larger extinction towards the inner regions of the wIL (compared to the base of the eIL) is, in fact, inferred from the brightness contrast between these two regions observed in the images and is also expected from the equatorially enhanced density distribution of the molecular envelope that surrounds the optical nebula of M 2-56 (§ 1 and § 5). (A one-sided collimated F1-wind is not impossible but improbable given the bipolar morphology, approximately symmetric with respect to to the equator, of the optical and CO envelopes of M 2-56). Adopting a bipolar flow with an inclination to the plane of the sky of =18°, we obtain a linear extension for this component of 1.651016 cm. The blue-shift of the intensity peak of F1 indicates that the bulk of the material in the F1-wind expands at a mean velocity of Vexp110/sin(18°)360 km s-1, very similar to the expansion speed at the tips of the ILs. The broad wings of feature F1 and the blue-shift (P-cygni like) absorption of the nuclear H profile indicate smaller amounts of gas expanding at larger velocities (up to 500 km s-1) in the F1-wind.
4.4 The central H II region
The presence of a compact H II region around the central star of M 2-56 is inferred from our data (§ 3.2.2). In 2009, a fraction of the H emission from such a region escapes the stellar vecinity and reaches the ILs and OLs where it is scattered off by dust. The kinematics of the H II region cannot be straightforwardly determined from the H line profile since the emission from this region is seen only after being reflected by the nebular dust, the resulting line profile being significantly affected by the distribution and kinematics of the dust. The broad profile of the H emission from the nebula nucleus (FWZI1900-2500km s-1) may indicate rapidly outflowing material in the stellar neighborhood, with very large expansion velocities of up to 1200 km s-1, however, we cannot rule out other line broadening mechanisms (e.g., Ramman scattering) being totally or partially responsible for the large FWZI of the H transition (see e.g. Sánchez Contreras et al., 2008, and references therein).
The H scattered profile observed at C3’ and C3 represents the profile emitted by the H II region as seen from the dust clumps located at those positions, i.e. from a ”pole-on” view. As we can see in Fig. 6, the H profiles at C3 and C3’ are very similar (except for an overall relative red-shift of 30-40 km s-1): they have a narrow intense core plus broad wings and show a notable P-cygni like profile, with the blue side depressed. The H emission towards the center exposes the profile emitted by the H II region as seen along the line-of-sight, i.e. from a direction nearly perpendicular to the lobes. Its overall red-shift indicates a significant contribution of scattered H emission also towards the nebula center. In this direction, the H profile is broader than that observed towards clumps C3 and C3’ and does not exhibit prominent blue-shifted absortion. This suggests that the P-cygni like absorption observed at C3 and C3’ is produced by neutral or partially neutral material outside the H II region and very likely distributed in a bipolar flow.
5 Extinction
We have used the H to H flux ratio measured in 2000 (Table 2) to estimate the extinction in M 2-56. Since the H and H fluxes have been obtained integrating spatially the spectrum along slit PA90 over the whole nebula, the value derived represents an average of the extinction along the lobes, which is expected to decrease from the center (nebular equator) to the tips of the lobes. We have measured a Balmer decrement of H/H121, for which we obtain a logarithmic extinction coefficient =1.50.1 adopting in intrinsic ratio H/H3.8. The latter value of the intrinsic H/H ratio is expected for the shock-excitation conditions in M 2-56 derived by several authors comparing observational line relative intensities with the predictions of theoretical shock excitation models (Goodrich, 1991; Trammell et al., 1993; Riera et al., 2006, and references therein). (For an intrinsic Balmer decrement closer to the recombination value, H/H3, we obtain c(H)=1.7-2.0.) From the value of , we deduce an average optical depth near H (around 6563Å) of 2.3 and, therefore, an average extinction in the band of AV3 mag, using the extinction law parametrization by Cardelli et al. (1989) and assuming the ratio of total to selective absorption, , equal to 3.1. Our result is in good agreement with previous estimates of AV=3.3 and 4.8 mag (Goodrich, 1991; Cohen & Kuhi, 1977), especially taking into account the lower intrinsic Balmer decrement, 3 and 2.85, adopted in these earlier works.
We have compared the extiction computed above with that predicted from the detailed model of the molecular envelope of M 2-56 performed by Castro-Carrizo et al. (2002) based on high-angular resolution interferometric maps of the CO (=1-0 and =2-1) emission. The molecular envelope surrounds the optical nebula and is expected to contain a mixture of gas and dust. We have derived the relative variation along the lobes of the CO column density from the geometry and density spatial distribution in the model. Adopting a given CO-to-H2 relative abundance, X(CO), and the standard conversion factor from H2 column density to optical extinction N=2.31021 AV cm-2, we have calculated the relative variation of the circumstellar extinction (A) along the lobes produced by the dust in the hourglass-shaped molecular envelope (Fig. 9, left). In order to determine the total (circumstellar plus interstellar) extinction, we have added the interstellar contribution in the direction to M 2-56, which is A=1.75 according to the “Galactic Dust Reddening and Extinction” calculator provided by IRSA/IPAC555http://irsa.ipac.caltech.edu/applications/DUST/ (Fig. 9, right).
In their model, Castro-Carrizo et al. (2002) adopt a typical value of X(CO)=210-4, however, these authors affirm that the average CO abundance in this object must be substantially lower due to significant photodissociation of this molecule. We find that assuming X(CO)310-5 we are indeed able to reproduce very well the total extinction derived from the Balmer decrement. (Note that most of the H and, especially, H emission arise in the bright ILs, therefore our estimate of AV3 mag represents the mean extinction over the central 2″-3″). We have obtained an independent estimate of X(CO) by comparing the total dust mass in M 2-56 obtained from simple SED modeling, =1.510-3 , with the mass of the molecular envelope derived from CO, =0.05 , assuming the standard value of X(CO)=210-4. Both masses are related by the following expression:
| (3) |
where is the gas-to-dust mass ratio, which is typically in the range =100-200 in pPNs. Applying the previous equation, we deduce an average CO abundance of X(CO)(3.3-6.6)10-5, comparable to that inferred from the extinction and the CO model explained above.
5.1 A compact, dusty “cocoon” around the star?
We have estimated the total optical extinction along the line-of-sight towards the central star of M 2-56 (A) from the ratio between the continuum flux observed at a given wavelength () and that expected from the central star in the absence of absorption (). We compute from the observed surface brightness at the nebula center and taking into account the PSF in our observations. On the other hand, has been approximated by the flux (measured on earth) emitted by a black body with an effective temperature of =25,000 K, a total bolometric luminosity of =5500 , and a distance to M 2-56 of =2.1 kpc (§ 1). Considering the values obtained for =1.810-17 erg s-1 cm-2 Å-1 and F6510=410-13 erg s-1 cm-2 Å-1, we infer a value for the total extinction towards the star of A=12 mag. The slope of the continuum emission over the whole wavelength range observed by us in 1998 is indeed very well matched by that predicted by the reddened black body above. The color of the continuum, however, is not compatible with a lower value of A AV 3-4 mag since, in that case, the central star would have to be unreasonably hot (300,000 K), which is totally in contradiction with the low-excitation conditions and lack of substantial photoionization of the optical nebula of M 2-56.
Our value of A is significantly larger than the average nebular extinction implied by the Balmer decrement and also larger than the maximum value deduced from the CO column density under a reasonable assumption of the CO abundace (see § 5). This result is not totally unexpected: the CO model only accounts for the extinction produced by the extended hourglass-like envelope that surrounds the optical lobes, where the H and H emission is locally produced, but does not include the possible attenuation of the stellar radiation produced by a potential/conceivable dusty structure inside the optical lobes and closer to the stellar surface. The absence of scattered continuum along the lobes in 1998 suggests that the light from the star was largely attenuated in that epoch not only along the line-of-sight, as indicated by the large A found, but also along the nebular symmetry axis, i.e. in the direction to the lobes. It is then quite plausible that the structure responsible for the large optical depth towards the star was completely (or almost completely) surrounding the latter in 1998 forming, for example, a dusty ”cocoon” or shell. Since such a cocoon or shell-like obscuring structure is most likely surrounding the close stellar environment and, thus, deep inside the ILs, we derive an upper limit to its radius of 01 (200 AU) from the PSF of our high-angular resolution images.
5.2 Recent decrease of the optical depth towards the star
The remarkable spectral differences observed in 2009 with respect to 1998 and 2000 (§ 3.2.2) signal important physical changes at the core of M 2-56. On the one hand, the recent appearance in 2009 of scattered continuum all along the lobes suggests that: 1) the intrinsic intensity of the stellar continuum has increased; and/or 2) the optical depth of the material (cocoon?) around the star has decreased (at least in the direction to the lobes) leading to a larger fraction of the stellar radiation to escape and to reach the lobes where it is reflected by the dust. This (option 2) would also explain the increment of the scattered (versus locally produced) H emission along the lobes in 2009 and, in particular, the recent brightening of clumps C3 and C3’ evidenced by the direct images (Fig. 1). On the other hand, we have observed a significant brightening of the continuum between 1998 and 2009. In particular, at the nebula center we measure (2009)15(1998). We believe that a true variation of the luminosity or the stellar temperature is very unlikely to be the cause of such brightening. First, an increase of the luminosity would be totally unexpected in the post-AGB phase, which is characterized by a progressive warming of the central star at constant luminosity. Second, only a decrease of the stellar temperature down to 5500-6000 K (at constant luminosity L=5500) combined with an extinction of A=11.7 mag would be able to reproduce the continuum spectrum observed in 2009. Such an extreme cooling of the star, however, would not only be unprecedented but, most importantly, would be inconsistent with a) the presence of a compact circumstellar H II region in 2009, which requires a relatively warm star (20,000 K), and b) the lack of metallic absorption lines typical of a G-type star in the stellar spectrum of M 2-56.
Accordingly, the increase of scattered (continuum and H) emission along the lobes and the brightening of the continuum at the center are both most likely due to a decrease of the optical depth of the circumstellar dust enshrouding the nebula’s core (which includes the star and the compact circumstellar H II region).
Applying the same method and adopting the same value for F6510 as in § 5.1 and taking into account the continuum flux measured in 2009 near H, =2.710-16 erg s-1 cm-2 Å-1 (§ 3.2.2) we deduce a value of A=8.8 mag. Therefore we conclude that the extinction towards the star along the line-of-sight has decreased by 3 mag from 1998 to 2009.
We have also estimated a lower limit to the decrease of the optical depth from the star to the lobes, in particular, to the location of condensation C3 of the eOL (Figs. 1 and 5) from the ratio of the surface brightness of the scattered continuum at that point in 2009 and in 1998. The stellar scattered continuum observed at C3 is attenuated by ) the dust inside the lobes, i.e. from the star to C3 (symbolized as C3), and also by ) the dust between C3 and us along the line-of-sight, i.e. contained in the extended CO envelope that surrounds the optical lobes and in the ISM. However, the extinction produced by the latter components is not expected to vary with time (at least, not in less than 10 yr). In 1998, the continuum is not detected, therefore we use an upper limit given by the rms noise in our spectra (1=3.110-18 erg s-1 cm-2 Å-1 pix-1). In 2009, we measure 1.110-17 erg s-1 cm-2 Å-1 pix-1 at 6510Å. Therefore, we conclude that the extinction from the star in the direction to the lobes has decreased by A1.6 mag from 1998 to 2009.
6 Density and Nebular Mass
6.1 The electron density distribution
We have used the [S II]6716/6731 doublet ratio to estimate the electron density, , along the shocked lobes of M 2-56. In Fig. 10, we plot the spatial profiles along the nebula axis (slit PA90) for the two doublet lines and their ratio obtained from the spectrum observed in 2009 (with the highest S/N ratio and best spatial resolution amongst our multi-epoch data). We have checked that the ratios measured in 1998 and 2000 (not shown here) are roughly consistent with those obtained in 2009 within the observational errors.
The [S II]6716/6731 ratio increases with the axial distance from the nebula center, which implies a decrease of from the center to the outer parts of the lobes, considering the [S II]6716/6731 ratio versus relationship (e.g. Osterbrock & Ferland, 2006) and adopting an average electron temperature = 10,000 K consistent with the estimate by Cohen & Kuhi (1977); Trammell et al. (1993). We derive the largest value of 2104 cm-3 towards the nebula center (within the PSF, i.e. 05), where the high-density limit of the [S II]6716/6731 ratio, 0.4, is reached. Along the ILs, ranges between 2000 cm-3, at the base (05), and 1000 cm-3, at the tips (2″). In the inner regions of the OLs (from 2″ to 3″), the density steeply varies between 1000 and 500 cm-3 and then decreases down to 150 cm-3 at 5″. Beyond these regions the OLs may become more tenuous, if the spatially decreasing trend of is maintained, however, the large data errorbars prevent an accurate determination of the doublet ratio.
The p-v diagram of the two lines of the [S II] doublet and their intensity ratio, which are represented in Fig. 10, provides more details on the distribution of in M 2-56. In particular, unveils the presence of a dense equatorial region at the center (approximately within 1″) with a velocity gradient markedly different from (opposite to) that in the lobes. Such a velocity gradient is indicative of expansive motions in the direction perpendicular to the nebula symmetry axis. The velocity and the density along the equatorial flow are both found to increase with the distance to the center, reaching values of up to 100 km s-1 and 2104 cm-3. (We cannot rule out a radial decrease of the electron temperature being totally or partially responsible for the radial decrease of the [S II]6716/6731 ratio). The center of the expansion may be slightly bluewards of , at 60 km s-1.
Finally, we have estimated a lower limit to the density of the region/wind responsible for the transient feature F1 observed in the H profile (and, to a lesser extent, the [N II]6548,6584Å doublet) in 1998. We believe that the most likely reason why feature F1 had vanished in 2000 is that the material ejected during the H-emission burst had become fully (or almost fully) recombined in the time span between our runs #1 and #2, i.e. in just 2.9 yr or less. This enables estimating a lower limit to the average density in the fast F1-wind in 1998 of 2.6104 cm-3 using the expression for the recombination time scale, , as a function of the density given by Kwok (2000): yr. Such a value of the density, relatively high, is consistent with feature F1 not being present in the [S II] spectrum: given the critical density of the lines in the doublet these transitions would be significantly suppressed by collisional de-excitation in high-density regions. The lines of the [N II] doublet have larger critical densities, few104 cm-3, that is why the F1-wind is traced by these transitions.
6.2 Atomic and Ionized Mass
We have estimated the total mass of atomic and ionized gas, and , in the lobes of M 2-56 using the mean electron densities derived above and the total energy radiated by [O I]6300 and H, respectively. The [O I] (H) intensity is proportional to the product of and the H (H+) number density, assuming that the transitions are optically thin and that the electron temperature does not strongly vary within the emitting region. Considering a mean electron temperature in the shocked lobes of Te=10,000 K (Cohen & Kuhi, 1977; Trammell et al., 1993), relative abundances of He/H = 0.1 and O/H= 410-4 and the required atomic parameters (see e.g. Mendoza, 1983; Gurzadyan, 1997) we derive:
| (4) |
| (5) |
where is the dereddened luminosity of the line (and we have adopted =2100 pc). Note that Eq. (4) is valid for electron densities smaller than the critical density of [O I], cm-3, which is the case for M 2-56. On the other hand, this equation only provides a lower limit of the total atomic mass (, which includes the He contribution), since we are assuming that most of the oxygen is neutral and in the ground state. Also, we note the dependence of the mass derived using Eq. (4) on Te as . In deriving Eq. (5) we have assumed that the majority of the electrons in the nebula come from H+, i.e., , and the classic radiative recombination case b for 10,000 K (i.e. z3=/=0.2510-20 cm3, where is the population of the level of H; Gurzadyan, 1997).
We have separately estimated the masses of the OLs and ILs using the line fluxes integrated within each component and using Eqs. (4) and (5). We have also estimated in the F1-wind calculating the flux in the feature F1 computed as the difference between the H fluxes measured in 1998 and 2000. To derive the total mass in the extended OLs we have used the fluxes in Table 3 multiplied by a factor 3, which converts the flux within a 1″-wide slit to total nebular flux (estimated from the direct and ground-based images, Fig.1). We assume, however, that the compact ILs and wind-F1 lie completely within our 1″-wide slit. Our results are given in Table 3 together with the average values of the extinction and electron densities used for each nebular component (estimated in § 5 and § 6.1). For the F1-wind our value of the ionized mass is particularly uncertain since the density and the extinction are poorly known in this case. The extinction by which the flux in the F1 feature needs to be corrected for could be of up to 12, if it is extinguished similarly to the central star, or 3, if it is extinguished similarly to the ILs. Given the angular size of the F1-emitting region (05), which is larger than that inferred for the cocoon around the nebula’s core (01, § 5.1), we favor a moderate extinction (i.e. closer to 3) for this component. Given the lower limit to , we calculate an upper limit to the mass of the F1-wind of 410-6 .
We have also estimated the mass of ionized material in M 2-56 geometrically, using the mean electron densities and the volume of the shocked lobes directly measured from the images, assuming a simplistic spherical geometry for the lobes. We have separately considered the case of hollow lobes and lobes uniformly filled with gas. Assuming hollow lobes with 02-thick walls, the ionized mass of the ILs and OLs is 710-5 and 610-4, respectively. These values are consistent with those previously obtained from the H luminosity (Table 3). For the adopted values of the mean electron density and taking into account the limitations of our necessarily simplistic assumptions made to derive the mass, the thin-walled lobes scenario seems to be a better approximation to the structure of the lobes of M 2-56 than the filled-lobes geometry: for the latter, the derived masses systematically exceed those obtained from the H luminosity. We note that the limb-brightnening of the ILs and, to a lesser extent, the OLs observed in the images support the hypothesis of relatively thin-walled lobes.
7 Discussion: formation and evolution of M 2-56
We interpret the nebular morphology and kinematics of M 2-56 in the context of the AGB-to-post-AGB wind interaction scenario, i.e., resulting from the hydrodynamical interaction between fast, collimated (jet-like) post-AGB ejections and the slowly expanding envelope expelled during the previous AGB phase (see § 1). The remarkable “lobe inside a lobe” appearance of M 2-56 together with the discovery of the recent H emission burst, and the revelation of other very small-scale structures at the nebula’s core points to multiple episodes of mass outflow during the post-AGB phase.
The earliest post-AGB mass-loss event in M 2-56 (that we have knowledge of from existing data) is probably the one that shaped and accelerated the extended hourglass-like molecular outflow enclosing the optical nebula (§ 1). As discussed by Castro-Carrizo et al. (2002), such an interaction started approximately 1400 yr ago and took place quickly, in less than 300 yr (see also Bujarrabal et al., 2001). The smaller kinematical ages of the optical OLs and ILs derived from our long-slit spectra, 380 and 40 yr, respectively, suggest that the latter resulted from two consecutive and more recent post-AGB ejections. The duration of such ejections cannot be asserted based on our data but it may be a small fraction of their kinematical ages as in the case of the fast molecular outflow. We find that the caps of the optical OLs, which are located inmediately behind of two diametrally oposed dense axial clumps traced by CO, show a different kinematics than the main body of the OLs. In particular, the OLs-caps are characterized by expansion velocities close to those of the aforementioned CO condensations. The kinematical age derived for the OLs-caps, 1200 yr, is thus similar to that of the CO axial clumps, which may suggest that both were shaped and accelerated in the same wind interaction process between the primer post-AGB bipolar flow(s) and the AGB envelope. In this scenario, the massive molecular envelope would be mainly composed of shocked-AGB wind whereas the OLs-caps could be a remnant of the primer post-AGB wind. Alternatively, the material in the OLs-caps could have been ejected at the same time as the rest of the OLs, i.e. 380 yr ago, and subsequently decelerated (from expansion speeds of 400km s-1 down to the observed velocities in these regions, 110km s-1) as a consequence of its interaction with the pre-existing CO clumps. The fast ILs probably trace a more recent shock interaction between an ensuing, fast post-AGB wind with the material at the base of the pre-existing and slower OLs.
Our data also uncover a dense equatorial structure at the nebula center that is expanding in the direction perpendicular to the lobes with radial velocities of up to 100 km s-1 (§ 6.1 and Fig. 10). The velocity gradient observed, which is approximately linear, indicates a kinematical age of 300-400 yr (adopting =90°18°=72°). The similar age of the equatorial flow and the OLs is consistent with both components resulting from a single, sudden mass-ejection event that took place simultaneously along the nebula axis and in the perpendicular plane. This scenario has been proposed previously by Alcolea et al. (2007) to explain the radial acceleration along the equator and bipolar flows of the molecular envelope of the pPN M 1-92. In M 2-56, the compact equatorial structure unveiled by the [S II] doublet may represent the inner (warmer) regions of the dense, molecular ring/torus probed by CO emission (§ 1). The lower expansion velocity of the latter (=7-8 km s-1) may indicate substantial deceleration of the equatorial flow after interaction with the dense, slow AGB envelope. The density is found to increase outwards along the optical equatorial flow, in support of the presence of compressed (swept up) material at the boundary with the dense molecular torus.
The discovery of the H emission burst from the nebular core in 1998 (feature F1) brings to light a latter stellar wind. As discussed in § 4.3, the F1-emitting wind is probably bipolar. The linear size and mean expansion velocity of this fast, compact flow allow us to derive an upper limit to its kinematical age of only 14 yr. The upper limit arises because of possible deceleration of the F1-wind by interation with the ILs. The absence of feature F1 in the H spectrum obtained in 1989 by G91, in fact, suggests that the F1 wind could have been ejected only 10 yr before it was first identified in our run #1. In this case, the initial expansion speed of the F1-wind (before substantial deceleration took place) should have been 500km s-1 to explain the axial extent of this component. This value of is indeed in agreement with that inferred from the broad wings and the P-cygni absorption component of feature F1, which indicate that a fraction of the F1-flow is actually moving at this relatively large speeds (§ 4.3).
The absence of feature F1 in 2000 is probably due to fast recombination of the gas in the dense (2.6104 cm-3) F1-wind (§ 6.1). In order for the F1-wind to be completely or considerably neutral already in 2000, most of it should have been far away (detached) from the central star at that time, otherwise one would expect to observe emission from the dense photoionized material at the base of the wind close to the stellar surface as long as the wind is on-going. We conclude, therefore, that the rapid recombination observed, in less than 3 yr, is most consistent with the F1-wind being a short-time duration event, e.g. a pulsed-jet or bullet-type ejection, leading to detached or clumpy structures, rather than being blown in a continuous way. We believe that the clumpy, jet-like structures observed in the direct images of M 2-56 at the base of the eIL could represent the footprints of such a fast F1-wind. This is based on the similar size and location of both structures in the images and the spectra. If this is correct, the emission that we see from the prominent three-finger like structure in the F606W image must be mainly stellar light by the F1-wind, after recombination, since that image was obtained in 2002 once the H emission feature F1 had dissapeared.
We have estimated a lower limit to the mass-loss rate that led to the main nebular components identified in our optical imaging and spectroscopic data, namely, the OLs, the ILs and the F1-wind, from the ratio between the total mass contained in each component and their kinematical ages (Table 3). The lower limit arises because the duration of each of the multiple post-AGB mass-loss episodes undergone by M 2-56 could be shorter than their kinematical ages. We obtain very similar values of the mass-loss rate for the OLs and ILs, namely, OLs210-6 and ILs310-6 yr-1. For the F1-wind, we compute a value of F1410-7 yr-1, however, we note the larger uncertainties in this case mainly due to our vague estimate of the mass of the F1-wind. We have attempted a different estimate of the mass-loss rate of the F1-wind as given by , where the geometry of the F1-wind is approximated by a cylindrical structure with radius , density , and expanding at . Adopting 005, 3104 cm-3 and 500 km s-1, we derive F1410-7 yr-1. The radius adopted for the F1-wind is that of the bright, jet/finger-like features in the F606W images that may be footprints of the F1-wind. The agreement between our two estimates of F1 suggests that the order of magnitude obtained may be correct.
In general, very little is known about mass-loss rates of post-AGB winds, their continuous or episodic nature, and about the structure of the resulting flows after the AGB-to-’post-AGB’ wind interaction. Our data indicate that the various post-AGB mass-loss episodes experienced by M 2-56 did not happen at regular time intervals, in particular, the time span between two consecutive post-AGB ejections has shortened with time. Also, according to the different expansion velocities of the distinct nebular components of M 2-56, including the molecular envelope, the succesive post-AGB winds seem to be characterized by ejection speeds exponentially increasing with time. It is also worth mentioning that, unlike most pPNs and PNs with multiple optical lobes, the OLs and the ILs of M 2-56 are oriented almost identically (with their main symmetry axis inclined with respect to the line-of-sight by =18°; § 4.1). Since the molecular envelope has also a similar orientation, we conclude that the different post-AGB bipolar ejections in this object (except maybe for the F1-wind) have taken place along the same (or nearly the same) direction/axis over the last 1400 yr. We note that, in contrast, signatures of significant jet directional changes are common amongst pPNs and PNs (e.g. Miranda et al., 1999; Sahai et al., 2007, and references therein). Another example of directionally stable jets is found in the PN He 2-90 (Guerrero et al., 2001).
We have obtained a rough estimate of the scalar linear momentum carried by the bipolar OLs, the ILs, and the F1-wind from the product of their masses (Table 3) by their maximum expansion velocities, which have been taken to be 250, 350, and 500 km s-1, respectively. In this calculation we assume that the nebular components are elongated structures with a velocity field that is mainly axial (§ 4.2). The values found (0.17 km s-1 0.05 km s-1 210-3 km s-1) are orders of magnitude smaller than the momentum carried by the molecular outflow, 10 km s-1 (in deriving this value, the linear momentum computed by Castro-Carrizo et al., 2002, 2 km s-1, has been corrected for our lower estimate of the CO-to-H2 molecular abundance – see § 5). According to this, we must conclude that none of the post-AGB ejections probed by our optical data could have transferred its large linear momentum to the CO outflow and, therefore, a primer more energetic post-AGB ejection is necessary to explain the dynamics of the molecular envelope. This result is in good accordance with the time decreasing trend of the linear momentum of the optical nebular components inferred by us (), which independently suggest (by extrapolation) that earlier post-AGB flows could have carried a larger linear momentum.
The presence of a compact dusty structure and a nuclear H II region unveiled by our data (§ 5.1 and 4.4) show evidence of further post-AGB mass-loss after the F1-wind in M 2-56. The decrease of the optical depth along the line-of-sight and along the nebular symmetry axis observed (§ 5.2) is consistent with a detached/shell-like (cocoon?) structure moving away from the central star. Assuming that the cocoon expands at constant velocity, , and that the density varies with the radial distance to the star as (i.e. the mass-loss rate is constant), it can be easily demonstrated that for a thick and a thin shell-like geometry:
| (6) | |||
| (7) |
where is the inner and mean radius of the thick and thin cocoon, respectively, in 1998, () is the column density in 1998 (2009), and is the time scale of the variation of the optical depth. In 1998 and 2009, the total extinction towards the star was A=12 mag and 8.8 mag, respectively (§ 5.2). Subtracting the component of the extinction produced by the CO envelope and the ISM at the center, 3 mag, we estimate that the -band extinction produced by the cocoon was A=12-3=9 mag in 1998 and A=8.8-3=5.8 mag in 2009. Since the extinction is proportional to the column density, we find =9/5.8=1.55. Adopting 01 (3.141015 cm, § 5.1) and 10 yr, the variation of the optical depth observed can be explained for moderate expansion velocities of the cocoon of 30 and 60 km s-1 for the thin and thick shell approximation, respectively.
In the previous expanding cocoon scenario, the detached geometry (needed to explain the decrease of the optical depth) implies that the mass-loss process that led to this structure had already ended in 2009. The compact size of the cocoon, which is well inside the ILs and plausibly closer to the star than the F1-wind, suggest it is at least as young as the latter (i.e., 10 yr). Adopting an expansion velocity of =500 km s-1 as for the F1-wind, which is not unreasonable given the increasing trend of the expansion velocity of the multiple post-AGB winds of M 2-56, we obtain 2 yr.
The presence of compact cocoons enshrouding the central source has been suggested in several pPNs. For example, the so-called searchlight beam features that are observed emerging from the nebular core in an increasing number of pPNs and PNs (of which CRL 2688 remains as the best known example) have been hypothesized to result from starlight escaping through holes/cavities in an inner dust cocoon (Sahai et al., 1998; Sánchez Contreras et al., 2007). Since these cocoons have not been directly detected, their existence remains speculative so far. We cannot rule out that the large obscuration of the central source of M 2-56 both along the lobes and the equatorial plane could also be produced by two distinct nebular components, namely, a dusty bipolar flow and an equatorial disk/torus, rather than by a unique cocoon-like structure. Direct observations of the obscured, innermost regions of M 2-56 using, for example, high-angular resolution techniques in the infrarred and mm-wavelength range are crucial to characterize the circumstellar geometry at the nebula’s heart.
Finally, our spectra taken in 2009 have revealed a compact H II region around the central star of M 2-56 that may represent the very latest (current?) mass-loss episode of this object. It is possible that such a compact H II region was already formed in 1998 but its light, like the stellar radiation, was heavily blocked from our view by the dusty cocoon. Only due to the recent decrease of the optical depth of the latter, the emission from the H II region has been able to reach the lobes where it is scattered by the nebular dust, enabling its indirect detection. Alternatively, it is also possible that the H II region has formed recently (after 2000). In the following, we discuss this possibility in some detail. The recent formation of the H II region would imply an equally recent and rapid evolution (in less than 10 yr) of the central star towards higher effective temperatures, needed to explain the raise of photonionizing UV radiation and detectable H emission from the ionized regions. Although a large increase of is not deduced from our multi-epoch spectroscopic data, which do not show significant changes in the stellar spectrum666except for its brightening as a result of the decrease of the cocoon optical depth – see § 5., a low/moderate increase of the stellar temperature from a B 0.5 to a B 0 spectral type (3000 K) is simultaneously consistent with a stable B-type classification and with a large increase of the H equivalent width from =50 to 300Å (for details, see Sánchez Contreras et al., 2008). The evolutionary rate value deduced in this case, /t3000/10300 K yr-1, is larger than that expected for the central star of M 2-56 based on theoretical evolutionary models for post-AGB objects taking into account the low luminosity and, thus, initial mass of this object (e.g. Bloecker, 1995; van Hoof et al., 1997). However, these models assume constant values for the post-AGB mass-loss rate of 10-7-10-8 yr-1, single-star evolution scenarios, and other simplifying hypothesis that may not be appropriate for M 2-56. In particular, we do not rule out that the lattest sudden mass ejections leading to the F1-wind and the compact cocoon, could have sped up/boost the evolution of the central star towards slightly higher and the recent emergence of a nuclear H II region in just a few years.
In addition to the central H II region, there are probably shocks currently happening at the innermost circumstellar regions of this fascinating object as evidenced by the recent emergence of Fe II lines from the nucleus (§ 3.2.2). These Fe II lines are known to be good tracers of astrophysical shocks, e.g., in supernovae, Herbig Haro objects, PNe, etc (e.g. Welch et al., 1999; Reipurth et al., 2000). The presence of shocks at the nebula’s core suggests current, fast stellar ejections (in agreement with the broad nuclear H profile) interacting hydrodynamically with the material in the close environment of the star ejected in earlier mass-loss episodes with smaller velocities. High-angular resolution optical imaging and spectroscopy are needed to properly study the spatio-kinematic structure of the innermost nebular regions and to attempt understanding the complex mass-loss history of the latest post-AGB ejections in M 2-56.
8 Summary
We report multi-epoch long-slit spectra at various slit positions and direct images in the optical of the pPN M 2-56. These data have allowed us to describe the spatio-kinematic structure and complex (currently active?) mass-loss history of this object with unprecedented detail.
-
-
Our data probe several nebular components, namely, two pairs of nested, co-axial lobes with different sizes and a large contrast in surface brightness referred to as the faint outer lobes (OLs) and the bright inner lobes (ILs), a compact bipolar flow (the F1-wind), and an equatorially expanding central structure. A compact circumstellar structure obscuring the star (cocoon?) and a nuclear H II region, both spatially unresolved, are also inferred from our data.
-
-
The optical lobes are oriented along the East-West direction (PA=90°) and their symmetry axis is inclined 18° (with respect to the plane of the sky), similarly to the hourglass-shaped molecular envelope that surrounds the optical nebula (Castro-Carrizo et al., 2002).
-
-
The OLs and the ILs have an overall axial symmetry and are characterized by an expansive kinematics with the velocity increasing with the distance to the nebula center, except for the outermost OLs-caps, which show reduced speeds relative to their innermost regions. The maximum velocity reached by the OLs (ILs) is 250 km s-1 (350 km s-1). Consistent with the large speeds observed at the tips of the ILs, we measure proper motions (003 yr-1) by comparing two-epoch images.
-
-
In 1998, we detected a burst of H emission from the nebula nucleus (referred to as “feature F1”) that has vanished in less than 2.9 yr. We believe that feature F1 arises in a dense, fast (350-500 km s-1) bipolar wind ejected after 1989 as a short-time mass-loss event.
-
-
The mass in the OLs, ILs, and F1-wind is 7 , 1.2 , and 4 , respectively.
-
-
The p-v distribution of the [S II]6716/6731 line ratio has led to the discovery of a dense (104 cm-3), equatorial flow. The radial velocity increases approximately linearly with the distance to the center, reaching values of up to 100 km s-1. It is possible that the equatorial flow and the OLs both resulted from a single, sudden mass-loss event that took place simultaneously along the axis and in the perpendicular plane.
-
-
We infer the presence of a compact (200 AU), dusty structure (cocoon?) enshrouding the central star. The optical depth of this structure has decreased a few magnitudes both along the line-of-sight and along the optical lobes in 10 yr. This has enabled a fraction of the light from the nebula’s core to escape the stellar vicinity and reach the lobes where it is scattered off by nebular dust, leading to a brightening of the scattered stellar continuum and the increase of scattered H emission along the lobes in 2009.
-
-
The scattered H emission detected in 2009 along the lobes arises most likely from a compact H II region around the star.
-
-
In 2009, we have discovered a number of permited emission lines arising from the nucleus. The detection of Fe II lines suggests the presence of shocks at the stellar neighborhood resulting from current stellar wind activity.
-
-
The kinematical ages of the main nebular components of M 2-56 are different from each other: 1400 yr for the molecular bipolar flow, 300-400 yr for the OLs and the equatorial flow, 40 yr for the ILs, 10 yr for the F1-wind, and even smaller for the compact cocoon and H II region.
-
-
The rapid evolution of M 2-56 is driven by multipe episodes of mass ejection, that is, through a gusty or episodic post-AGB wind, that has led to the nested bipolar morphology of the nebula and the younger nuclear components discovered in this work. The duration of each of such ejections may be a small fraction of its kinematical age, which implies extremely short life-times, of a few years or less, for some of the mass-loss episodes in M 2-56.
-
-
The various post-AGB mass ejection events experienced by M 2-56 did not happen at regular time intervals, in particular, the time span between two consecutive post-AGB ejections has shortened with time.
-
-
The successive multiple post-AGB winds in M 2-56 are characterized by ejection speeds increasing with time from 200 to 500 km s-1. In contrast, the mass-loss rate and linear momentum may show a time decreasing trend. None of the post-AGB ejections probed by our optical data could have transferred its large linear momentum to the molecular outflow (10 km s-1) and, therefore, a primer more energetic post-AGB ejection is necessary to explain the dynamics of the molecular envelope.
In summary, the data presented here indicate that we are witnessing the current, variable wind activity at the core of M 2-56 and the rapid evolution of the shocked nebular material in very short time scales. This makes of M 2-56 a unique object for studying the yet poorly known processes responsible for nebular post-AGB evolution through follow up studies. New hydrodynamical symulations of the AGB-to-’post-AGB’ wind interaction using input parameters for the post-AGB wind in accordance with observational properties deduced from this work may be very useful for improving our understanding of PN/pPN shaping and evolution. For example, post-AGB winds in the form of a series of sudden, short-lived ejection events (not necessarily regularly spaced in time) should be considered. Also, models should allow for time variations not only in the velocity of the fast wind but also in its mass-loss rate and linear momentum.
References
- Aaquist & Kwok (1990) Aaquist, O. B., & Kwok, S. 1990, A&AS, 84, 229
- Alcolea et al. (2007) Alcolea, J., Neri, R., & Bujarrabal, V. 2007, A&A, 468, L41
- Balick & Frank (2002) Balick, B., & Frank, A. 2002, ARA&A, 40, 439
- Bloecker (1995) Bloecker, T. 1995, A&A, 299, 755
- Bujarrabal et al. (2001) Bujarrabal, V., Castro-Carrizo, A., Alcolea, J., & Sánchez Contreras, C. 2001, A&A, 377, 868
- Cardelli et al. (1989) Cardelli, J. A., Clayton, G. C., & Mathis, J. S. 1989, ApJ, 345, 245
- Castro-Carrizo et al. (2002) Castro-Carrizo, A., Bujarrabal, V., Sánchez Contreras, C., Alcolea, J., & Neri, R. 2002, A&A, 386, 633
- Cohen & Kuhi (1977) Cohen, M., & Kuhi, L. V. 1977, PASP, 89, 829
- Cox et al. (2000) Cox, P., Lucas, R., Huggins, P. J., Forveille, T., Bachiller, R., Guilloteau, S., Maillard, J. P., & Omont, A. 2000, A&A, 353, L25
- Goodrich (1991) Goodrich, R. W. 1991, ApJ, 376, 654 (G91)
- Guerrero et al. (2001) Guerrero, M. A., Miranda, L. F., Chu, Y.-H., Rodríguez, M., & Williams, R. M. 2001, ApJ, 563, 883
- Gurzadyan (1997) Gurzadyan, G. A. 1997, The Physics and Dynamics of Planetary Nebulae, Springer-Verlag Berlin Heidelberg New York. Also Astronomy and Astrophysics Library.
- Hartigan et al. (1987) Hartigan, P., Raymond, J., & Hartmann, L. 1987, ApJ, 316, 323
- Hartigan et al. (1994) Hartigan, P., Morse, J. A., & Raymond, J. 1994, ApJ, 436, 125
- Imai et al. (2002) Imai, H., Obara, K., Diamond, P. J., Omodaka, T., & Sasao, T. 2002, Nature, 417, 829
- Imai (2007) Imai, H. 2007, IAU Symposium, 242, 279
- van Hoof et al. (1997) van Hoof, P. A. M., Oudmaijer, R. D., & Waters, L. B. F. M. 1997, MNRAS, 289, 371
- Howarth (1983) Howarth, I. D. 1983, MNRAS, 203, 301
- Kwok (2000) Kwok, S. 2000, The origin and evolution of planetary nebulae / Sun Kwok. Cambridge ; New York : Cambridge University Press, 2000. (Cambridge astrophysics series ; 33)
- Mendoza (1983) Mendoza, C. 1983, IAU Symp. 103: Planetary Nebulae, 103, 143
- Miranda et al. (1999) Miranda, L. F., Guerrero, M. A., & Torrelles, J. M. 1999, AJ, 117, 1421
- Miranda et al. (2006) Miranda, L. F., Ayala, S., Vázquez, R., & Guillén, P. F. 2006, A&A, 456, 591
- Osterbrock & Ferland (2006) Osterbrock, D. E., & Ferland, G. J. 2006, Astrophysics of gaseous nebulae and active galactic nuclei, 2nd. ed. by D.E. Osterbrock and G.J. Ferland. Sausalito, CA: University Science Books, 2006,
- Raymond (1979) Raymond, J. C. 1979, ApJS, 39, 1
- Reipurth et al. (2000) Reipurth, B., Yu, K., Heathcote, S., Bally, J., & Rodríguez, L. F. 2000, AJ, 120, 1449.
- Riera et al. (2006) Riera, A., Binette, L., & Raga, A. C. 2006, A&A, 455, 203
- Sahai & Trauger (1998) Sahai, R., & Trauger, J. T. 1998, AJ, 116, 1357
- Sahai et al. (1998) Sahai, R., et al. 1998, ApJ, 493, 301
- Sahai et al. (2007) Sahai, R., Morris, M., Sánchez Contreras, C., & Claussen, M. 2007, AJ, 134, 2200
- Sánchez Contreras et al. (2008) Sánchez Contreras, C., Sahai, R., Gil de Paz, A., & Goodrich, R. 2008, ApJS, 179, 166
- Sánchez Contreras et al. (2007) Sánchez Contreras, C., Le Mignant, D., Sahai, R., Gil de Paz, A., & Morris, M. 2007, ApJ, 656, 1150
- Sánchez Contreras et al. (2002) Sánchez Contreras, C., Sahai, R., & Gil de Paz, A. 2002, ApJ, 578, 269
- Sánchez Contreras & Sahai (2001) Sánchez Contreras, C., & Sahai, R. 2001, ApJ, 553, L173
- Sánchez Contreras et al. (2000) Sánchez Contreras, C., Bujarrabal, V., Miranda, L. F., & Fernández-Figueroa, M. J. 2000, A&A, 355, 1103
- Siódmiak et al. (2008) Siódmiak, N., Meixner, M., Ueta, T., Sugerman, B. E. K., Van de Steene, G. C., & Szczerba, R. 2008, ApJ, 677, 382
- Solf (2000) Solf, J. 2000, A&A, 354, 674
- Suárez et al. (2009) Suárez, O., Gómez, J. F., Miranda, L. F., Torrelles, J. M., Gómez, Y., Anglada, G., & Morata, O. 2009, A&A, 505, 217
- Trammell et al. (1993) Trammell, S. R., Dinerstein, H. L., & Goodrich, R. W. 1993, ApJ, 402, 249
- Ueta et al. (2007) Ueta, T., Murakawa, K., & Meixner, M. 2007, AJ, 133, 1345
- Velázquez et al. (2004) Velázquez, P. F., Riera, A., & Raga, A. C. 2004, A&A, 419, 991
- Welch et al. (1999) Welch, C. A., Frank, A., Pipher, J. L., Forrest, W. J., & Woodward, C. E. 1999, ApJ, 522, L69.
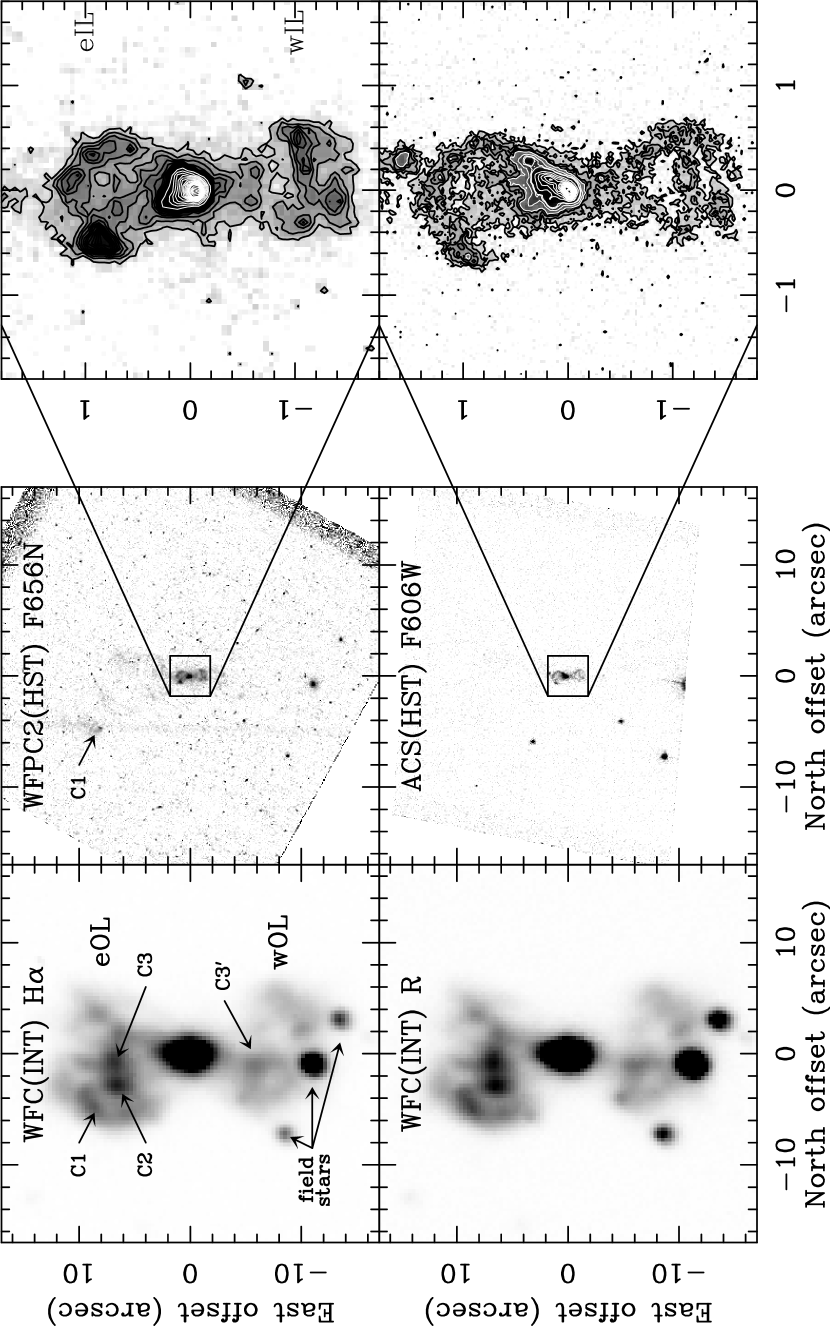
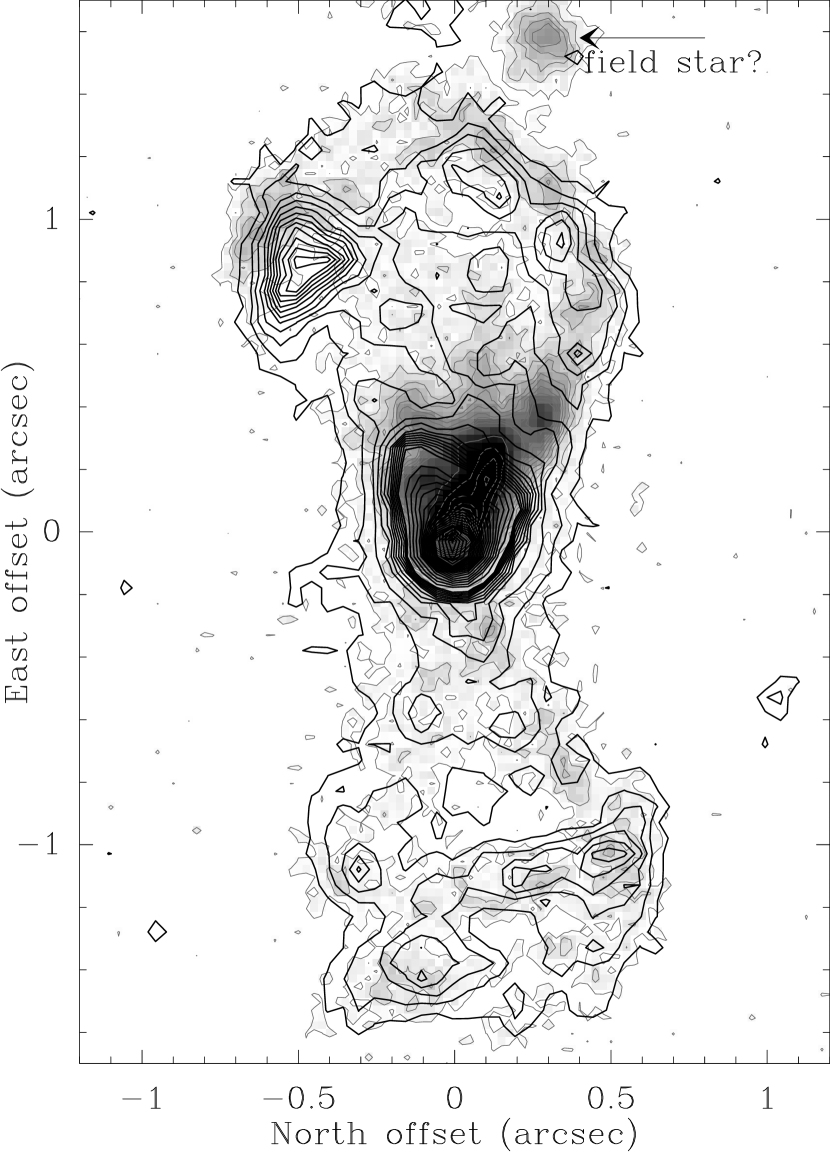
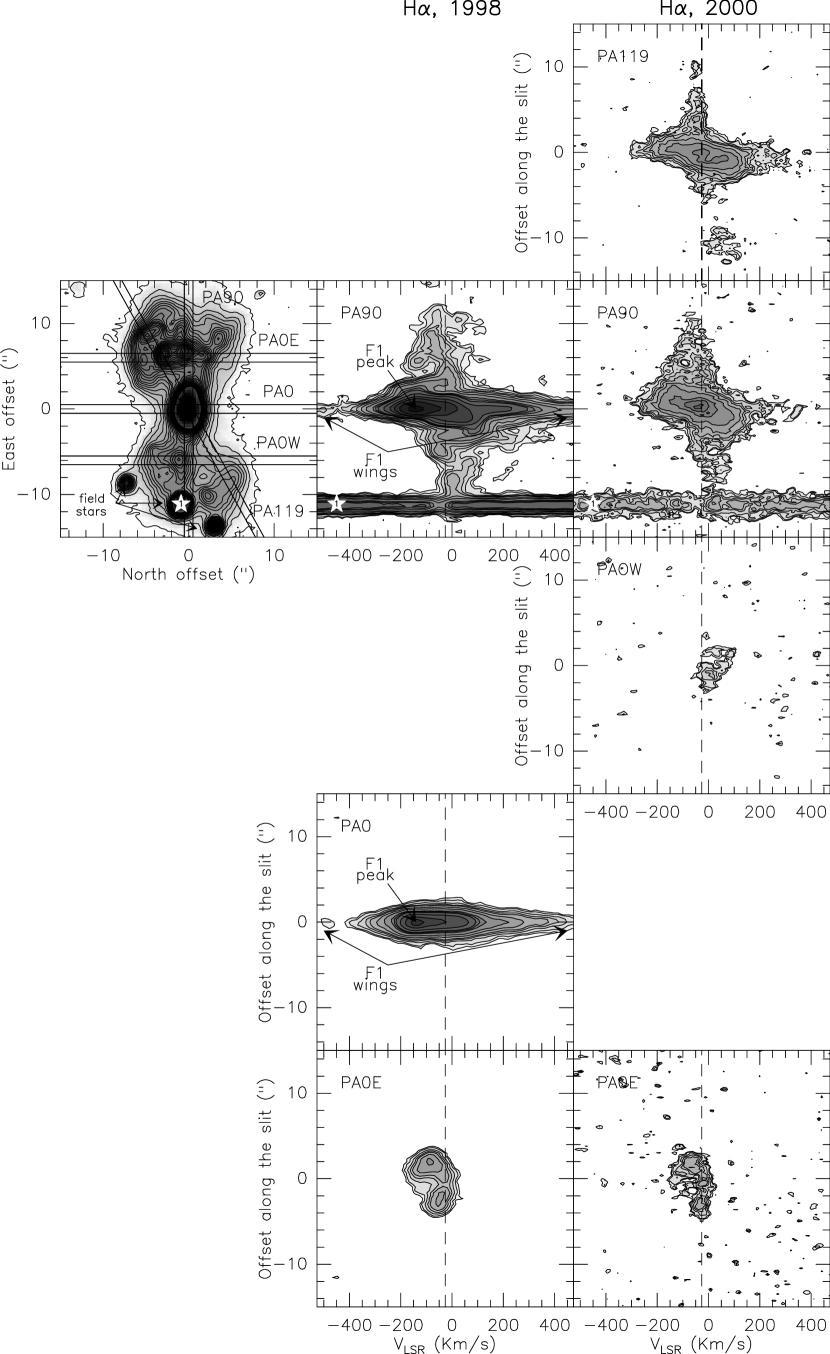

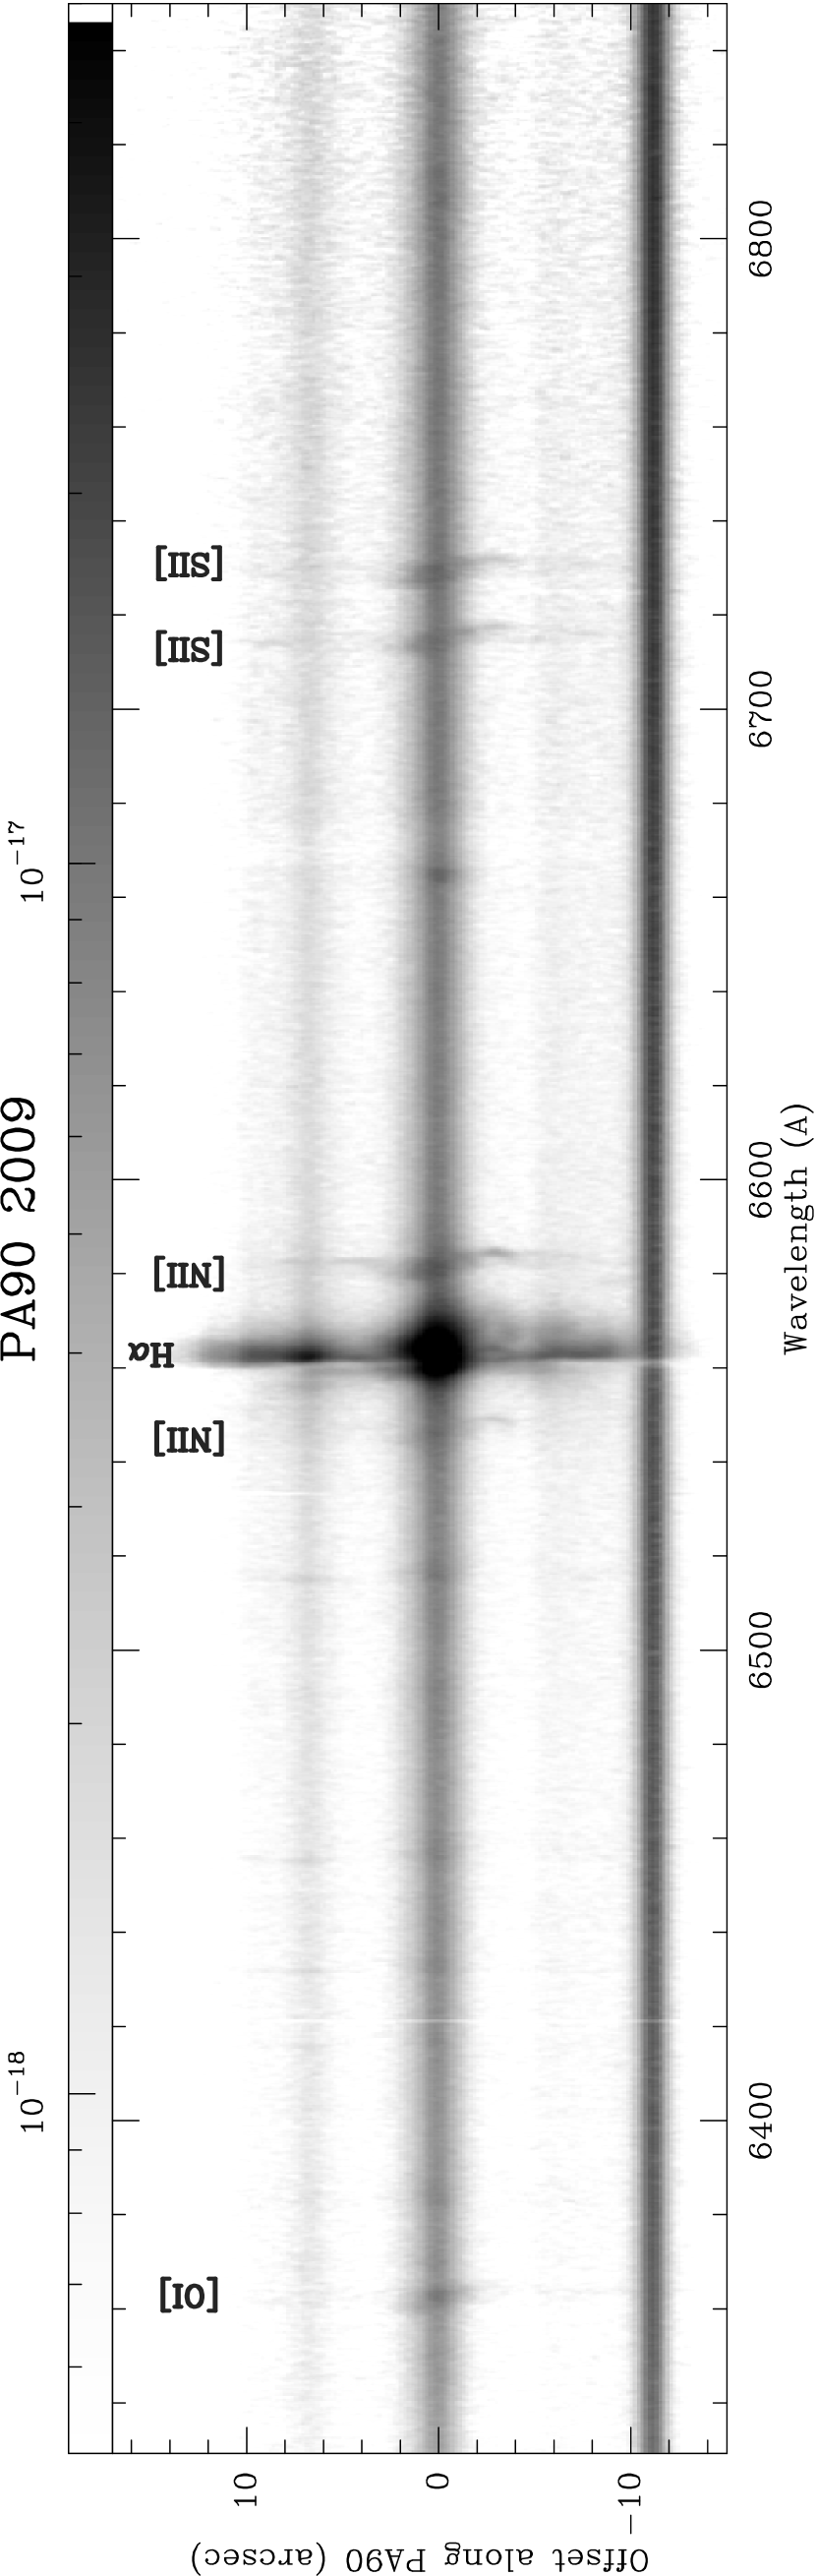
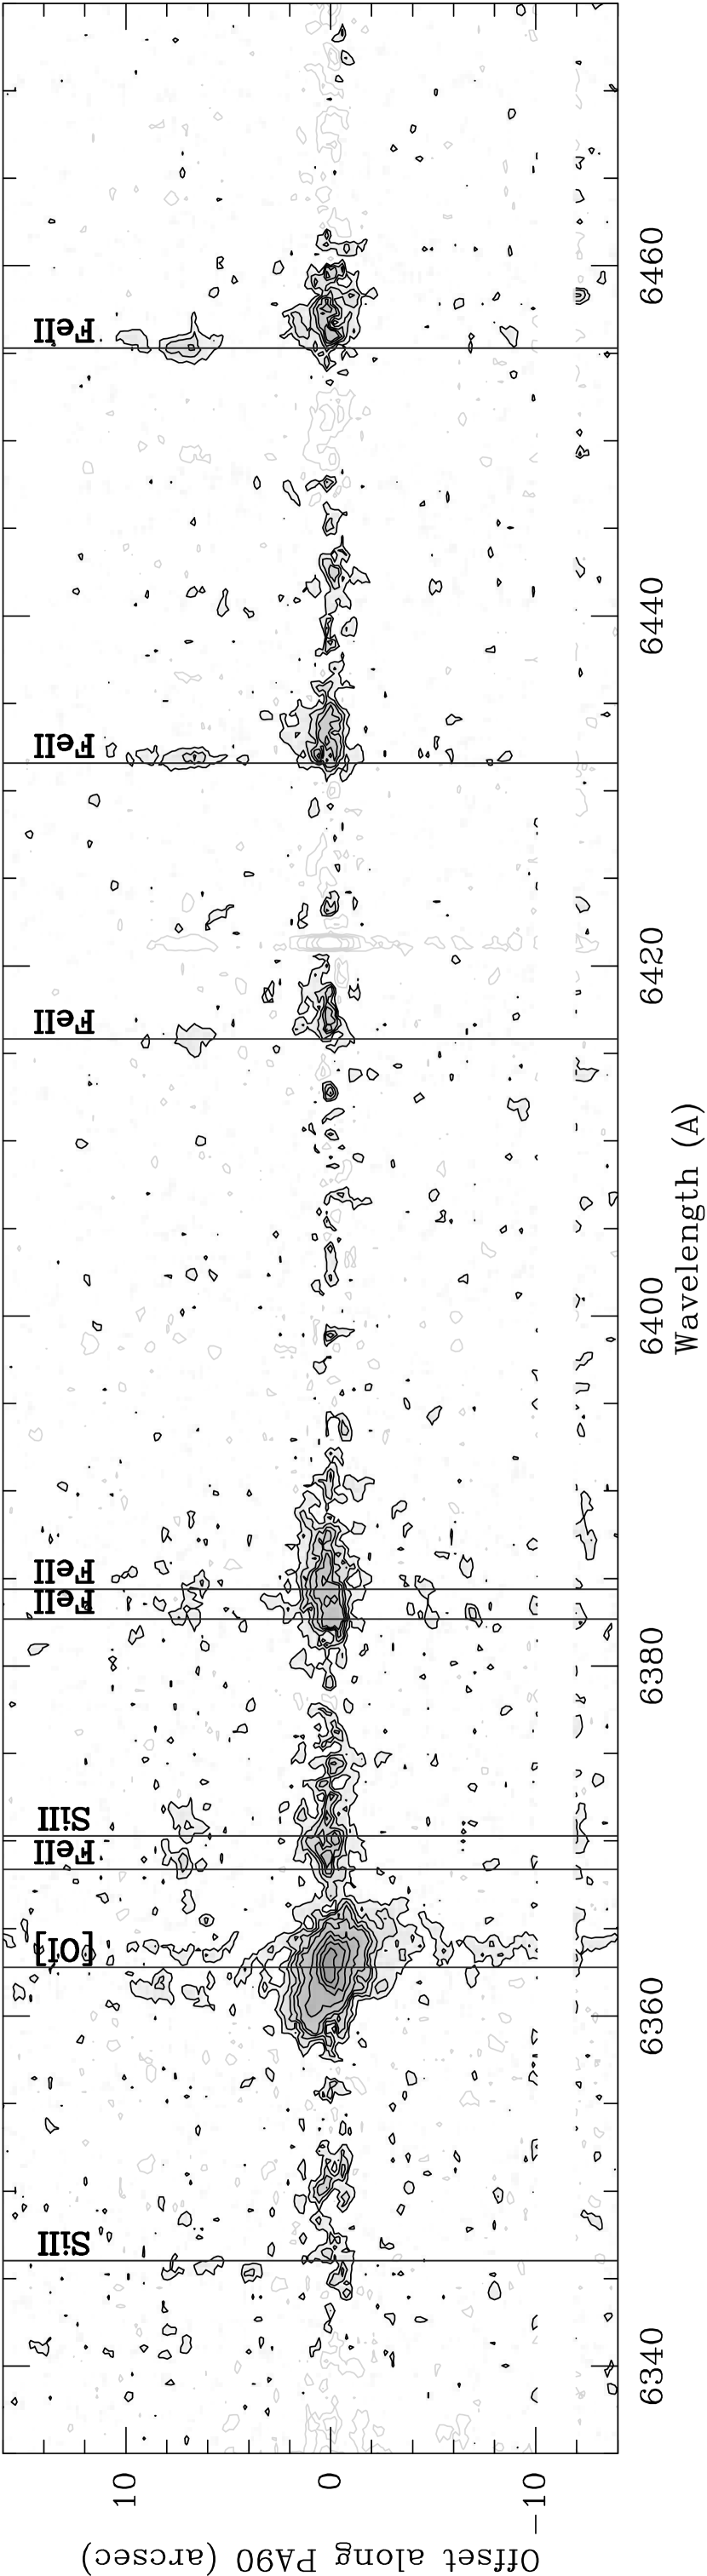
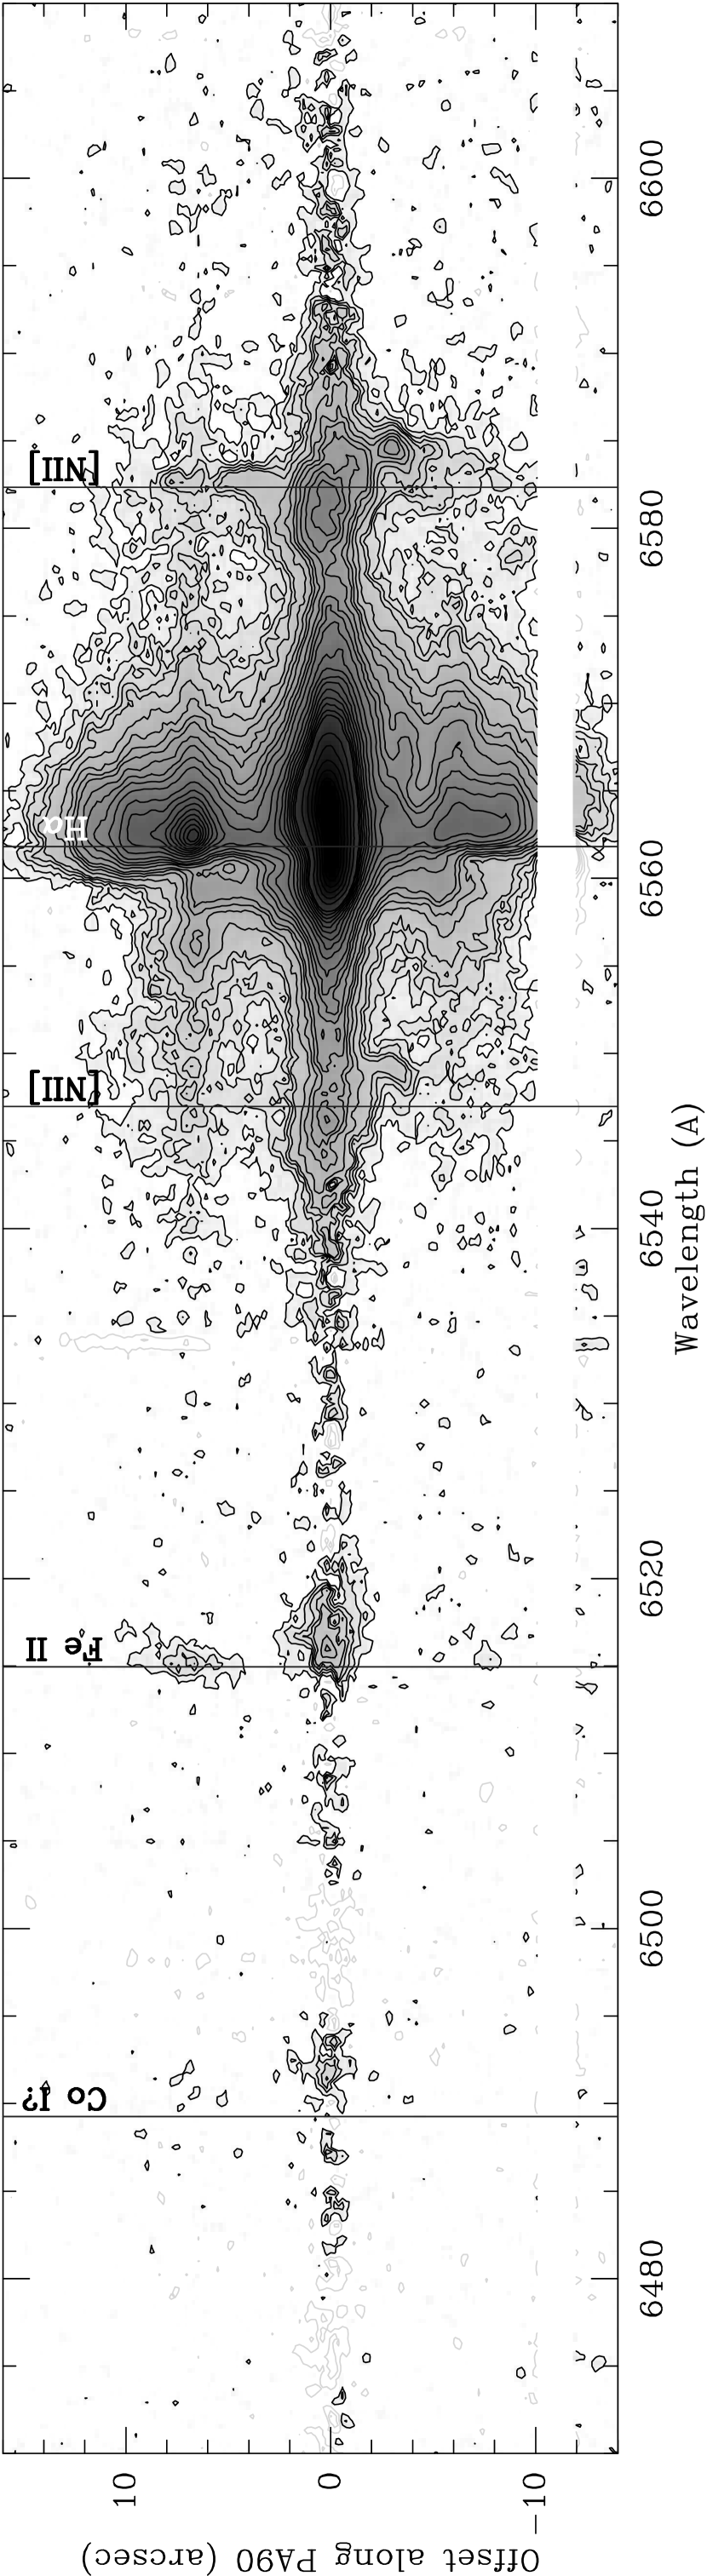
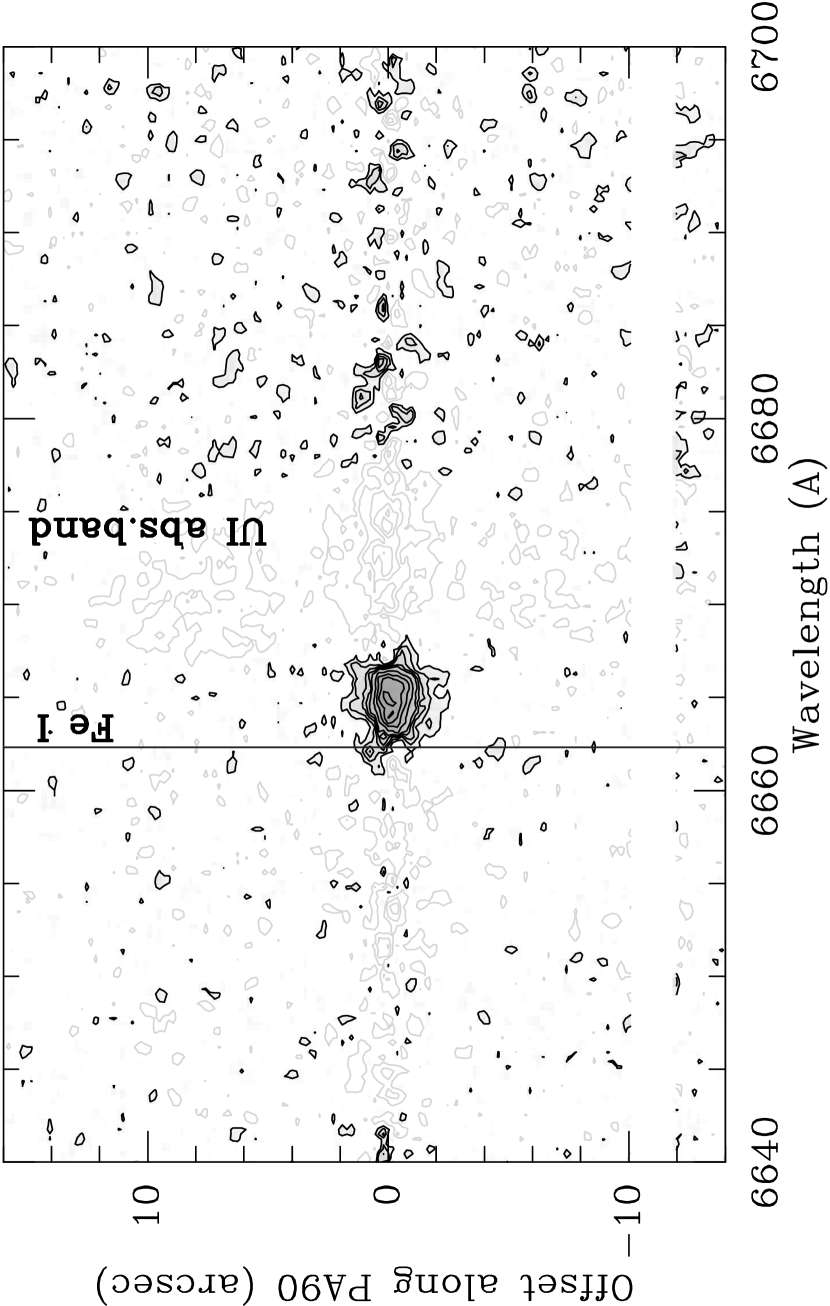
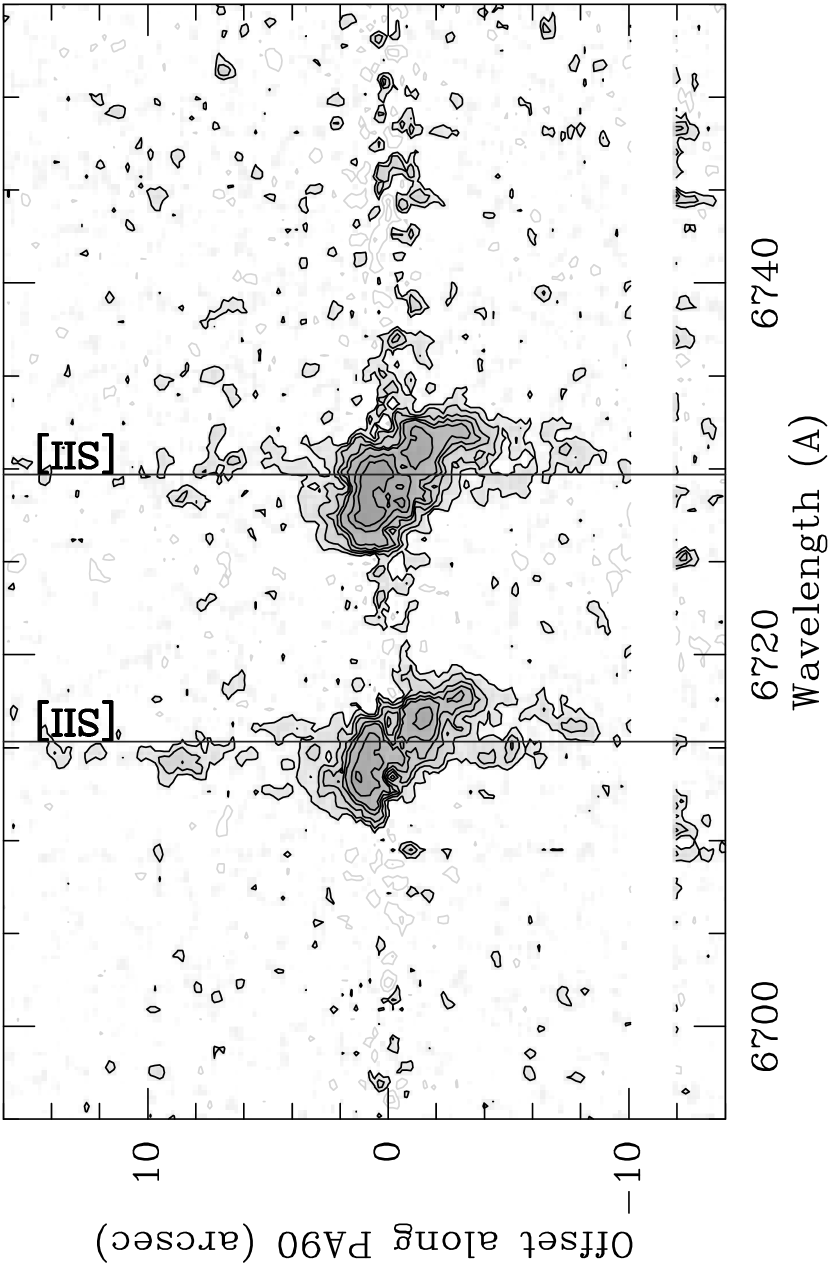
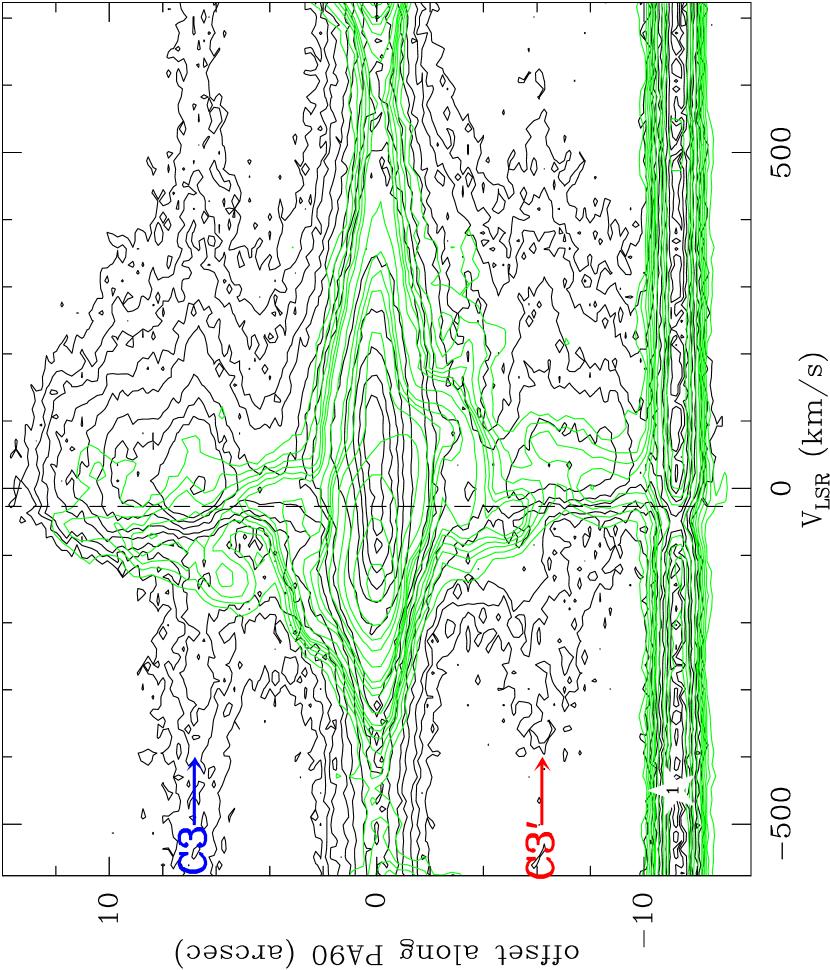
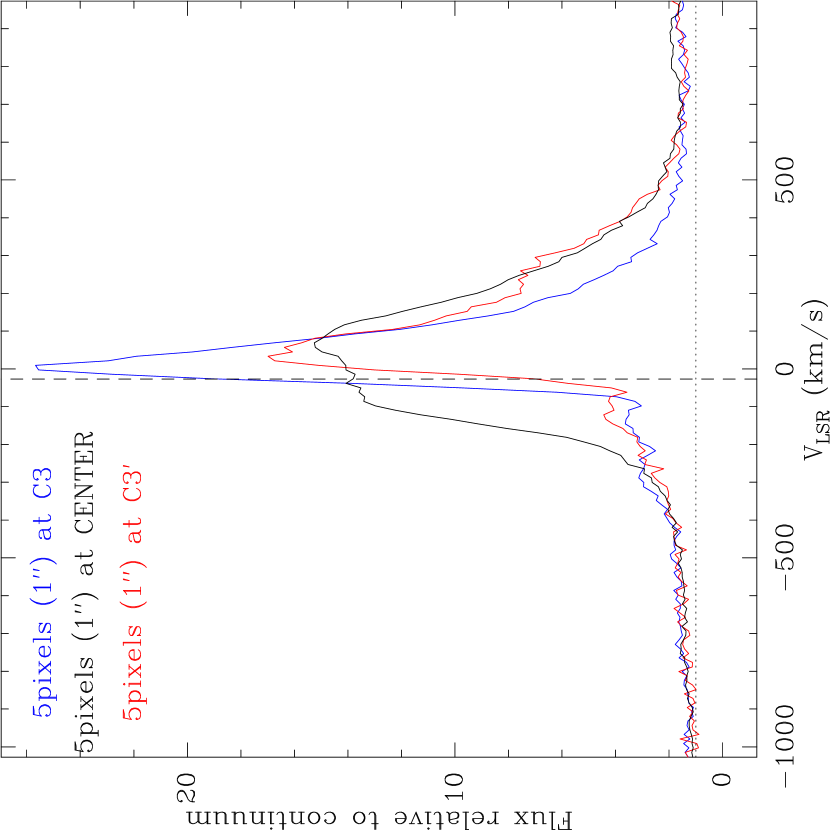
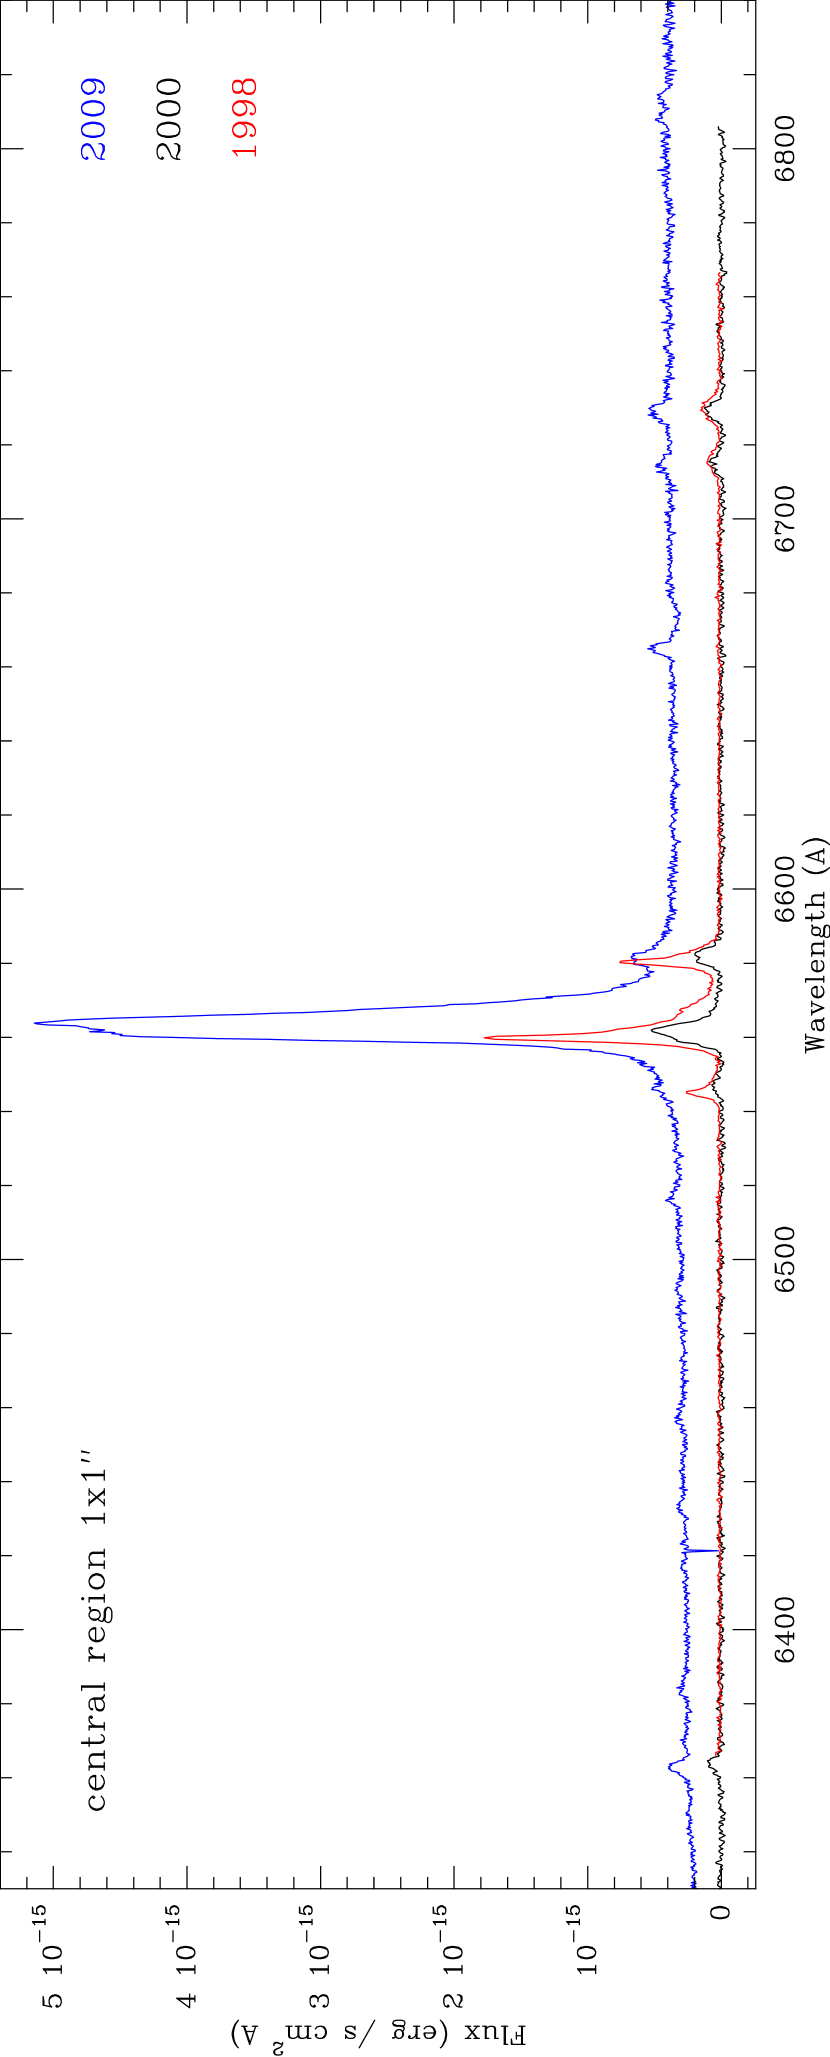
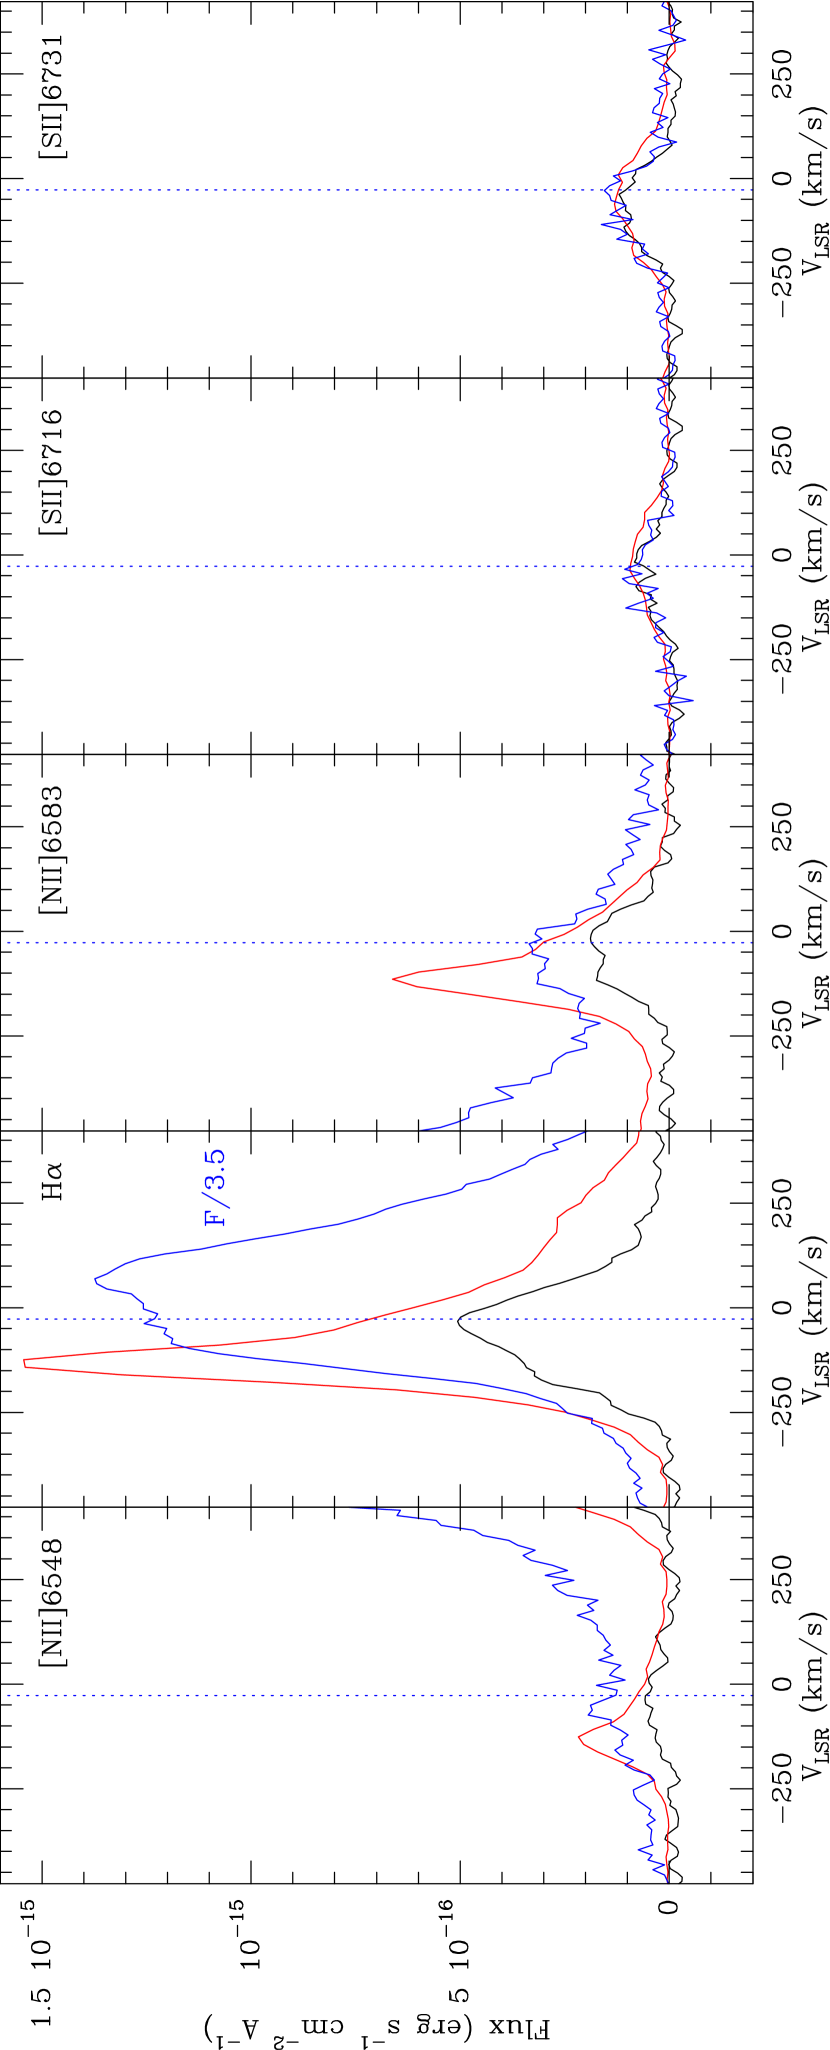
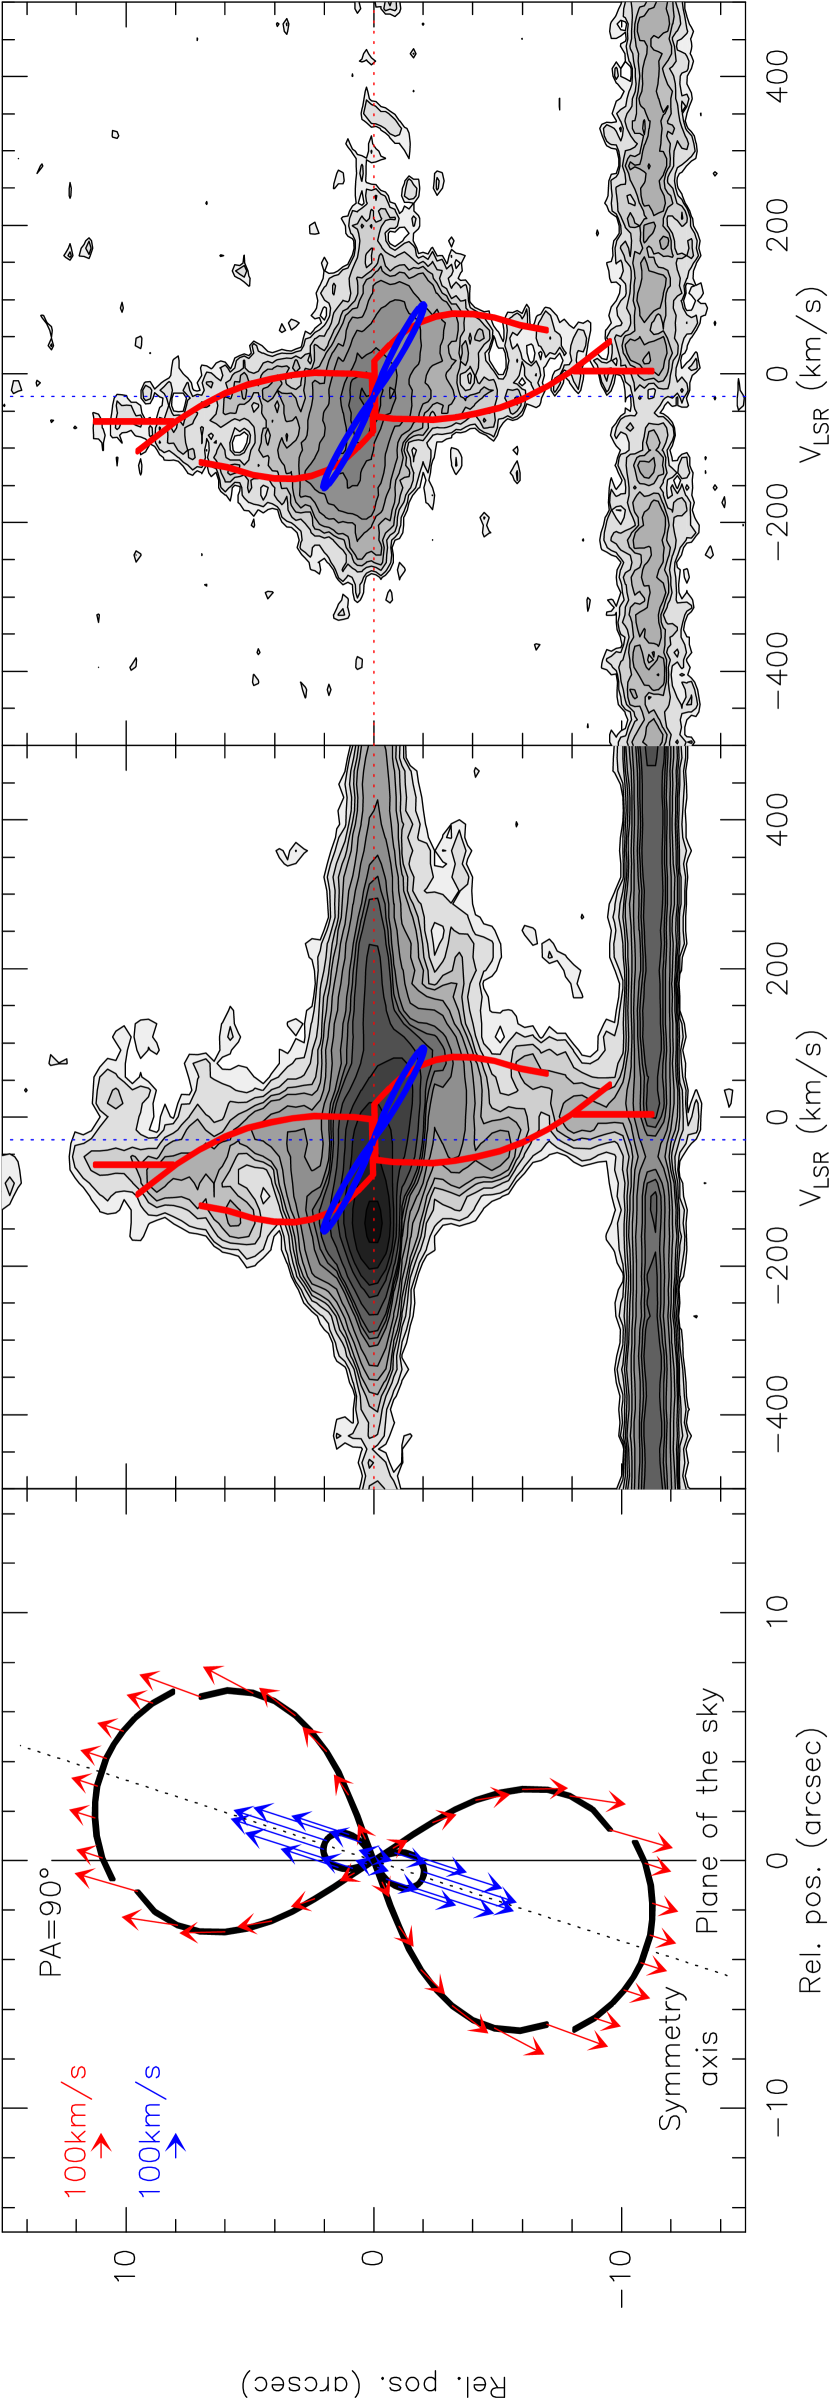


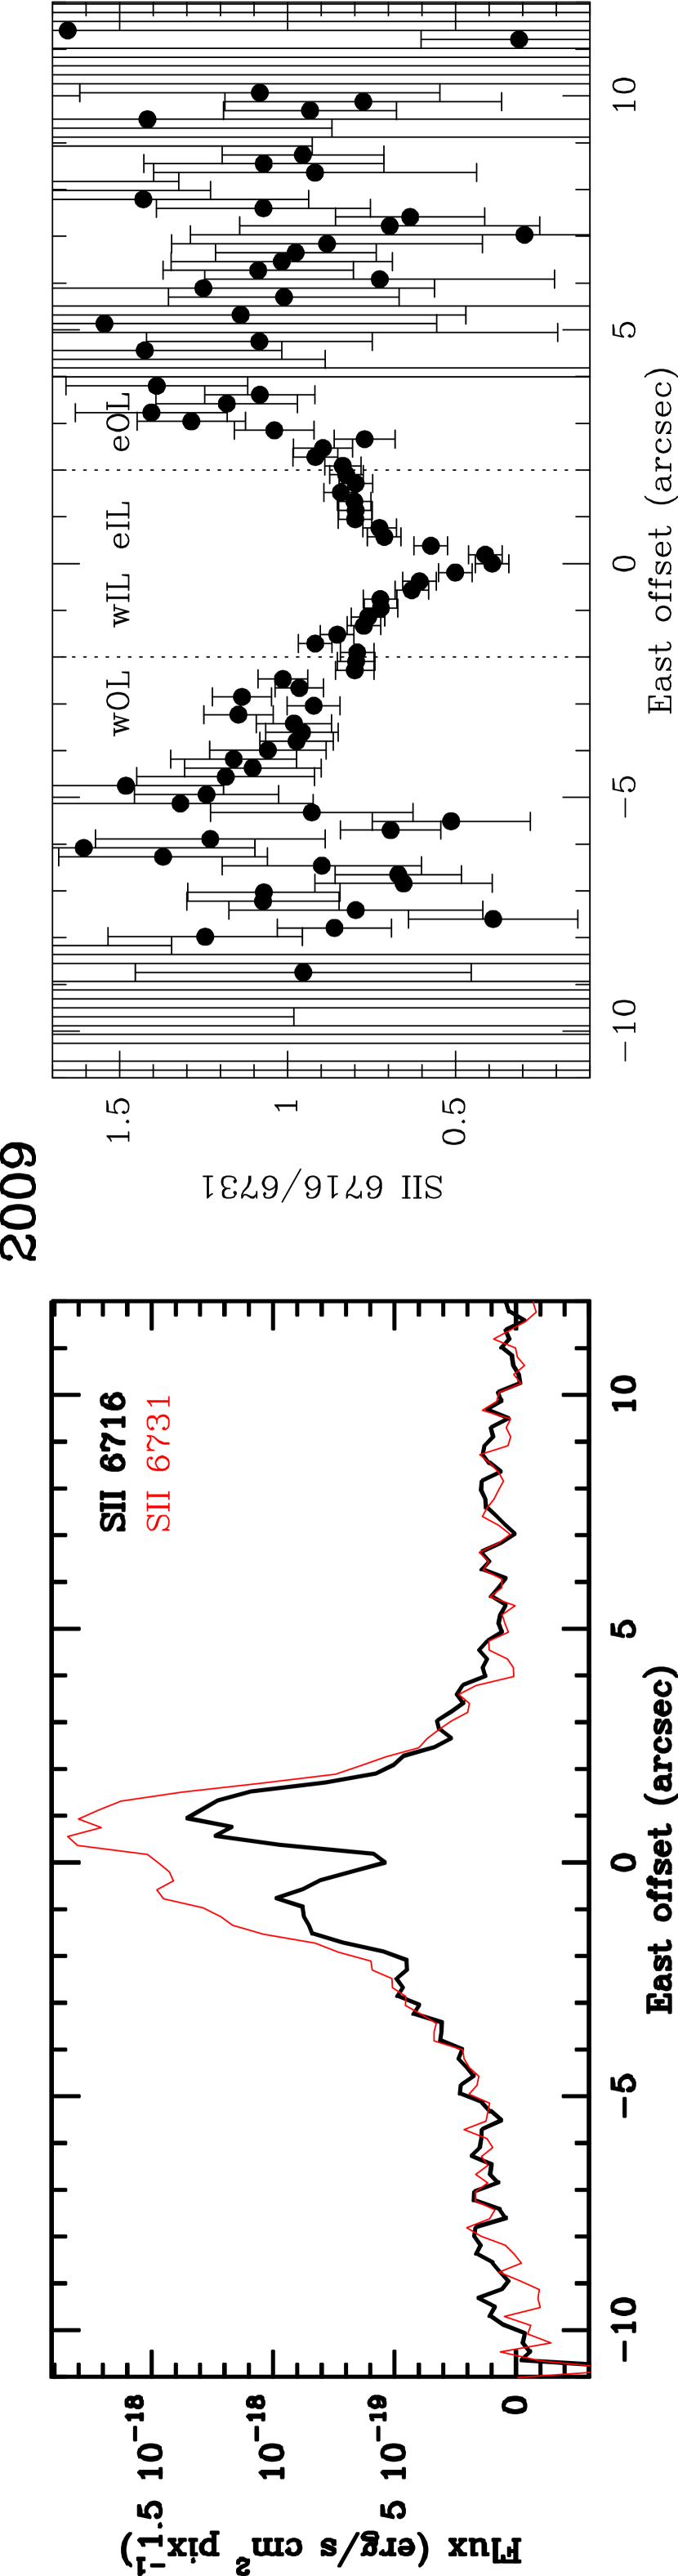
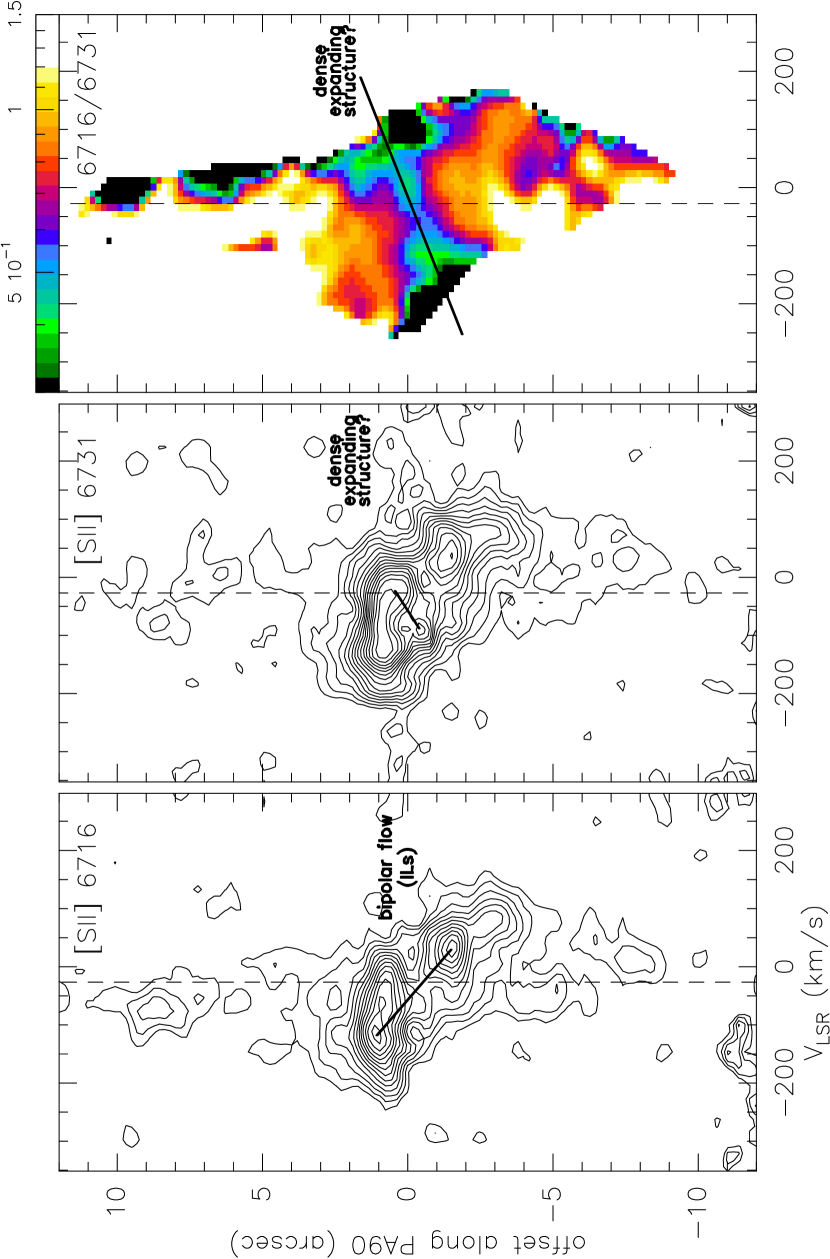
| Run | Date | Telescope | Grating | Dispersion | Range | Pixel | Slit | Exposure |
|---|---|---|---|---|---|---|---|---|
| # | (yyyy-mm-dd) | +Instrument | (Å pix-1) | (Å) | (″) | PositionaaSee Fig. 3 for slit position labels. | (s) | |
| 1 | 1998-01-17 | INT+IDS | R1200Y | 0.39 | 6370-6770 | 0.33 | PA90 | 3600 |
| 1 | 1998-01-18 | INT+IDS | R1200Y | 0.39 | 6370-6770 | 0.33 | PA0,PA0E | 3600,3600 |
| 2 | 2000-11-11bbNon-photometric conditions | INT+IDS | R1200Y | 0.22 | 6234-6805 | 0.19 | PA90,PA0E | 10800,9000 |
| 2 | 2000-11-12 | INT+IDS | R1200Y | 0.22 | 6234-6805 | 0.19 | PA0W,PA119 | 11700,10800 |
| 2 | 2000-11-13 | INT+IDS | R900V | 0.30 | 4558-5330 | 0.19 | PA90 | 27300 |
| 3 | 2009-08-23 | NOT+ALFOSC | VPH #17 | 0.26 | 6330-6850 | 0.19 | PA90 | 6800 |
| (10-15 erg s-1 cm-2) | (10-15 erg s-1 cm-2) | |||||
|---|---|---|---|---|---|---|
| Line | 1998 | 2000 | 2009 | 1998 | 2000 | 2009 |
| H 4861.3 | 1.20(0.04) | 36(9) | ||||
| O III5006.8 | 0.07(0.04) | 2.0(1.2) | ||||
| Fe II5158.0,5158.8 | 0.20(0.04) | 4.9(1.4) | ||||
| N I5200.3 | 0.65(0.04) | 15(3) | ||||
| Fe II5261.6 | 0.05(0.04) | 1.1(0.9) | ||||
| O I6300.3 | 6.4(0.4) | 76(12) | ||||
| O I6363.8 | 2.0(0.4) | 2.2(0.14) | 23(6) | 25(4) | ||
| Fe II6383.8,6385.5†† Lines discovered in this work. | 1.12(0.07) | 13(2) | ||||
| Fe II6416.9†† Lines discovered in this work. | 0.21(0.07) | 2.4(0.9) | ||||
| Fe II6432.7†† Lines discovered in this work. | 0.42(0.07) | 4.7(1.1) | ||||
| Fe II6456.4†† Lines discovered in this work. | 0.77(0.07) | 8.5(0.14) | ||||
| Co I?6490.3†† Lines discovered in this work. | 0.21(0.07) | 2.3(0.8) | ||||
| Fe II6516.1†† Lines discovered in this work. | 0.91(0.07) | 10(2) | ||||
| N II6548.0 | 2.3(0.2) | 1.6(0.4) | 4.9(1.1) | 24(4) | 17(5) | 52(14) |
| H 6562.8 | 23(0.4) | 15.1(0.4) | 161(1.1) | 240(40) | 160(6) | 1700(300) |
| N II6583.5 | 6.7(0.3) | 4.8(0.4) | 10.5(1.1) | 70(11) | 50(2) | 110(20) |
| Fe I6663.4†† Lines discovered in this work. | 0.14(0.07) | 1.4(0.2) | ||||
| S II6716.4 | 2.6(0.2) | 2.4(0.4) | 2.6(0.7) | 25(4) | 23(5) | 25(14) |
| S II6730.8 | 2.9(0.2) | 3.2(0.4) | 3.4(0.7) | 28(5) | 31(6) | 33(14) |
Note. — Errors are given in parenthesis.
| Component | FHα | F[OI] | AV | ne | M | M |
| (10-15 erg s-1 cm-2) | (10-15 erg s-1 cm-2) | (mag) | (cm-3) | (M⊙) | (M⊙) | |
| OLs | 5.7(0.2) | 2.0(0.6) | 2 | 200 | 5.310-4 | 1.510-4 |
| ILs | 9.3(0.2) | 5.4(0.4) | 3 | 1500 | 8.210-5 | 3.810-5 |
| F1-wind | 8.0(0.2) | – | 3 (12) | 2.6104 | 4.110-6††Particularly uncertain. See text in § 6.2 (4.210-3) | – |