Turbulence in the Harassed Galaxy NGC 4254
Abstract
Galaxy harassment is an important mechanism for the morphological evolution of galaxies in clusters. The spiral galaxy NGC 4254 in the Virgo cluster is believed to be a harassed galaxy. We have analyzed the power spectrum of HI emission fluctuations from NGC 4254 to investigate whether it carries any imprint of galaxy harassment. The power spectrum, as determined using the central channels which contain most of the HI emission, is found to be well fitted by a power law with at length-scales to . This is similar to other normal spiral galaxies which have a slope of and is interpreted as arising from two dimensional turbulence at length-scales larger than the galaxy’s scale-height. NGC 4254 is hence yet another example of a spiral galaxy that exhibits scale-invariant density fluctuations out to length-scales comparable to the diameter of the HI disk. While a large variety of possible energy sources like proto-stellar winds, supernovae, shocks, etc. have been proposed to produce turbulence, it is still to be seen whether these are effective on length-scales comparable to that of the entire HI disk. On separately analyzing the HI power spectrum in different parts of NGC 4254, we find that the outer parts have a different slope () compared to the central part of the galaxy (). Such a change in slope is not seen in other, undisturbed galaxies. We suggest that, in addition to changing the overall morphology, galaxy harassment also effects the fine scale structure of the ISM, causing the power spectrum to have a steeper slope in the outer parts.
keywords:
physical data and process: turbulence-galaxy:disk-galaxies:ISM1 introduction
Galaxy harassment (frequent high speed galaxy encounters, Moore et al. 1996) is believed to be an important process in driving the morphological transformation of spiral galaxies to ellipticals inside clusters. Typically, the first encounters convert a normal spiral galaxy to a disturbed spiral with dramatic features drawn out from the dynamically cold gas. The spiral galaxy NGC 4254, located in the nearby Virgo cluster, is found to have a tail (Minchin et al., 2005) with neutral hydrogen (HI) mass within a distance of from the galaxy. This gaseous tail, without any stellar counterpart, is believed to have been produced by an act of galaxy harassment (Haynes et al., 2007). Each act of harassment has the potential to induce a burst of star formation and to change the internal properties of the galaxy, including the properties of the inter stellar medium (ISM). Here we study the effect of the harrasment on the fine scale structure of the ISM. We use the power spectrum of HI intensity fluctuations to quantify the fine scale structure.
Power spectrum analysis of the HI -cm intensity fluctuation has been widely used to probe the ISM (Crovisier & Dickey, 1983; Green, 1993; Stutzki et al., 1998; Stanimirovic et al., 1999; Deshpande et al., 2000; Elmegreen et al., 2001; Elmegreen & Scalo, 2004; Scalo & Elmegreen, 2004). These studies, mainly of our Galaxy and its satellites, find a power law power spectrum with index in the range to . This scale invariant power spectrum is interpreted as arising from turbulence in the ISM.
Recently Begum et al. (2006) have presented a visibility based formalism for determining the power spectrum of galaxies with extremely weak HI emission. This has been applied to a sample of dwarf and spiral galaxies (Dutta et al. 2008; Dutta et al. 2009a; Dutta et al. 2009b). These studies indicate a dichotomy in with values in some galaxies and in others. The two values and are interpreted as arising respectively from two (2D) and three (3D) dimensional turbulence. Some support for this interpretation has been provided by analysis of the fluctuation power spectrum for NGC 1058 where a transition from 2D to 3D turbulence is observed at an angular scale corresponding to the scale height of the galaxy’s disk.
NGC 4254 the galaxy whose power spectrum we estimate in this paper, is a lopsided spiral galaxy (morphological type SA(s)c), with an inclination of (Phookun et al., 1993). The galaxy is located at a distance of 1 Mpc from the core of Virgo cluster and is believed to be falling into the cluster with a relative velocity of (Vollmer et al., 2005). The distance to this galaxy is estimated to be 16.7 Mpc (Mei et al., 2007); at this distance 1′′ corresponds to 81 pc.
2 Data and Analysis
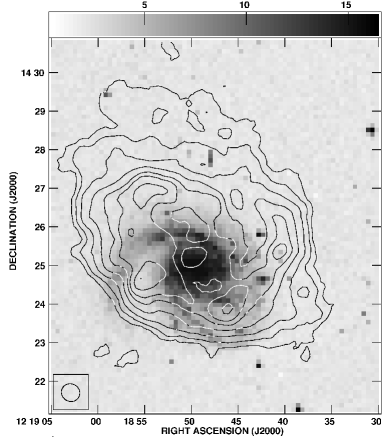
We have used archival HI data of NGC 4254 from the Very Large Array (VLA). The observations had been carried out on March 1992 using the C configurations of the VLA (Phookun et al., 1993). The data was downloaded from the VLA archive and reduced in the usual way using standard tasks in classic AIPS111NRAO Astrophysical Image Processing System, a commonly used software for radio data processing.. The HI emission from NGC 4254 spans over 30 channels i.e, ( to ) from MHz ( km s-1) to MHz ( km s-1) of the channel spectral cube. A frequency width of k Hz for each channel in the data cube corresponds to the velocity resolution of . The continuum from the galaxy was subtracted from the data in the uv plane using the AIPS task UVSUB. The resulting continuum subtracted data was used for the subsequent analysis. Figure 1 shows a integrated HI column density (Moment 0) map of NGC 4254 made from this data. The angular extent of the HI distribution in Figure 1 is measured to be at a column density of , which is comparable to it’s optical diameter (de Vaucouleurs et al., 1991).

Begum et al. (2006) and Dutta et al. (2009a) contains a detailed discussion of the visibility based HI power spectrum estimator , hence we present only a brief discussion here. Here refers to a baseline, i.e. the antenna separation projected in the plane perpendicular to the direction of observation, measured in units of the observing wavelength . It is common practice to express the dimensionless quantity in units of kilo wavelength (k). Every visibility is correlated with all other visibilities within a disk , where is the angular extent of the galaxy. The correlations are averaged over different directions assuming that the signal is statistically isotropic in the plane of the galaxy’s image. To increase the signal to noise ratio we further average the correlation in bins of and over all frequency channels with HI emission. The expectation value of the estimator is real, and it is the convolution of the HI power spectrum with a window function . The window function, which quantifies the effect of the large-scale HI distribution and the finite angular extent of the galaxy, is peaked around and has a width of order beyond which . Analytic considerations and simulations (Dutta et al., 2009a) show that beyond a baseline the convolution does not effect the shape of the HI power spectrum, and we may directly interpret the real part of the estimator as the HI power spectrum .
The estimator also has a small imaginary component arising mainly from noise. The error-bars for the estimated power spectrum is a sum, in quadrature, of contributions from two sources of uncertainty. At small the uncertainty is dominated by the sample variance which comes from the fact that we have a finite and limited number of independent estimates of the true power spectrum. At large , it is dominated by the system noise in each visibility.
3 Results and Discussion
Figure 2 shows the real and imaginary parts of evaluated using channels from to which have relatively high HI emission. Here the estimator was separately evaluated for each channel and then averaged over all channels to increase the signal to noise ratio. As expected from the theoretical considerations (Begum et al. 2006), the imaginary part is well suppressed compared to the real part. We also estimate using the line free channels to test for any contribution from the residual continuum. This is found to be much smaller than the signal (Figure 2) indicating that the continuum has been adequately subtracted out.
The power law , with is found to give a good fit to the HI power spectrum for the range to (Table 1). The best-fit power-law and the error-bar on were determined using minimization (Begum et al., 2006; Dutta et al., 2009b). We use (distance to the galaxy) to convert a baseline to a length-scale in the plane of the galaxy’s image. The range to corresponds to the range of length-scales to . Dutta et al. (2009a) have broadly classified the observed turbulence in their galaxy sample as 2D turbulence at the large scales in the plane of the galaxies disk and 3D turbulence at scales smaller than the scale height of the disk. They also show that the slope of the power spectrum changes from to as one goes from 2D to 3D turbulence. For the present case the largest length-scale () is definitely larger than the typical HI scale heights within the Milky-Way (Lockman et al., 1984; Wouterloot et al., 1990) and in external spiral galaxies (e.g. Narayan & Jog 2002). It is thus quite reasonable to conclude that the slope is of 2D turbulence in the plane of the galaxy’s disk. The fact that we do not observe the transition to 3D turbulence, which is expected to occur at a baseline (Dutta et al., 2009a), allows us to place an upper limit on the galaxy’s scale height .
Our present observation is another confirmation (Dutta et al 2008, 2009a 2009b) of the fact that spiral galaxies exhibit scale-invariant density fluctuations that extend to length-scales of (eg. NGC 628, NGC 1058) which is comparable to the diameter of the HI disk. While a large variety of possible energy sources like proto-stellar winds, supernovae, shocks, etc. have been proposed to drive turbulence (Elmegreen & Scalo, 2004), it is still to be seen whether these are effective on length-scales as large as .
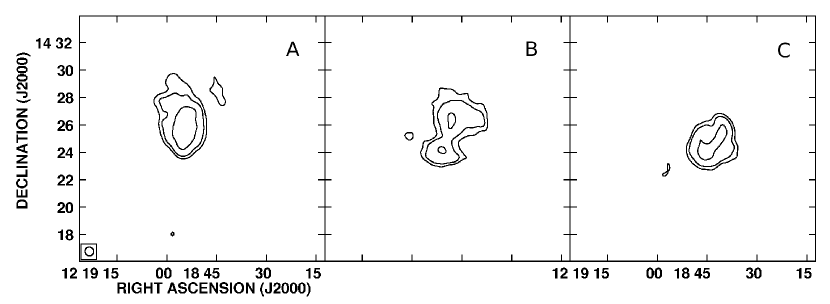

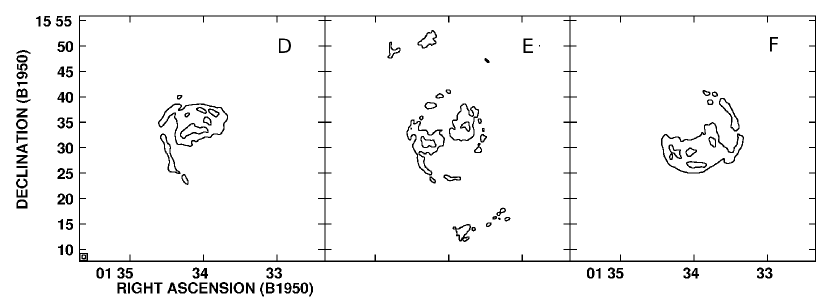

Galaxy harassment is expected to have different effects on the inner and outer parts of the galaxy. While gas is stripped from the outer parts, the inner part looses angular momentum and gradually collapses to the center through repeated galaxy encounters. We can selectively study different parts of NGC 4254, whose rotation axis is tilted at to the line of sight, by considering different velocity channels. Our analysis till now has used only the central channels, we now use the central channels () for the subsequent analysis. We construct different data cubes namely A, B and C containing channels , and respectively. We can now separately probe the North east, central and South west parts of the galaxy (Figure 3) using these three data cubes. For each data cube, we evaluate the HI power spectrum using individual channels and then average over the channels in the respective cubes. We estimated seperately for A, B and C and the best fit power law is obtained for only. We find that for each data cubes the HI power spectrum is well fit by a power law (Figure 4), the details being shown in Table 1. We find that the slope is for A and C which probe the outer parts of the disk while it is in B which probes the central region. To verify that this change in slope is due to harrassment, we also consider the HI power spectrum of the spiral galaies NGC 628 and NGC 1058 (Dutta et al., 2008, 2009b) which are not undergoing galaxy harassment. Figure 5 shows the regions of the spiral galaxy NGC 628 corresponding to each of the channel range 108-119 (D), 120-131 (E) and 132-143 (F). We find that the power spectra of these three data cubes (Figure 6) all have the same slope , which is also similar to the slope of the central part of NGC 4254. The results are similar for NGC 1058 and hence we do not explicitly show these here. Based on this we conclude that the difference in slope between the inner and outer parts of NGC 4254 is a consequence of galaxy harassment. Not only does galaxy harassment affect the global morphology of the galaxy, it also affects the fine scale structure in the ISM as reflected by HI power spectrum.
We note that NGC 4254 have an inclination of , on the other hand NGC 628 and NGC 1058 are more face-on galaxies (inclination ). In our analysis we selectively study different parts of a galaxy by considering different velocity channel ranges. However, since face-on galaxies do not have much range in radial velocity from the rotation curve, the spatial extent of HI in NGC 628 and NGC 1058 will not be very different for the three velocity channel ranges, which is unlike the case for NGC 4254. Hence it is likely that we failed to find a change of slope in NGC 628 and NGC 1058 because of this effect of inclination. However, as seen in Figure 5 for NGC 628, all three data cubes D, E and F have a significant contribution of HI from the outer region of NGC 628, leading us to believe that the power spectrum has a slope of in the outer parts of NGC 628. This is similar to the value of slope seen in the central parts of NGC 4254 and significantly different from the slope in the outer parts of NGC 4254. Hence it indicates an impact of harassment in NGC 4254. Further analysis of spiral galaxies with large inclination angles would possibly be able to resolve this issue.
We currently do not have an understanding of how galaxy harassment caused a steepening of the HI power spectrum in the outer parts of the galaxy. Theoretical modeling and the analysis of other Virgo cluster spiral galaxies are needed for further progress in this direction.
| Data | Channels | range | ||
|---|---|---|---|---|
| (k ) | (k ) | |||
| 16 central | ||||
| channels | ||||
| A | ||||
| B | ||||
| C |
Acknowledgments
P.D. is thank full to Sk. Saiyad Ali, Kanan Datta, Tapomoy Guha Sarkar, Tatan Ghosh, Suman Majumder, Abhik Ghosh Subhasis Panda and Prakash Sarkar for use full discussions. P.D. would like to acknowledge HRDG CSIR for providing financial support. S.B. would like to acknowledge financial support from BRNS, DAE through the project 2007/37/11/BRNS/357. The data presented in this paper were obtained from the National Radio Astronomy Observatory (NRAO) data archive. The NRAO is a facility of the US National Science Foundation operated under cooperative agreement by Associated Universities, Inc.
References
- Begum et al. (2006) Begum, A., Chengalur, J. N., & Bhardwaj, S. 2006, MNRAS, 372, L33
- Butcher & Oemler (1978) Butcher, H., & Oemler, A., Jr. 1978, ApJ, 219, 18
- Crovisier & Dickey (1983) Crovisier, J., & Dickey, J. M. 1983, A&A, 122, 282
- Davies et al. (2004) Davies, J., et al. 2004, MNRAS, 349, 922
- Demoulin-Ulrich et al. (1984) Demoulin-Ulrich, M.-H., Butcher, H. R., & Boksenberg, A. 1984, ApJ, 285, 527
- Deshpande et al. (2000) Deshpande, A. A., Dwarakanath, K. S., & Goss, W. M. 2000, ApJ, 543, 227
- Dressler (1984) Dressler, A. 1984, ApJ, 281, 512
- Dutta et al. (2008) Dutta, P., Begum, A., Bharadwaj, S., & Chengalur, J. N. 2008,MNRAS, 384, L34
- Dutta et al. (2009a) Dutta, P., Begum, A., Bharadwaj, S., & Chengalur, J. N. 2009a,MNRAS, 398, 887
- Dutta et al. (2009b) Dutta, P., Begum, A., Bharadwaj, S., & Chengalur, J. N. 2009b,MNRAS, 397, L60
- Elmegreen et al. (2001) Elmegreen, B. G., Kim, S., & Staveley-Smith, L. 2001, ApJ, 548, 749
- Elmegreen & Scalo (2004) Elmegreen, B. G., & Scalo, J. 2004, ARA&A, 42, 211
- Green (1993) Green, D. A. 1993, MNRAS, 262, 327
- Giovanelli et al. (2007) Giovanelli, R., et al. 2007, AJ, 133, 2569
- Haynes et al. (2007) Haynes, M. P., Giovanelli, R., & Kent, B. R. 2007, ApJL, 665, L19
- Kolmogorov (1941) Kolmogorov, A. 1941, Akademiia Nauk SSSR Doklady, 30, 301
- Lazarian & Pogosyan (2000) Lazarian, A., & Pogosyan, D. 2000, ApJ, 537, 720
- Lockman et al. (1984) Lockman, F. J., Hobbs, L. M., & Shull, J. M. 1984, BAAS, 16, 981
- Mei et al. (2007) Mei, S., et al. 2007, ApJ, 655, 144
- Minchin et al. (2005) Minchin, R., et al. 2005, ApJL, 622, L21
- Moore et al. (1996) Moore, B., Katz, N., & Lake, G. 1996, ApJ, 457, 455
- Moore et al. (1998) Moore, B., Lake, G., & Katz, N. 1998, ApJ, 495, 139
- Narayan & Jog (2002) Narayan, C.A. & Jog, C.J. 2002, A&A, 390, 35 555, L33
- Phookun et al. (1993) Phookun, B., Vogel, S. N., & Mundy, L. G. 1993, ApJ, 418, 113
- Press et al. (1992) Press, W. H., Teukolsky, S. A., Vetterling, W. T., & Flannery, B. P. 1992, Numerical Recipes in C, Cambridge University Press 393L,26
- Scalo & Elmegreen (2004) Scalo, J., & Elmegreen, B. G. 2004, ARA&A, 42, 275
- Schulman et al. (1994) Schulman, E., Bregman, J. N., & Roberts, M. S. 1994, ApJ, 423, 180
- Stanimirovic et al. (1999) Stanimirovic, S., Staveley-Smith, L., Dickey, J. M., Sault, R. J., & Snowden, S. L . 1999, MNRAS, 302, 417
- Stutzki et al. (1998) Stutzki, J., Bensch, F., Heithausen, A., Ossenkopf, V., & Zielinsky, M. 1998, A&A, 336, 697
- de Vaucouleurs et al. (1991) de Vaucouleurs, G., de Vaucouleurs, A., Corwin, H. G., Jr., Buta, R. J., Paturel, G., & Fouque, P. 1991, skytel, 82, 621
- Vollmer et al. (2005) Vollmer, B., Huchtmeier, W., & van Driel, W. 2005, A&A, 439, 921
- Westpfahl et al. (1999) Westpfahl, D. J., Coleman, P. H., Alexander, J., & Tongue, T. 1999, AJ, 117, 868
- Wouterloot et al. (1990) Wouterloot, J. G. A., Brand, J., Burton, W. & Kwee, K. K. 1990, A&A, 230, 21