Chandra observation of two shock fronts in the merging galaxy cluster Abell 2146
Abstract
We present a new Chandra observation of the galaxy cluster Abell 2146 which has revealed a complex merging system with a gas structure that is remarkably similar to the Bullet cluster (eg. Markevitch et al. 2002). The X-ray image and temperature map show a cool subcluster with a ram pressure stripped tail of gas just exiting the disrupted primary cluster. From the sharp jump in the temperature and density of the gas, we determine that the subcluster is preceded by a bow shock with a Mach number , corresponding to a velocity relative to the main cluster. We estimate that the subcluster passed through the primary core only ago. In addition, we observe a slower upstream shock propagating through the outer region of the primary cluster and calculate a Mach number . Based on the measured shock Mach numbers and the strength of the upstream shock, we argue that the mass ratio between the two merging clusters is between 3 and 4 to one. By comparing the Chandra observation with an archival HST observation, we find that a group of galaxies is located in front of the X-ray subcluster core but the brightest cluster galaxy is located immediately behind the X-ray peak.
keywords:
X-rays: galaxies: clusters — galaxies: clusters: Abell 2146 — intergalactic medium1 Introduction
Galaxy clusters are assembled by hierarchical mergers of smaller subclusters and groups. These subclusters collide at velocities of a few thousand , releasing as much as of kinetic energy as thermal energy by driving shocks, generating turbulence and probably accelerating relativistic particles (see eg. Sarazin 2001; Feretti et al. 2002). Major cluster mergers are therefore the most energetic events since the Big Bang. Shock fronts provide a key observational tool in the study of these systems. They can be used to determine the velocity and kinematics of the merger and to study the conditions and transport processes in the ICM, including electron-ion equilibrium and thermal conduction (eg. Markevitch 2006). Combining X-ray observations of merging clusters with gravitational lensing studies has also produced direct detections of dark matter (Clowe et al. 2004, 2006; Bradač et al. 2006) and constraints on the dark matter self-interaction cross section (Markevitch et al. 2004; Randall et al. 2008). Radio observations of supernova remnants indicate that a fraction of the shock energy can be converted into the acceleration of relativistic particles (eg. Blandford & Eichler 1987). It is likely that this process also operates in cluster mergers and could produce synchrotron radio emission (eg. Feretti et al. 2002; Feretti 2005; Buote 2001; Kempner & David 2004) and inverse Compton hard X-ray emission (eg. Fusco-Femiano et al. 1999; Rephaeli et al. 1999; Fusco-Femiano et al. 2005). However, as radio emitting electrons have short radiative lifetimes (), it is difficult to explain the size of extended radio halos (for a review see eg. Brunetti 2003).
X-ray observations of merging shocks currently provide the only method for determining the velocity of the cluster gas in the plane of the sky (eg. Markevitch et al. 1999). By measuring the temperature and density of the gas on either side of the shock using X-ray imaging spectroscopy, the shock velocity can be calculated from the Rankine-Hugoniot jump conditions. While many clusters are found to have shock-heated regions (eg. Henry & Briel 1995, 1996; Markevitch et al. 1996; Belsole et al. 2004, 2005), the detection of a sharp density edge and an unambiguous jump in temperature is rare. Currently only two shock fronts have been found by Chandra: one in the Bullet cluster (1E 0657-56; Markevitch et al. 2002; Markevitch 2006) and the other in Abell 520 (Markevitch et al. 2005). In this paper we present two new merger shock fronts discovered in a recent Chandra observation of the galaxy cluster Abell 2146 at a redshift (Struble & Rood 1999; Böhringer et al. 2000).
We assume , and , translating to a scale of per arcsec at the redshift of Abell 2146. All errors are unless otherwise noted.
2 Data Preparation
Abell 2146 was observed with the Chandra ACIS-S detector for split into two observations which were taken only a day apart in April 2009 (Obs. IDs 10464 and 10888). The data were analysed with CIAO version 4.2 and CALDB version 4.2.0 provided by the Chandra X-ray Center (CXC). The level 1 event files were reprocessed to apply the latest gain and charge transfer inefficiency correction and then filtered to remove photons detected with bad grades. The improved background screening provided by VFAINT mode was also applied. The background light curve extracted from the ACIS-S1 level 2 event file was filtered using the lc_clean script111See http://cxc.harvard.edu/contrib/maxim/acisbg/ provided by M. Markevitch to identify periods affected by flares. There were no flares in either observation of Abell 2146 so we proceeded with the final cleaned exposure of .
As the two separate observations were taken so closely together, with effectively identical chips positions and roll angles, we were able to reproject them to a common position (Obs. ID 10464) and combine them. Exposure-corrected images were created by combining the two cleaned event files and assuming a monoenergetic distribution of source photons of , which is approximately the peak energy of the source.
3 Imaging Analysis
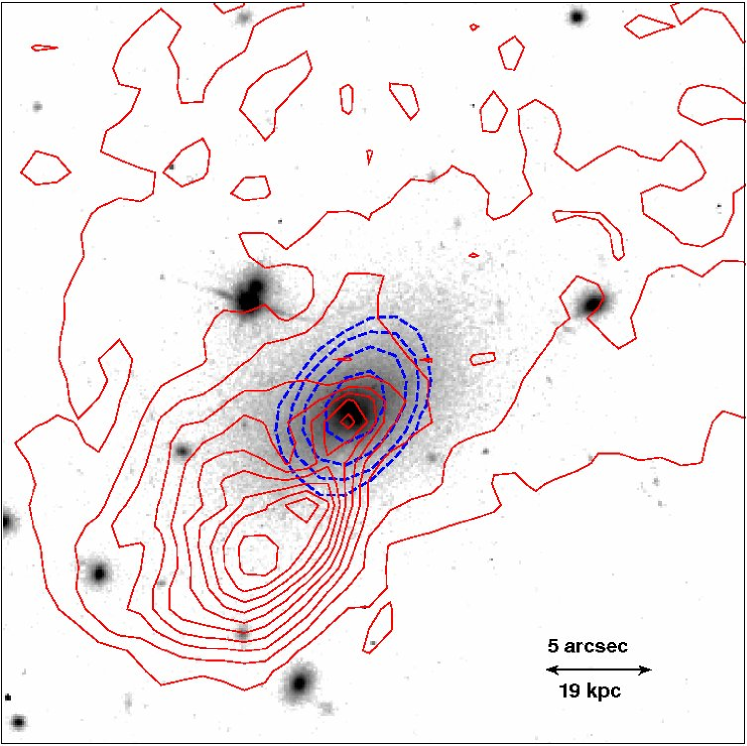
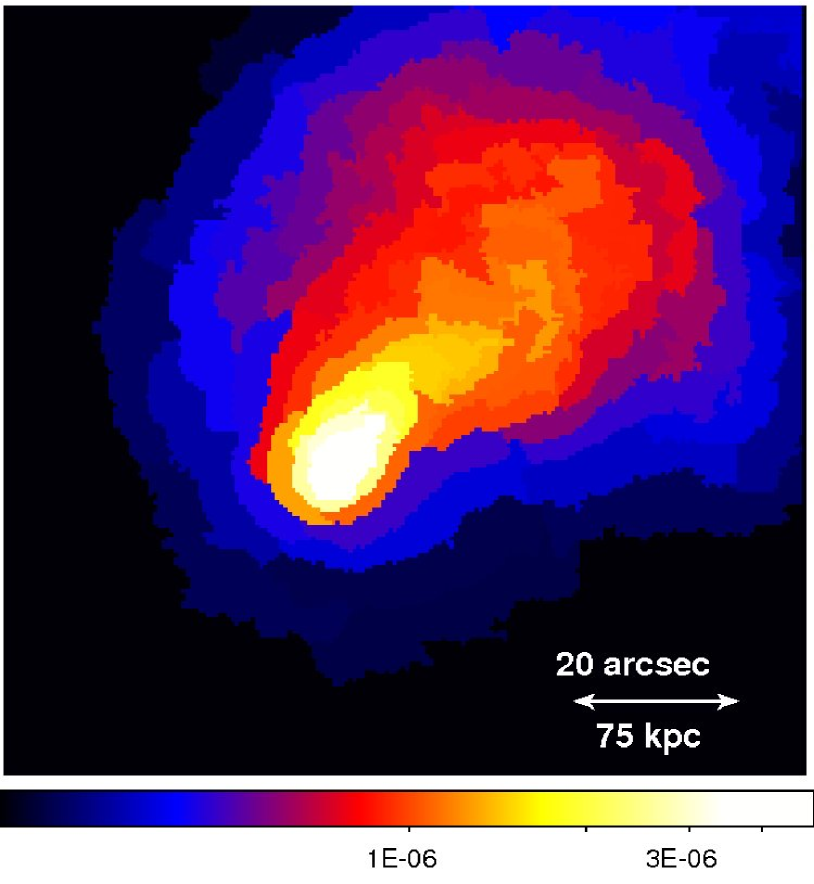
Exposure-corrected images of the galaxy cluster and a zoom in of the cluster core are shown in Fig. 1. The X-ray emission is extended from SE to NW and appears to cut off abruptly at either end of this axis. The bright, dense core has been displaced from the cluster centre and is being stripped of its material to form a tail of gas towards the NW. The brightest cluster galaxy (BCG) shown in Fig. 2 is displaced to the NW of the X-ray surface brightness peak and contains a point source detected in the Chandra X-ray image and a VLA radio image (NRAO/VLA Archive Survey). The X-ray point source is detected at hard energies () and it is likely that this corresponds to an AGN, but a measurement of the flux was difficult with the superimposed cluster emission. We estimated the point source flux by extracting the source counts in a region of radius and subtracting the cluster emission using a surrounding region from radius. Using a powerlaw model with photon index , we estimated the point source luminosity in the energy range to be .
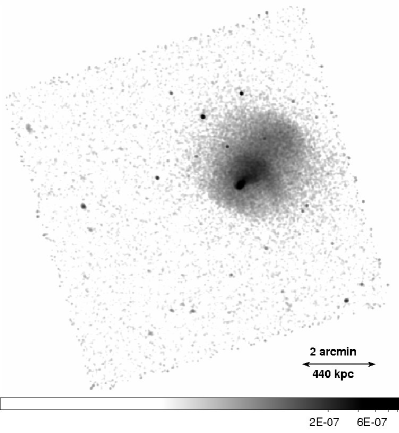
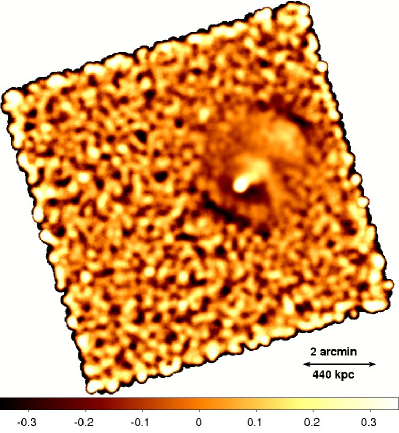
The unsharp-masked image shown in Fig. 1 (right) highlights the different structures in the cluster gas. The cluster is separated into two concentrations of X-ray emitting gas: the cluster core and its trail of emission to the SE and a second, more diffuse region of material to the NW. Figs. 1 and 3 also reveal several edges in the X-ray surface brightness. The sharpest of these defines the SE edge of the bright subcluster core. A second outer edge is visible to the SE of the core although the steep decline in the cluster surface brightness reduces the significance of this feature. The third edge appears at the NW edge of the galaxy cluster. There could potentially be a fourth surface brightness edge separating the two concentrations of cluster gas. Finally, the subcluster’s tail of gas also appears to have an extension to the SW.
Abell 2146 appears to have a remarkably similar structure to the Bullet cluster (Markevitch et al. 2002; Markevitch 2006). The X-ray morphology suggests a recent merger where a subcluster containing the dense core has passed through the centre of a second cluster, the remnant of which appears as the concentration of gas to the NW. The dense subcluster has just emerged from the primary core, travelling to the SE, and is trailing material that has been ram pressure stripped in the gravitational potential. The passage of this dense subcluster core is likely to generate sharp shock fronts in the ICM.
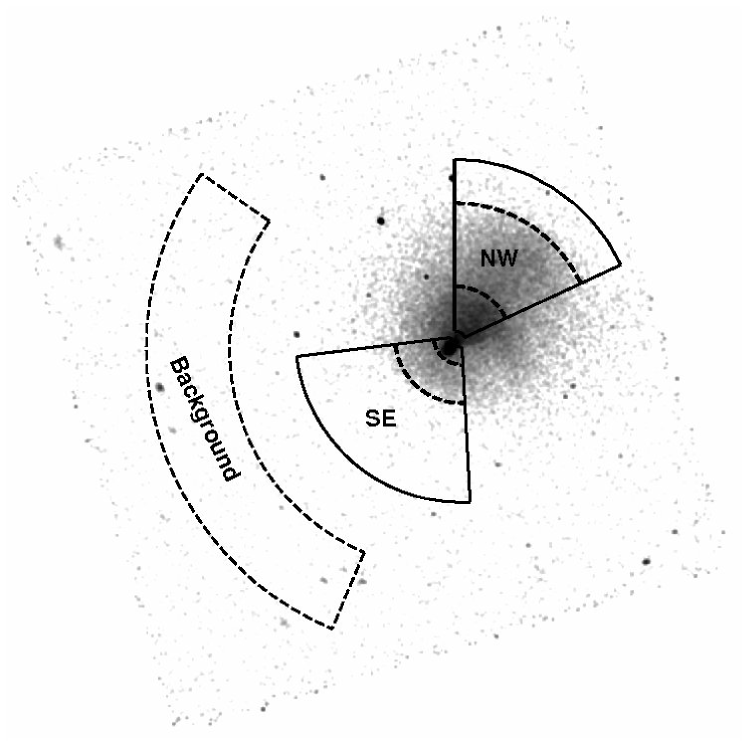
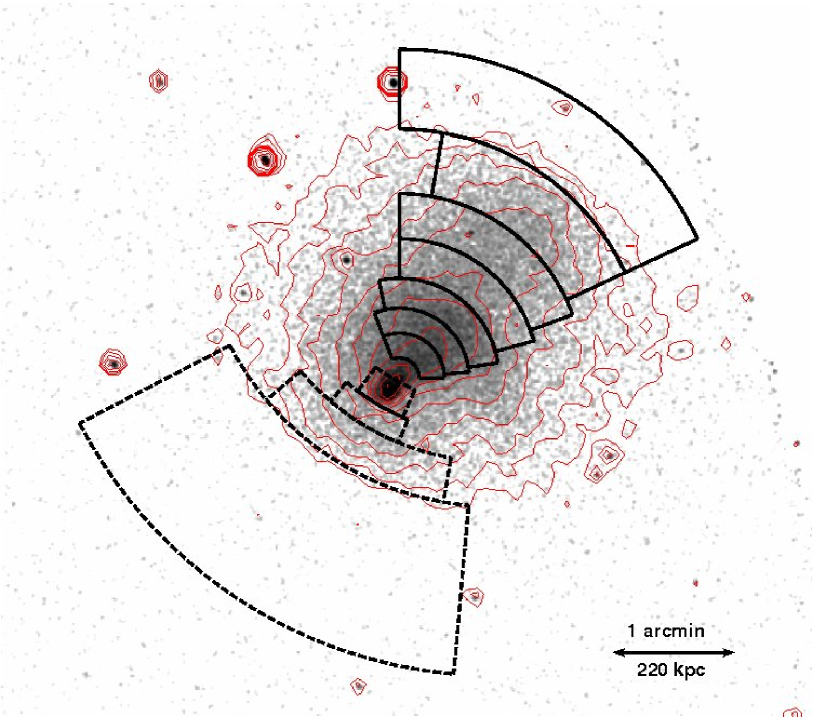
To confirm the detection of the edges in the X-ray emission, we produced surface brightness profiles in two sectors to the NW and SE from the AGN, as shown in Fig. 4. The surface brightness profiles were extracted from the merged exposure-corrected image in the energy range . The radial bins are wide in the cluster centre and then increase in size as the cluster surface brightness declines and the background subtraction becomes more important. Point sources were identified using the CIAO algorithm wavdetect, visually confirmed and excluded from the analysis using elliptical apertures where the radii were conservatively set to five times the measured width of the PSF (Freeman et al. 2002). The background was determined in a sector taken from the SE edge of the ACIS-S3 chip, from the central AGN, in a region that is largely free of cluster emission (Fig. 4).
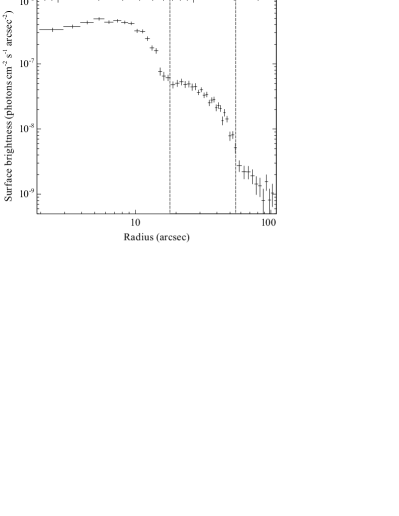
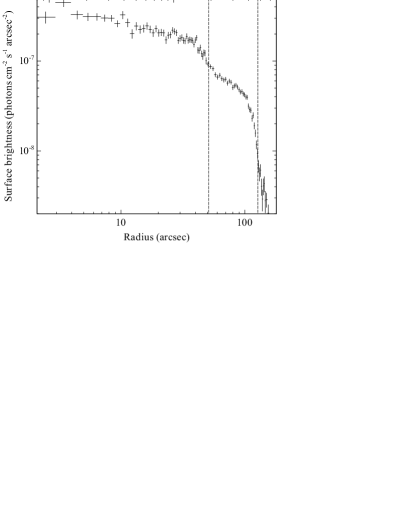
Fig. 5 (left) shows the SE surface brightness profile, centred on the AGN. There is steep decline in the surface brightness at radius, marking the edge of the subcluster core, and then a second break at . Fig. 5 (right) shows the NW surface brightness profile declines slowly through the length of the ram pressure stripped tail to a break at , marking the separation between the two concentrations of X-ray gas. There is a sharp edge in the surface brightness profile at , where the surface brightness drops by a factor of . In summary, we identify four surface brightness edges: two in the SE sector at radii of and in front of the subcluster core, and another two in the NW sector at radii of and . To determine whether these surface brightness edges are shocks or cold fronts (eg. Markevitch et al. 2000; Vikhlinin et al. 2001; Markevitch & Vikhlinin 2007), we extracted and analysed X-ray spectra on either side of these features to determine the ICM temperature and density.

4 Spectral Analysis & Deprojection
We first extracted an overall cluster spectrum using an outer radius of , which contained the vast majority of the cluster emission, after excluding point sources. The background was subtracted using a spectrum extracted from a cluster-free region at the edge of the chip and appropriate responses and ancillary responses were generated. The spectrum was restricted to the energy range and grouped to contain a minimum of 30 counts per spectral channel. A single temperature fit to the cluster spectrum using an absorbed thermal plasma emission model phabs(mekal) (Balucinska-Church & McCammon 1992; Mewe et al. 1985; 1986; Kaastra 1992; Liedahl et al. 1995) in xspec version 12.5.0 (Arnaud 1996) produced a good fit (reduced for 328 degrees of freedom) with a temperature , luminosity () and an abundance of , measured assuming the abundance ratios of Anders & Grevesse (1989). The Galactic hydrogen column density was left as a free parameter, giving a value which is consistent with the Galactic value measured by Kalberla et al. (2005) of .
We also fitted an absorbed single temperature model to a spectrum extracted in a region of radius , which approximately encloses the bright subcluster core, and excluded the AGN. The hydrogen column density parameter was poorly constrained and so was fixed to the Galactic value. This produced a temperature of and a metallicity of (reduced for 68 degrees of freedom). The spectral fit was significantly improved by adding a cooling flow mkcflow component which models gas cooling down to low temperatures ( reduced to for 67 degrees of freedom). The low temperature limit of the mkcflow model was fixed to and the higher temperature and metallicity were tied to the mekal component parameters. The mkcflow model normalization suggests that could be cooling out of the X-ray and down to low temperatures in the subcluster core.
If we exclude the cool core from the overall cluster spectrum we get a cluster temperature of and luminosity (). Therefore, Abell 2146 falls on the relation for local clusters (Pratt et al. 2009).
4.1 Temperature and density maps
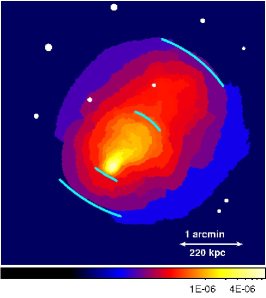
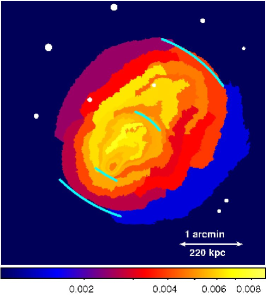
We used spatially resolved spectroscopy techniques to produce maps of the projected gas properties in the cluster core (Fig. 6). The central was divided into bins using the Contour Binning algorithm (Sanders 2006), which follows surface brightness variations. Regions with a signal-to-noise ratio of 32 ( counts) were chosen, with the restriction that the length of the bins was at most two and a half times their width. The background spectrum was subtracted from the observed dataset and appropriate responses and ancillary responses were generated. The spectra were grouped to contain a minimum of 20 counts per spectral channel and restricted to the energy range . Each spectrum was fitted in xspec with an absorbed mekal model with the absorption fixed to the Galactic value (Kalberla et al. 2005) and the redshift fixed to 0.234. The fitting procedure minimised the -statistic. The errors were approximately in temperature and for the emission measure. However, the high temperature bins greater than are poorly constrained by the energy range of Chandra producing larger errors greater than . We fixed the metallicity to an average value of in the spectral fits; the limited number of counts produced a poorly constrained metallicity parameter if it was left free. However, we found that fixing the metallicity still produced a very similar temperature and density map.
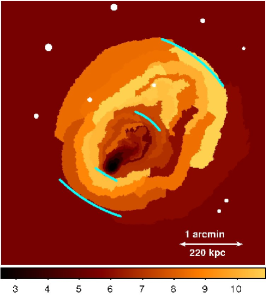
Shown in Fig. 6 are the projected emission measure per unit area, temperature and ‘pressure’ maps. The projected ‘pressure’ map was produced by multiplying the square root of the emission measure per unit area and the temperature maps. The projected emission measure map shows the strongly peaked core surface brightness, bright tail of stripped material and the elongated morphology of the cluster in the NW to SE direction. There could also be a spur of emission out to the SW of the subcluster core. The projected temperature map shows strong variations across the cluster. In the dense subcluster core, the temperature drops as low as and then sharply increases to the SE up to between the two SE surface brightness edges. The large errors on the high temperature bin immediately in front of the cool subcluster make it consistent with a constant temperature between the edges. The ram pressure stripped tail of material appears as a warmer stream of gas () behind the subcluster core and trails back to the hottest region of the disrupted main cluster. The SW spur of emission suggested in the emission measure map corresponds to a region of gas which could be connected to the ram pressure stripped tail from the core. The high temperatures, , in the NW region of the cluster suggest shock heating of the gas is likely. The sudden drop in temperature at the NW edge of the cluster, which coincides with the surface brightness edge, is particularly suggestive of a shock front.
The NW edge is clearly visible in the projected ‘pressure’ map (Fig. 6 right) as a sudden increase and subsequent drop in the pressure by a factor of . To the SE of the subcluster core, the pressure is approximately constant for and then drops abruptly at larger radii. This could indicate that a contact discontinuity or cold front immediately precedes the subcluster rather than a shock (Markevitch et al. 2000; Vikhlinin et al. 2001; Markevitch & Vikhlinin 2007).
4.2 Projected & deprojected radial profiles
We obtained a more significant detection of the temperature and density changes across the surface brightness edges by extracting radial profiles in the NW and SE sectors (Fig. 7). The radial bins were positioned so as to determine the gas properties on either side of the surface brightness edges while maintaining a minimum of 3000 counts in each extracted spectrum. This lower limit ensured enough counts to provide a good spectral fit and constraints on the parameters. The steep decline in the cluster surface brightness in the outermost radial bins made it particularly difficult to constrain the outer gas properties. A wide outer radial bin from to was therefore required for the SE sector to determine the nature of the surface brightness edge in front of the dense core.
Spectra were extracted from the radial bins in each sector. Point sources were identified and excluded as detailed in section 3. The spectra were analysed in the energy range and grouped with a minimum of 30 counts per spectral bin. The background subtraction was particularly important for the regions outside the surface brightness edges where the flux is low. We compared the use of an on-chip background extracted from a source-free sector at the edge of the chip (Fig. 4) with a blank-sky background extracted from the data sets available from the CXC and normalized to the count rate in the high energy band . Although the use of a blank-sky background would account for spatial variations in the background count rate across the chip, this was estimated to be only a few per cent in the energy band . The differences between the blank-sky and on-chip backgrounds when extracted from the same source-free region were found to be more significant. The normalized blank-sky spectrum overestimated the background at low energies and underestimated the background count rate in the energy range by a factor of which significantly affected the temperature result in regions of low surface brightness. We therefore used a background spectrum extracted from the cluster-free sector at the edge of the chip for the spectral analysis. Response and ancillary response files were generated for each spectrum, weighted according to the number of counts between 0.5 and . These projected spectra were then fitted in xspec with an absorbed single temperature thermal plasma emission model phabs(mekal). The redshift was fixed to and the absorption was fixed to the Galactic value (Kalberla et al. 2005).
However, these projected spectra extracted from the cluster on the plane of the sky correspond to summed cross-sections of all the emission along the line of sight. A spectrum from the centre of a relaxed cluster will therefore contain a range of spectral components from the core to the cluster outskirts. To determine the properties of the cluster core these projected contributions from the outer cluster layers should be subtracted off the inner spectra by deprojecting the emission. However, deprojection routines require information about the line of sight extent of the cluster and generally assume that the cluster is spherically symmetric. While this is a reasonable assumption for a relaxed cluster, the highly irregular and elongated morphology of Abell 2146 clearly deviates from spherical symmetry. We have therefore compared the projected and deprojected spectra and discussed the validity of the assumption of spherical symmetry for each sector considered.
We used a straightforward model-independent spectral deprojection routine (dsdeproj; Sanders & Fabian 2007; Russell et al. 2008), which assumes spherical symmetry. dsdeproj starts from the background-subtracted spectrum extracted from the outermost annulus and assumes it was emitted from part of a spherical shell. This spectrum is scaled by the volume that is projected onto the next innermost shell (geometric factors from Kriss et al. 1983) and subtracted from the spectrum extracted from that annulus. In this way the deprojection routine moves inwards subtracting the contribution of projected spectra from each successive annulus to produce a set of deprojected spectra.
The deprojected spectra were also analysed in the energy range and grouped with a minimum of 30 counts per spectral bin. Appropriate response and ancillary response files were generated as before. The deprojected spectra were fitted in xspec with an absorbed mekal model and the parameters set as previously described for the projected spectra.
4.3 NW sector: upstream shock
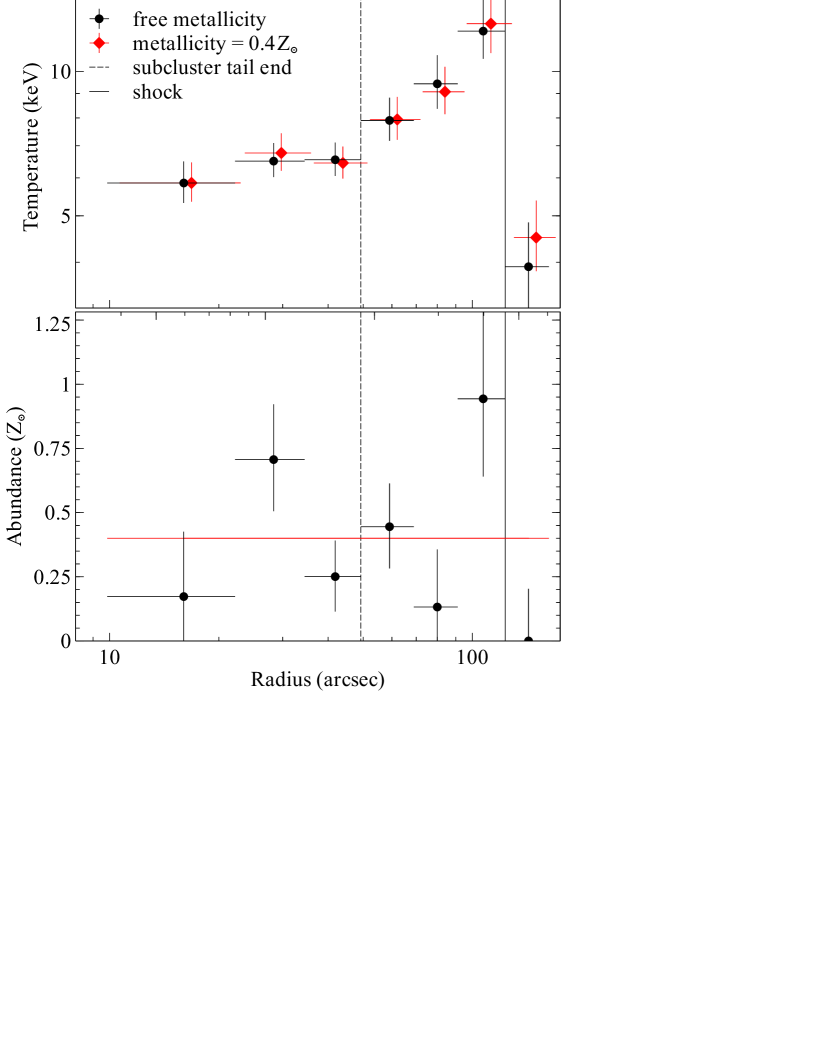
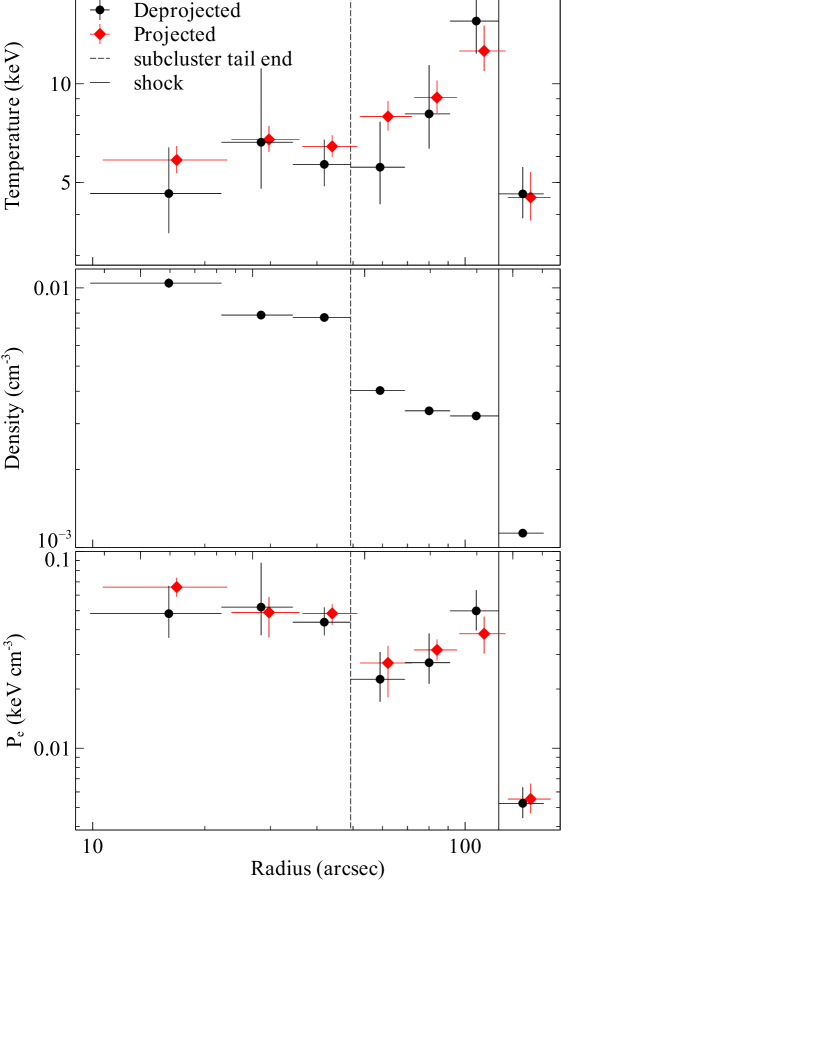
Figs. 8 and 9 show the projected and deprojected radial profiles for the NW sector of Abell 2146. The projected temperature is approximately constant at through the length of the ram pressure stripped trail of gas from the cool-core. Beyond a radius of () from the central AGN, marking the approximate end of the subcluster tail, the temperature increases steadily to a peak of at (). Then at the surface brightness edge the temperature plummets down to . The metallicity parameter was not well constrained by the spectral fits and the increase seen at is not significant. The sharp drop in the temperature at this radius is matched by a drop in the electron density shown by the deprojected profiles in Fig. 9 confirming that this is a shock.
The deprojection routine dsdeproj assumes spherical symmetry, which may not be reasonable given the cluster’s highly elongated morphology in this sector. However, the steep gradient of the surface brightness profile outside radius (Fig. 5) reduced the significance of the projected outer layers. The deprojected temperatures were therefore consistent with the projected temperatures to within the errors (Figs. 6 and 8). We used the deprojected results to analyse the shock at where the surface brightness contours tend toward circular at the shock edge. The elongated morphology and substructure of the subcluster tail, coupled with the shallow surface brightness gradient, made the deprojection of the surface brightness edge at much more difficult. For a good constraint on the temperature, a much greater number of X-ray counts is needed to facilitate the use of smaller radial bins in a narrower NW sector. The metallicity was poorly constrained in the deprojected annuli therefore this parameter was fixed to the average of determined from the spectral fits to the projected annuli.
There are two sharp drops in the deprojected electron density profile (Fig. 9) which correspond to the outer surface brightness edge at seen in Fig. 5 (right) and the subcluster tail end at . At a radius of , the density decreases by a factor of , which coincides with a temperature drop from down to confirming that this outer edge is a shock. By combining the deprojected temperature and electron density , we calculated the electron pressure (Fig. 9 bottom). As expected, there is a large decrease in pressure by factor of at the shock front.
The nature of the edge at the subcluster tail end () was more difficult to determine. The radial temperature bin outside the edge () is likely to contain some hotter gas from the outer shock edge in projection, biasing the projected temperature value high. The deprojected temperature in this radial bin is poorly constrained so it is unclear whether the subcluster tail ends in a shock or a cold front. The density decreases by a factor of producing a drop in the electron pressure by a factor of . The decrease in pressure across the surface brightness edge was not very significant primarily because of the poor constraints on the gas temperature.
Following Landau & Lifshitz (1959), we applied the Rankine-Hugoniot jump conditions across the shock at radius to calculate the Mach number, , where is the velocity of the pre-shock gas and is the velocity of sound in that gas. The Mach number can be calculated independently from the density jump,
| (1) |
or temperature jump,
| (2) |
where , and , denote the temperature and density before/upstream and after/downstream of the shock respectively. Here we assume the adiabatic index for a monatomic gas, . This may not be applicable if, for example, a significant amount of energy is lost in the acceleration of particles at the shock front.
At the NW shock, the density drops by a factor which, from equation 1, gives a Mach number . Using equation 2, the observed temperature drop of gives . These two independent calculations of the Mach number agree within the errors.
However, the sharp drop in surface brightness produced by the shock edge is superimposed on the underlying decay in the cluster surface brightness with radius. The relatively large radial bins used in this analysis to ensure a reliable calculation of temperature may therefore overestimate the density drop at the shock. If free-free emission dominates, the X-ray emissivity depends strongly on gas density and only weakly on temperature, permitting narrower radial bins for calculating the density. Since the ICM temperature in Abell 2146 only drops below in the cool subcluster core this is a reasonable assertion. We therefore deprojected the X-ray surface brightness profile, using small corrections for the temperature variation, and derived the electron density in narrower radial bins to more accurately calculate the density jumps across the shock edges.
The surface brightness profile was deprojected by assuming spherical symmetry and using the straightforward ‘onion-peeling’ method first described in Fabian et al. (1980). The background was subtracted using the region at large radii from the cluster as before (Fig. 4). The radial bins are slightly larger for the deprojected profile to ensure a similar number of counts at each radius. However, there were few data points above the background level outside the NW shock edge to constrain the upstream gas properties. Although there are ROSAT observations of Abell 2146, in the PSPC exposures of the field it is more than off axis and the HRI exposure of the cluster on axis does not detect the cluster outskirts with any significance. It was therefore not possible to verify the analysis of the outer cluster gas layers with ROSAT data.
The deprojected electron density was calculated from the xspec normalization for a phabs(mekal) model, where the total model flux was set equal to the deprojected surface brightness in each radial bin. The temperature parameter was set to the corresponding deprojected value determined from spectral fitting (Fig. 9 upper).
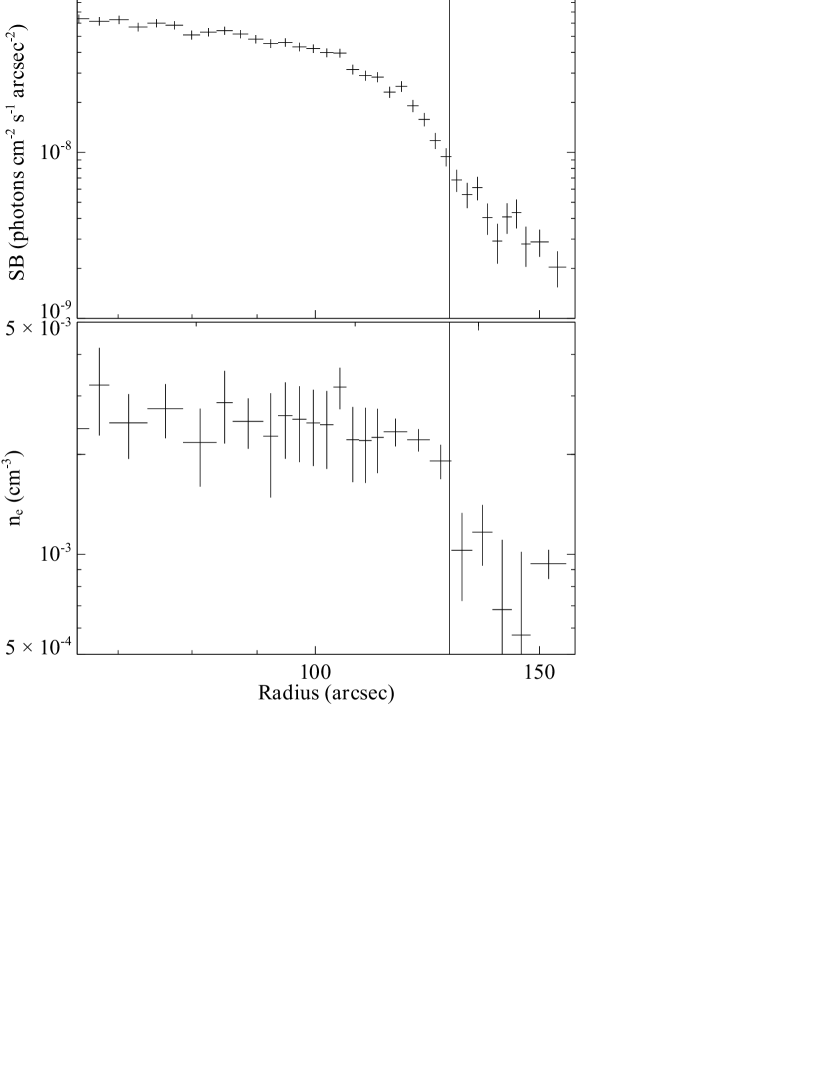
The projected surface brightness and deprojected electron density across the NW shock edge are shown in Fig. 10. Fig. 10 (lower panel) shows a drop in the gas density of across the shock edge. From equation 1, this gives a Mach number , lower than the spectral fitting result calculated from the density jump of . If we repeat the spectral deprojection, but with each radial bin split into two and the temperature parameters tied together in each pair, the Mach number calculated from the density also drops to .
We therefore conclude that the Mach number of the NW shock is closer to the lower value of calculated from the higher resolution spatial binning which more closely probes the shock. The sound speed in front of the shock is , where the gas temperature in front of the shock and the mean molecular weight of the medium . Therefore, for a Mach number of the shock velocity is .
4.4 SE sector: cold front & bow shock
The projected and deprojected radial profiles in temperature, density and electron pressure for the SE sector in front of the subcluster core are shown in Fig. 11. The assumption of spherical symmetry applied by dsdeproj was considered to be reasonable as the cluster appears approximately circular on the sky within this sector and the radial bins traced the surface brightness contours (Fig. 7). The metallicity was poorly constrained in the spectral fits and so was fixed to an average value of in this sector.
The subcluster core, analysed by the innermost radial bin, contains the lowest temperature, , and highest density gas, , in the cluster. The radiative cooling time of the gas was derived from the temperature and density
| (3) |
where is the cooling function, is the total number density of gas particles and is the number density of hydrogen. In the subcluster core the radiative gas cooling time drops to . Therefore it is likely to be a cool core remnant that is being ram pressure stripped in the merger.
The temperature of the gas increases rapidly in front of the subcluster core by a factor of . This jump coincides with the surface brightness edge at visible in Fig. 5 and a drop in the electron density by a factor of . The electron pressure is therefore approximately constant across this surface brightness edge. This edge is a cold front or contact discontinuity, similar to that found at the leading edge of the bullet in the Bullet cluster (Markevitch et al. 2002) and in other clusters such as Abell 2142 (Markevitch et al. 2000) and Abell 3667 (Vikhlinin et al. 2001).
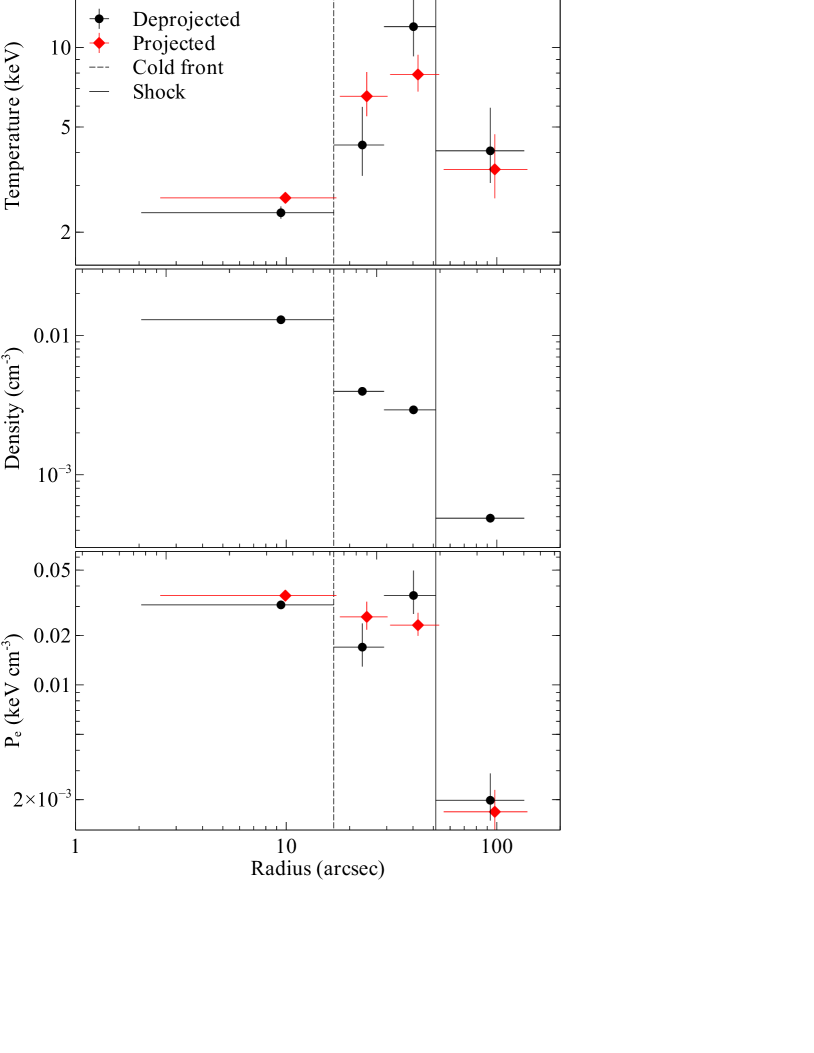
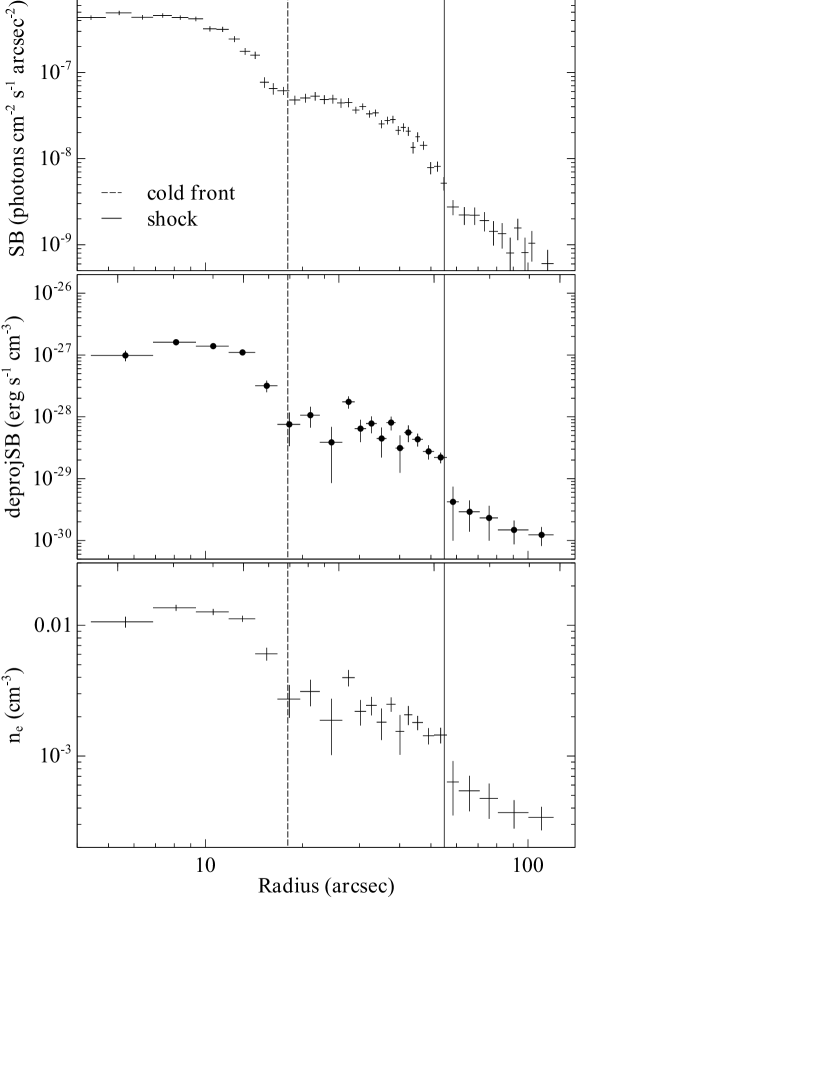
The gas properties at the outer edge at radius were more difficult to extract. The sharp drop in the cluster surface brightness necessitated a large outermost radial bin, which therefore did not allow constraints on the properties close to the edge. There is a very sharp drop in the electron pressure by a factor of at corresponding to a decrease by factors of and in temperature and density respectively. However, the Rankine-Hugoniot jump conditions (eq. 1) give a maximum possible density contrast across adiabatic shocks in a monatomic gas of a factor of four. This limit arises because as the strength of the shock is increased to higher Mach numbers the high thermal pressure building behind the shock limits the compression of the post-shock gas. The large radial bins ( and ) used for this analysis do not closely probe the gas properties across the shock edge. The underlying decline in the cluster density profile, which is significant in such a large radial region, is included in the calculation of the density change at the shock. This produces an overestimate of the density jump.
We have therefore also calculated the density jump by deprojecting the surface brightness profile across the shock. Fig. 12 shows the drop in surface brightness across the shock edge at radius corresponds to a drop in the gas density by a much lower factor of . Using equation 1, the Mach number of the SE bow shock is therefore . For a preshock temperature of , which gives a sound speed of , the shock velocity is . The subcluster is at a projected distance of roughly from the centre of the main cluster and, if we assume that the subcluster moves at the shock velocity (but see Springel & Farrar 2007), this implies that the subcluster passed through the centre of the main cluster approximately ago.
5 Discussion
By analysing the temperature and density of the gas on either side of the surface brightness edges, we have determined that the merging cluster Abell 2146 contains two shock fronts: a bow shock in front of the subcluster with and a slower upstream shock behind the main cluster with . We estimate that the subcluster passed through the centre of the main cluster approximately ago and is being ram pressure stripped of its material. The sharpness of the observed surface brightness edges (Fig. 5) suggests that Abell 2146 is oriented close to the plane of the sky. However, a measurement of the line of sight velocities for the subcluster and the main cluster galaxies using optical spectroscopy, combined with the Mach numbers, will give a quantitative constraint on the inclination of the merger axis.
Although Abell 2146 is a smaller system with a much lower global temperature, it appears remarkably similar in structure to the Bullet cluster (Markevitch et al. 2002; Markevitch 2006). Shock fronts are so rarely detected because the merger must be observed before the shock has moved to the outer, low surface brightness regions of the cluster and with a merger axis close to the plane of the sky so that projection effects do not conceal the surface brightness edges. It is therefore unsurprising that Abell 2146 appears similar to the Bullet cluster and is observed at a comparable time since core passage of the subcluster (both around ).
By choosing the brightest clusters to observe we will also preferentially select merging clusters in this short window of core passage. Merging clusters undergo a dramatic increase in luminosity and temperature as the cores collide, pushing them up the relation (Ricker & Sarazin 2001; Ritchie & Thomas 2002; Markevitch 2006). This boost is caused by the compression of the cluster cores during the merger and can be up to a factor of 10 for the luminosity in a head-on collision between two equal mass clusters. Statistically more likely collisions between clusters with higher mass ratios of 3:1 and 8:1 and low impact parameters (less than a few core radii) will still produce an increase in luminosity by a factor of and , respectively (Ricker & Sarazin 2001; Ritchie & Thomas 2002; Poole et al. 2007). However, this strong variation is relatively short-lived and disappears after approximately one sound crossing time. For a typical cool-core cluster, with a core radius of and temperature , the sound crossing time is only .
5.1 Mass ratio of the merging clusters
The key morphological difference between Abell 2146 and the Bullet cluster is the clear detection of an upstream shock. An upstream shock is generated as the gravitational potential minimum fluctuates rapidly during core passage (see eg. Roettiger et al. 1997; Gómez et al. 2002). The gravitational potential reaches an extreme minimum as the two cluster cores coalesce. This causes a significant amount of the outer cluster gas to flow inwards. The subcluster then exits the main core and the gravitational potential rapidly returns to its premerger level, which expels much of the newly arrived gas. The gas that is expelled in the upstream direction then collides with the residual infall from the subcluster and forms a shock propagating in the opposite direction to the subcluster.
For a higher mass ratio merger, such as the Bullet cluster (10:1; Clowe et al. 2004; Bradač et al. 2006; Clowe et al. 2006), the perturbation to the gravitational potential caused by the merger is smaller relative to the total potential and shorter in duration. The outer gas layers have less time to respond to the change in gravitational potential, which reduces the infall and strength of the subsequent outflow, producing only a weak upstream shock. In addition, there is relatively little residual infall from the wake of the small subcluster. Simulations of cluster mergers over a range of mass ratios have shown that the more dramatic variation in the gravitational potential during lower mass ratio mergers (less than 8:1; Roettiger et al. 1997) produces a stronger upstream shock (Roettiger et al. 1997; Ricker & Sarazin 2001; Poole et al. 2006).
The comparable strength of the bow and upstream shocks in Abell 2146 suggests that this mass ratio could be lower than 4:1. Closer to an equal mass ratio is unlikely because the predicted peak Mach number at core passage will then drop below the observed . We therefore argue that the subcluster and main cluster components of Abell 2146 are likely to have a mass ratio of 3 or 4:1. New Subaru Suprime-Cam observations of this cluster (PI Gandhi) will allow a more quantitative analysis of the mass.
5.2 Subcluster structure
As the subcluster passed through the core of the main cluster, its leading edge was compressed and swept back as the strong gravitational potential stripped away the gas. The local gas was pushed aside during core passage producing an elongation of the gas distribution perpendicular to the merger axis. For high mass ratio mergers, a ring of compressed gas forms when the small subcluster passes through the primary core (Roettiger et al. 1997; Poole et al. 2006). This can be clearly seen as a bar-like structure in the observations of the Bullet cluster (Markevitch 2006). Figs. 3 and 6 show an extended spur of cool gas at to the SW of the subcluster tail. This is likely to be stripped material from the subcluster and swept up gas from the main cluster. However, there does not appear to be a symmetric feature to the NE of the subcluster tail, although there is a suggestion of a smaller spur to the NE in Fig. 3. Simulations suggest that elongation perpendicular to the merger axis may be less evident in lower mass ratio mergers where the cores are similar sizes (Roettiger et al. 1997; Poole et al. 2006). A slightly off axis merger will also produce an asymmetrical distribution of swept up and stripped gas (Poole et al. 2006).
The bow shock visible in front of the subcluster core formed when the subcluster’s infall velocity exceeded the sound speed in the ambient cluster gas, . In principle, the Mach cone angle should be directly related to the Mach number of the shock. However, as has been found for Bullet cluster (Markevitch et al. 2002; Markevitch & Vikhlinin 2007), the subcluster is shrinking over time and decelerating in the gravitational potential of the main cluster. Therefore, in practice the subcluster cannot be approximated as a solid body moving at constant velocity. Springel & Farrar (2007) also found in their simulations of the Bullet cluster that the opening angle of the Mach cone was much wider than expected and cannot be easily used to independently determine the shock strength. For Abell 2146, we can only estimate the Mach cone angle from the narrow section of the bow shock that is easily discernable but it is clear that it is much broader than the expected for a shock (Fig. 1).
We might also expect that the stand-off distance between the bow shock and the subcluster is related to the Mach number, according to the approximate relation of Moeckel (1949)222Available at http://naca.central.cranfield.ac.uk/reports/1949/naca-tn-1921.pdf (see also Vikhlinin et al. 2001). This analysis requires measurements of the geometry of the projectile, which was particularly difficult to determine for the subcluster gas cloud. We estimated the half-width of the subcluster core to be , which for gives a predicted stand-off distance between the shock and the subcluster of . The observed distance is approximately . A similar result can be obtained for the Bullet cluster. The assumptions of a uniform preshock medium, constant velocities and a solid projectile are clearly not applicable for these merging subclusters.
Behind the subcluster, the ambient cluster gas that was pushed aside during its passage will fall back and produce tail shocks (eg. Roettiger et al. 1997; Poole et al. 2006). Fig. 9 shows a drop in density by a factor of at the approximate position of the tail end ( NW from the AGN). If this feature were a shock we would expect a corresponding jump in the temperature by a factor of . Despite the uncertainties in the temperature values (section 4.3) such a large decrease appears unlikely. Alternatively, this feature could be a cold front separating the cooler, ram pressure stripped material from the subcluster which is slowly falling back into the hotter main cluster gas. Although there is a decrease in the electron pressure across the front, the large uncertainties in the temperature value reduce the significance of this drop. A longer Chandra observation providing a more accurate measurement of the temperature could resolve this issue and allow constraints on the ICM transport processes across the shocks and cold fronts (eg. Markevitch 2006; Markevitch & Vikhlinin 2007).
The subcluster will also generate strong turbulence in its wake. Figs. 1 and 2 show complex structures in the ram pressure stripped material of the subcluster tail. The temperature map also suggests there could be substructures and smaller shocks inside the tail. The ram pressure stripped tail is considerably warmer () than the subcluster core where it originated (). This level of heating appears to be consistent with the results for the Bullet cluster where the subcluster core gas at is stripped and forms a tail of gas heated to (Markevitch et al. 2002; Million & Allen 2009). Along the surface of the bullet, Kelvin-Helmholtz and Rayleigh-Taylor instabilities are expected to develop and break up the subcluster, as has been observed in Abell 520 (Markevitch et al. 2005). The timescale for the destruction of the subcluster will also likely be influenced by magnetic fields which stabilize against these instabilities (eg. Jones et al. 1996; Vikhlinin et al. 2001). Fig. 13 shows an emission measure map of the cluster produced with the Contour binning algorithm (section 4.1) but with a lower signal-to-noise ratio of 15 giving better spatial resolution at the expense of larger errors (). The absorption parameter was fixed to the Galactic value and the abundance was fixed to for the spectral fitting. The finer spatial binning in Fig. 13 hints at possible substructure in the subcluster tail but a deeper Chandra observation is required to significantly detect any structure.
5.3 Location of the brightest cluster galaxy
In a merger event, the galaxies are effectively collisionless particles and therefore, along with the dark matter component, lead the X-ray gas on exiting the main cluster core. The X-ray gas is slowed as a result of the ram pressure from the interacting cluster cores. This is clearly observed in the Bullet cluster (eg. Clowe et al. 2006). However, Fig. 2 shows that while there are many galaxies leading the X-ray subcluster core in Abell 2146, the BCG is located immediately behind the X-ray peak.
Observations of the merging cluster Abell 168 also found that the subcluster cD galaxy lagged behind the cool gas peak (Hallman & Markevitch 2004). As the subcluster passes through the core of the primary, ram pressure pushes back the gas from the gravitational potential. Then as the subcluster enters the outer, less dense cluster gas, the ram pressure drops rapidly and the cool gas core rebounds and overshoots the subcluster dark matter peak in a ‘ram pressure slingshot’ (Hallman & Markevitch 2004; Mathis et al. 2005; Ascasibar & Markevitch 2006). The cD galaxy, which should trace the local gravitational potential, will then appear behind the subcluster’s cool core. However, this represents a late stage of the merger where the subcluster has reached its apocentre. For Abell 2146, this would occur (based on a mass ratio of 3:1, Poole et al. 2006) after the subcluster passes through the main cluster core and is therefore inconsistent with the estimated for the age of the merger. Although it was difficult to determine the location of the main cluster core from the existing observations, the prominence of the two shocks and the undisrupted subcluster core provides strong evidence against this being a late stage merger. Unambiguous detections of shock fronts are so rare because they can only be seen in the early stages of a merger, before the shock front has propagated to the low surface brightness outskirts of the cluster (Markevitch & Vikhlinin 2007).
The HST observation of Abell 2146 (contours shown in Fig. 2; Sand et al. 2005) shows that the BCG has a large halo of emission, which is extended along the merger axis and clearly traces the X-ray emission in the subcluster. The large diffuse envelope of the BCG may therefore be interacting with the surrounding X-ray gas. The BCG does not obviously appear to be disrupted by the merger event so it remains unclear why it is located in the wake of the subcluster cool core.
In an imaging survey with the Spitzer Space Telescope of 62 BCGs with optical line emission located in the cores of X-ray luminous clusters, Quillen et al. (2008) found that Abell 2146 has a high IR luminosity and the second highest rate of star formation in the sample at . O’Dea et al. (2008) found a correlation between the mass deposition rates estimated from X-ray observations of the sample and the IR star formation rates, where the star formation rate is of the mass deposition rate. This suggests that the cooling ICM is the source of the gas that is forming stars (see also Johnstone et al. 1987; McNamara et al. 2004; Hicks & Mushotzky 2005; Rafferty et al. 2006; Salomé et al. 2006). However, in Abell 2146, the high star formation rate of is times greater than our estimated mass deposition rate of . This high rate of star formation in the BCG could have been triggered by the cluster merger and this will be explored in a future paper.
5.4 Limits on diffuse radio emission
The connection between cluster mergers and the presence of diffuse, steep spectrum radio sources has been extensively investigated (Tribble 1993; Roettiger et al. 1999; Brunetti et al. 2009) so we have searched the radio survey data around Abell 2146 to determine a limit to any diffuse emission. Unfortunately, Abell 2146 is just below the X-ray luminosity limit set by Venturi et al. 2007 for their GMRT survey so no targetted radio imaging at frequencies below exists. However, if we take the observed upper bound for radio halo power from Brunetti et al. 2009 for a cluster with the X-ray luminosity of Abell 2146 () we would expect a halo or relic that is weaker than at .
Inspecting the VLSS , WENSS and NVSS survey data and archival VLA databases, we find two unresolved sources detected in WENSS, NVSS and VLA images. One is coincident with the BCG and is detected at at with a spectral index of -0.43. The other is associated with a probable cluster member that is at with a spectral index of -0.48. These two sources are blended in WENSS catalog but the total flux density is consistent with the sum of the two point source components. Inspecting the noise in these maps we calculate flux density limits of , and at 74, 327 and respectively for any diffuse emission on scales of . Therefore, a radio halo a factor of around two below that expected from other comparable systems is consistent with the current observations irrespective of the spectral index. A deep eVLA or GMRT observation is required to improve on this limit.
6 Conclusions
The Chandra observation of Abell 2146 has revealed a merging system where a ram pressure stripped subcluster has recently passed through and disrupted the primary cluster core. From the X-ray temperature and surface brightness maps, we found a bow shock propagating in front of the cool subcluster and calculated a Mach number from the density jump across the shock. The subcluster velocity is therefore and we estimated that the subcluster passed through the main cluster core ago. In addition, there is a factor of drop in the electron pressure in the outskirts of the main cluster indicating the presence of a upstream shock. There are potentially further shocks and a cold front in the gas tail behind the subcluster but these features could not be confirmed with the existing data.
Although Abell 2146 is a smaller and cooler system than the Bullet cluster, it appears similar in structure and to be at a comparable merger epoch of since core passage. This can be understood as a selection effect: shock fronts can only be detected at this early stage in the merger evolution before they have propagated to the outer, low surface brightness regions of the cluster. The merger axis must also be close to the plane of the sky so that projection effects do not conceal the surface brightness edges.
Based on the measured shock Mach numbers of and the strength of the upstream shock, we estimate a mass ratio between the two merging clusters of around 3 or 4:1. Forthcoming Subaru observations of Abell 2146 will allow a more quantitative analysis of the mass distribution between the two clusters. We compared the Chandra observation with an archival HST observation and found that while there is a group of galaxies located in front of the X-ray subcluster core, the brightest cluster galaxy is located immediately behind the X-ray peak. A future weak lensing analysis coupled with galaxy velocities along the line of sight from optical spectroscopy could help to explain the galaxy cluster dynamics.
Acknowledgements
We acknowledge support from the Science and Technology Facilities Council (HRR) and the Royal Society (ACF). Support for this work was provided by the National Aeronautics and Space Administration through Chandra Award Number GO0-11012B issued by the Chandra X-ray Observatory Center, which is operated by the Smithsonian Astrophysical Observatory for and on behalf of the National Aeronautics Space Administration under contract NAS8-03060. We thank the referee for helpful comments.
References
- Anders & Grevesse (1989) Anders E., Grevesse N., 1989, Geochim. Cosmochim. Acta, 53, 197
- Arnaud (1996) Arnaud K. A., 1996, in Astronomical Society of the Pacific Conference Series, Vol. 101, Jacoby G. H., Barnes J., ed, Astronomical Data Analysis Software and Systems V, p. 17
- Ascasibar & Markevitch (2006) Ascasibar Y., Markevitch M., 2006, ApJ, 650, 102
- Balucinska-Church & McCammon (1992) Balucinska-Church M., McCammon D., 1992, ApJ, 400, 699
- Belsole et al. (2004) Belsole E., Pratt G. W., Sauvageot J., Bourdin H., 2004, A&A, 415, 821
- Belsole et al. (2005) Belsole E., Sauvageot J., Pratt G. W., Bourdin H., 2005, A&A, 430, 385
- Blandford & Eichler (1987) Blandford R., Eichler D., 1987, Phys. Rep., 154, 1
- Böhringer et al. (2000) Böhringer H. et al., 2000, ApJS, 129, 435
- Bradač et al. (2006) Bradač M. et al., 2006, ApJ, 652, 937
- Brunetti (2003) Brunetti G., 2003, in Astronomical Society of the Pacific Conference Series, Vol. 301, S. Bowyer & C.-Y. Hwang , ed, Astronomical Society of the Pacific Conference Series, p. 349
- Brunetti et al. (2009) Brunetti G., Cassano R., Dolag K., Setti G., 2009, A&A, 507, 661
- Buote (2001) Buote D. A., 2001, ApJ, 553, L15
- Clowe et al. (2006) Clowe D., Bradač M., Gonzalez A. H., Markevitch M., Randall S. W., Jones C., Zaritsky D., 2006, ApJ, 648, L109
- Clowe et al. (2004) Clowe D., Gonzalez A., Markevitch M., 2004, ApJ, 604, 596
- Fabian et al. (1980) Fabian A. C., Willingale R., Pye J. P., Murray S. S., Fabbiano G., 1980, MNRAS, 193, 175
- Feretti (2005) Feretti L., 2005, in L. O. Sjouwerman & K. K. Dyer , ed, X-Ray and Radio Connections, held in February 2004, Santa Fe, New Mexico, USA
- Feretti et al. (2002) Feretti L., Gioia I. M., Giovannini G., ed, 2002, Astrophysics and Space Science Library, Vol. 272, Merging Processes in Galaxy Clusters
- Freeman et al. (2002) Freeman P. E., Kashyap V., Rosner R., Lamb D. Q., 2002, ApJS, 138, 185
- Fusco-Femiano et al. (1999) Fusco-Femiano R., dal Fiume D., Feretti L., Giovannini G., Grandi P., Matt G., Molendi S., Santangelo A., 1999, ApJ, 513, L21
- Fusco-Femiano et al. (2005) Fusco-Femiano R., Landi R., Orlandini M., 2005, ApJ, 624, L69
- Gómez et al. (2002) Gómez P. L., Loken C., Roettiger K., Burns J. O., 2002, ApJ, 569, 122
- Hallman & Markevitch (2004) Hallman E. J., Markevitch M., 2004, ApJ, 610, L81
- Henry & Briel (1995) Henry J. P., Briel U. G., 1995, ApJ, 443, L9
- Henry & Briel (1996) Henry J. P., Briel U. G., 1996, ApJ, 472, 137
- Hicks & Mushotzky (2005) Hicks A. K., Mushotzky R., 2005, ApJ, 635, L9
- Johnstone et al. (1987) Johnstone R. M., Fabian A. C., Nulsen P. E. J., 1987, MNRAS, 224, 75
- Jones et al. (1996) Jones T. W., Ryu D., Tregillis I. L., 1996, ApJ, 473, 365
- Kaastra (1992) Kaastra J. S., 1992, in Internal SRON-Leiden Report, updated version 2.0
- Kalberla et al. (2005) Kalberla P. M. W., Burton W. B., Hartmann D., Arnal E. M., Bajaja E., Morras R., Pöppel W. G. L., 2005, A&A, 440, 775
- Kempner & David (2004) Kempner J. C., David L. P., 2004, MNRAS, 349, 385
- Kriss et al. (1983) Kriss G. A., Cioffi D. F., Canizares C. R., 1983, ApJ, 272, 439
- Landau & Lifshitz (1959) Landau L. D., Lifshitz E. M., 1959, Fluid mechanics. Oxford, Pergamon Press
- Liedahl et al. (1995) Liedahl D. A., Osterheld A. L., Goldstein W. H., 1995, ApJ, 438, L115
- Markevitch (2006) Markevitch M., 2006, in ESA Special Publication, Vol. 604, A. Wilson , ed, The X-ray Universe 2005, p. 723
- Markevitch et al. (2004) Markevitch M., Gonzalez A. H., Clowe D., Vikhlinin A., Forman W., Jones C., Murray S., Tucker W., 2004, ApJ, 606, 819
- Markevitch et al. (2002) Markevitch M., Gonzalez A. H., David L., Vikhlinin A., Murray S., Forman W., Jones C., Tucker W., 2002, ApJ, 567, L27
- Markevitch et al. (2005) Markevitch M., Govoni F., Brunetti G., Jerius D., 2005, ApJ, 627, 733
- Markevitch et al. (2000) Markevitch M. et al., 2000, ApJ, 541, 542
- Markevitch et al. (1999) Markevitch M., Sarazin C. L., Vikhlinin A., 1999, ApJ, 521, 526
- Markevitch & Vikhlinin (2007) Markevitch M., Vikhlinin A., 2007, Phys. Rep., 443, 1
- Markevitch et al. (1996) Markevitch M. L., Sarazin C. L., Irwin J. A., 1996, ApJ, 472, L17
- Mathis et al. (2005) Mathis H., Lavaux G., Diego J. M., Silk J., 2005, MNRAS, 357, 801
- McNamara et al. (2004) McNamara B. R., Wise M. W., Murray S. S., 2004, ApJ, 601, 173
- Mewe et al. (1985) Mewe R., Gronenschild E. H. B. M., van den Oord G. H. J., 1985, A&AS, 62, 197
- Mewe et al. (1986) Mewe R., Lemen J. R., van den Oord G. H. J., 1986, A&AS, 65, 511
- Million & Allen (2009) Million E. T., Allen S. W., 2009, MNRAS, 399, 1307
- Moeckel (1949) Moeckel W. E., 1949, Approximate method for predicting the form and location of detached shock waves ahead of plane or axially symmetric bodies, NACA TN 1921
- O’Dea et al. (2008) O’Dea C. P. et al., 2008, ApJ, 681, 1035
- Poole et al. (2007) Poole G. B., Babul A., McCarthy I. G., Fardal M. A., Bildfell C. J., Quinn T., Mahdavi A., 2007, MNRAS, 380, 437
- Poole et al. (2006) Poole G. B., Fardal M. A., Babul A., McCarthy I. G., Quinn T., Wadsley J., 2006, MNRAS, 373, 881
- Pratt et al. (2009) Pratt G. W., Croston J. H., Arnaud M., Böhringer H., 2009, A&A, 498, 361
- Quillen et al. (2008) Quillen A. C. et al., 2008, ApJS, 176, 39
- Rafferty et al. (2006) Rafferty D. A., McNamara B. R., Nulsen P. E. J., Wise M. W., 2006, ApJ, 652, 216
- Randall et al. (2008) Randall S. W., Markevitch M., Clowe D., Gonzalez A. H., Bradač M., 2008, ApJ, 679, 1173
- Rephaeli et al. (1999) Rephaeli Y., Gruber D., Blanco P., 1999, ApJ, 511, L21
- Ricker & Sarazin (2001) Ricker P. M., Sarazin C. L., 2001, ApJ, 561, 621
- Ritchie & Thomas (2002) Ritchie B. W., Thomas P. A., 2002, MNRAS, 329, 675
- Roettiger et al. (1999) Roettiger K., Burns J. O., Stone J. M., 1999, ApJ, 518, 603
- Roettiger et al. (1997) Roettiger K., Loken C., Burns J. O., 1997, ApJS, 109, 307
- Russell et al. (2008) Russell H. R., Sanders J. S., Fabian A. C., 2008, MNRAS, 390, 1207
- Salomé et al. (2006) Salomé P. et al., 2006, A&A, 454, 437
- Sand et al. (2005) Sand D. J., Treu T., Ellis R. S., Smith G. P., 2005, ApJ, 627, 32
- Sanders (2006) Sanders J. S., 2006, MNRAS, 371, 829
- Sanders & Fabian (2007) Sanders J. S., Fabian A. C., 2007, MNRAS, 381, 1381
- Sarazin (2001) Sarazin C. L., 2001, in D. M. Neumann & J. T. V. Tran , ed, Clusters of Galaxies and the High Redshift Universe Observed in X-rays
- Springel & Farrar (2007) Springel V., Farrar G. R., 2007, MNRAS, 380, 911
- Struble & Rood (1999) Struble M. F., Rood H. J., 1999, ApJS, 125, 35
- Tribble (1993) Tribble P. C., 1993, MNRAS, 263, 31
- Venturi et al. (2007) Venturi T., Giacintucci S., Brunetti G., Cassano R., Bardelli S., Dallacasa D., Setti G., 2007, A&A, 463, 937
- Vikhlinin et al. (2001) Vikhlinin A., Markevitch M., Murray S. S., 2001, ApJ, 551, 160