Evidence for Delayed Massive Star Formation in the M17 Proto-OB Association
Abstract
Through analysis of archival images and photometry from the Spitzer GLIMPSE and MIPSGAL surveys combined with 2MASS and MSX data, we have identified 488 candidate young stellar objects (YSOs) in the giant molecular cloud M17 SWex, which extends pc southwest from the prominent Galactic H II region M17. Our sample includes YSOs with masses M☉ that will become B-type stars on the main sequence. Extrapolating over the stellar initial mass function (IMF), we find that M17 SWex contains young stars, representing a proto-OB association. The YSO mass function is significantly steeper than the Salpeter IMF, and early O stars are conspicuously absent from M17 SWex. Assuming M17 SWex will form an OB association with a Salpeter IMF, these results reveal the combined effects of (1) more rapid circumstellar disk evolution in more massive YSOs and (2) delayed onset of massive star formation.
Subject headings:
circumstellar matter — ISM: clouds — stars: formation — stars: luminosity function, mass function1. Introduction
Elmegreen & Lada (1976) discovered an extended molecular cloud associated with the well-known Galactic H II region M17. The size ( pc at kpc), mass ( M☉; Elmegreen et al., 1979), and fragmentary morphology of this cloud were reminiscent of the largest Galactic OB associations. Elmegreen & Lada (1976) suggested that an extended OB association will eventually form near M17, and they noted an apparent progression of ages among the known OB populations, H II regions, and molecular cloud cores across the complex. The M17 complex became an observational touchstone for the theory of sequential triggered massive star formation by propagating ionization fronts (Elmegreen & Lada, 1977).
While the M17 H II region itself and the interface between the ionization front and the massive molecular core known as M17 SW have remained the focus of intense study (Chini & Hoffmeister, 2008, and references therein), interest in the extended molecular cloud, which we name M17 SWex (since M17 SW is ambiguous), has gradually waned. M17 SWex lacks very massive stars; a handful of low-luminosity compact and ultracompact H II regions have been identified, but they are insufficiently powerful to trigger massive star formation throughout the cloud (Elmegreen et al., 1979; Jaffe & Fazio, 1982).
M17 SWex presents one of the most striking infrared dark cloud (IRDC) morphologies in the Galaxy, revealed in great detail by the Spitzer Space Telescope as part of the Galactic Legacy Infrared Mid-Plane Survey Extraordinaire (GLIMPSE; Benjamin et al., 2003) and the Multiband Imaging Photometer for Spitzer Galactic Plane Survey (MIPSGAL; Carey et al., 2009). IRDCs have been the subject of much recent work because they are laboratories for studying the initial conditions for massive (OB stars, M☉) star formation (Rathborne et al., 2006; Beuther & Sridharan, 2007; Butler & Tan, 2009).
In this Letter, we use archival GLIMPSE and MIPSGAL data to find and characterize individual young stellar objects (YSOs) throughout the extent of M17 SWex. We model the mass function of the YSO population and find that it bears the imprints of both mass-dependent circumstellar disk evolution and delayed massive star formation in M17 SWex.
2. Data Analysis and Modeling
2.1. Selection of Candidate YSOs By SED Fitting of GLIMPSE Catalog Sources
The infrared (IR) spectral energy distributions (SEDs) of YSOs are dominated by emission from dusty circumstellar disks and infalling envelopes. For details on our procedure for identifying candidate YSOs we refer the reader to Povich et al. (2009, hereafter P09) and Smith et al. (2010). Here we summarize the main analysis steps. Using a -minimization SED fitting tool (Robitaille et al., 2007), we fit reddened Kurucz (1993) stellar atmospheres (varying from 0 to 40 mag) to the SEDs of 64,820 sources in the highly-reliable GLIMPSE Point Source Catalog located within a field encompassing M17 SWex. Only sources detected in of the 7 Catalog bands (–8 m) were fit. The best-fit stellar atmosphere model was a poor fit (; is the goodness-of-fit parameter) for 1498 sources; hence they are possible YSOs.
We then filtered out sources with IR excess emission appearing in only the IRAC [5.8] or [8.0] bands using the Smith et al. (2010) color criteria, modified to de-redden the colors of background stars viewed through the M17 SWex cloud (using the extinction law of Indebetouw et al., 2005). This step was necessary to distinguish intrinsically red objects from sources affected by systematic photometric errors; IRAC [5.8] and [8.0] are less sensitive and more affected by nebular emission compared to IRAC [3.6] and [4.5]. We discarded 592 sources, leaving 906 candidate YSOs in our initial sample.
2.2. Constraints on SED Models from MIPS 24 m Aperture Photometry
We fit YSO model SEDs from Robitaille et al. (2006, hereafter RW06) to the
available IR photometry
of each candidate YSO in the initial sample to constrain luminosity, mass,
and evolutionary stage (Stage 0/I, dominated by infalling envelope;
Stage II, optically thick circumstellar disk; Stage III, optically
thin disk; or Ambiguous; see P09). Photometry at
m is required to constrain bolometric
luminosities and often to distinguish Stage 0/I from
Stage II sources (RW06; Indebetouw et al., 2007).
We located the position of each
YSO candidate in a MIPSGAL 24 m enhanced mosaic (Carey et al., 2009) and extracted fluxes using aperture photometry.
We compared the
aperture photometry results to fluxes extracted via PSF
fitting with the GLIMPSE pipeline for
a subset of sources
and found excellent agreement for aperture radius
3.5″ with background annulus 7″ to 13″.
This choice of aperture required an aperture
correction
of 2.8.111MIPS Instrument Handbook v1.0,
http://ssc.spitzer.caltech.edu/mips/mipsinstrumenthandbook/
Aperture photometry detected more 24 m sources than PSF fitting. For the of sources lacking 24 m detections we placed upper limits, a useful constraint for the SED fitting. The brightest of sources were saturated in the MIPSGAL images; for these we treated the extracted fluxes as lower limits. For the 24 m detections we set the minimum uncertainty to 15% to avoid overly weighting the 24 m flux in the model fits in case of residual systematic uncertainties. The results of our aperture photometry are presented in Table 1. One potential source of systematics is the mid-IR extinction law for m. Recent work has found similar reddening at both 24 m and 8 m in dense molecular clouds (e.g. Flaherty et al., 2007). We used the high-density () mid-IR extinction law of McClure (2009) when fitting the RW06 models to the SEDs of our initial YSO sample.
2.3. MSX Detections of Luminous Candidate YSOs
We incorporate 8–21 m photometry from the MSX Galactic Plane Survey Point Source Catalog (Price et al., 2001) into our YSO sample in 2 ways: (1) Spatial correlation of MSX sources with the initial YSO sample and (2) visual identification of bright sources located near the IRDCs in the GLIMPSE and MIPSGAL mosaics that were excluded from the the GLIMPSE Catalog due to saturation. Moderately saturated sources were included in the more complete GLIMPSE Point Source Archive, and we added 15 MSX sources with Archive matches to the initial YSO sample. The of the YSO sample with MSX counterparts (indicated in Table 1), include the most luminous YSOs in the cloud. The MSX data provide strong constraints on the mid-IR SEDs along with replacements for Spitzer measurements suffering from saturation at 8.0 or 24 m.
2.4. Removal of Contaminants from the YSO Sample
In addition to YSOs, the initial sample may contain the following classes of contaminants: variable stars, dusty asymptotic giant branch (AGB) stars, unresolved planetary nebulae, and background galaxies. The SEDs of variable stars and many AGB stars cannot be fit by stellar atmospheres or YSO models; 15% of the initial sample were discarded for this reason. Of the remaining contaminants, luminous AGB stars are the most important, as they can masquerade as massive YSOs (P09). The majority of AGB stars have mag (Whitney et al., 2008), and applying this color cut removes an additional 5% of sources.
While we expect YSOs associated with M17 SWex to be clustered, contaminating sources, including foreground YSOs, will be distributed uniformly. Following P09, we used a cluster-finding algorithm to select sources exhibiting a significant degree of clustering with respect to a “control” region located away from the molecular cloud. The control field sampled was a box centered at with source density 270 deg-2, yielding a similar average source separation () to the P09 control field. The surface density ratio between the control field and the entire field is , which shows that M17 SWex presents a significantly larger overdensity of candidate YSOs versus contaminants compared to the M17 molecular cloud sample analyzed by P09. We thereby split the initial sample into a clustered population () comprised of YSOs associated with M17 SWex and a distributed component () dominated by unassociated contaminants.
3. Results
3.1. Final YSO Sample
| Cat. | GLMA | [24]aaTypical uncertainty on [24] is mag. | ccIf M☉ yr-1, accretion has effectively ceased, hence is undefined. | 4.5 m | ||||||||
|---|---|---|---|---|---|---|---|---|---|---|---|---|
| No. | Name | (mag) | bb24 m quality flag: 0=non-extraction, 1=detection, 2=lower limit, 3=upper limit. | (L☉) | (L☉) | (M☉) | (M☉) | (M☉ yr-1) | (M☉ yr-1) | Stage | MSX? | Excess? |
| 200 | G014.1482-00.5321 | 7.7 | 1 | 0.7 | 0.3 | 1.3 | 0.6 | -5.9 | 2.6 | II | ||
| 201 | G014.1491-00.5550 | 6.1 | 1 | 1.5 | 0.2 | 2.6 | 0.9 | -5.2 | 2.4 | A | ||
| 202 | G014.1494-00.5081 | 6.4 | 3 | 2.1 | 1.2 | 3.5 | 0.9 | -5.7 | 2.4 | II | ||
| 203 | G014.1508-00.6084 | 3.3 | 1 | 2.7 | 0.7 | 3.9 | 2.5 | -4.2 | 1.7 | A | ||
| 204 | G014.1519-00.5650 | 6.0 | 1 | 1.1 | 0.8 | 1.1 | 1.0 | -4.7 | 2.1 | 0/I | ||
| 205 | G014.1520-00.5173 | 0.6 | 2 | 3.6 | 0.4 | 8.4 | 1.5 | -3.2 | 1.5 | 0/I | ✓ | |
| 206 | G014.1524-00.6234 | 6.1 | 1 | 1.8 | 0.2 | 2.8 | 0.3 | -7.2 | 2.9 | II | ||
| 207 | G014.1525-00.5661 | 6.1 | 1 | 1.7 | 1.1 | 1.2 | 0.9 | -3.7 | 0.6 | 0/I | ✓ | |
| 208 | G014.1528-00.5048 | 5.8 | 1 | 1.5 | 0.9 | 1.6 | 1.5 | -4.0 | 1.8 | 0/I | ✓ | |
| 209 | G014.1530-00.5209 | 5.3 | 1 | 1.8 | 0.2 | 2.8 | 0.6 | -5.5 | 2.4 | II | ||
| 210 | G014.1532-00.5061 | 6.1 | 3 | 1.5 | 0.9 | 2.3 | 0.4 | -4.0 | 0.1 | 0/I | ||
| 211 | G014.1542-00.5467 | 7.3 | 1 | 1.1 | 0.7 | 1.9 | 1.0 | -5.9 | 2.6 | II | ||
| 212 | G014.1549-00.5666 | 4.7 | 1 | 1.5 | 0.9 | 1.0 | 1.1 | -4.3 | 1.8 | 0/I | ✓ | |
| 213 | G014.1552-00.5169 | 3.6 | 1 | 1.9 | 1.1 | 2.8 | 1.4 | -4.1 | 1.9 | 0/I | ||
| 214 | G014.1557-00.4774 | 5.8 | 1 | 1.6 | 1.0 | 2.2 | 1.1 | -4.8 | 2.1 | A |
Note. — Table 1 is available in its entirety in the electronic edition of the Astrophysical Journal Letters. A portion is reproduced here for guidance regarding its form and content.
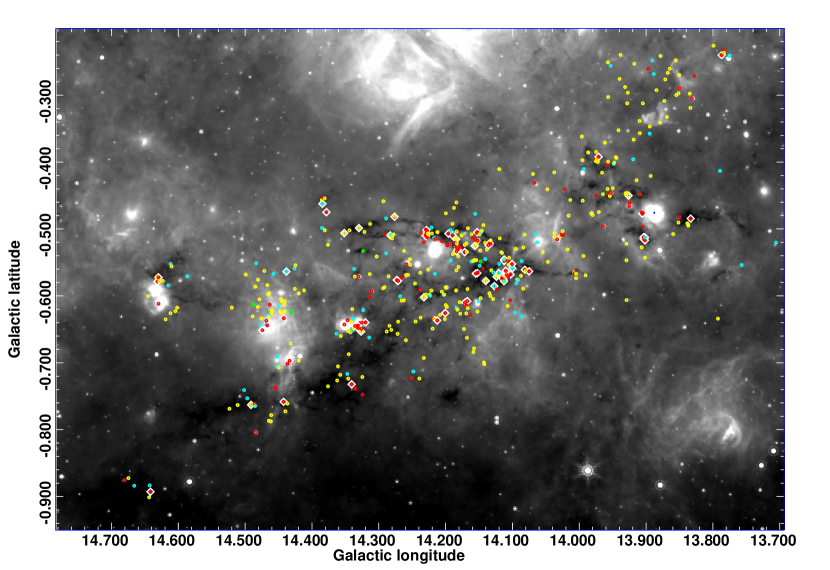
The clustered population of 488 sources comprises our final YSO sample. The YSOs exhibit a highly structured spatial distribution, strongly clustered along the IRDC filaments with numerous sub-clusters (Fig. 1). Using the set of well-fit models for each YSO (defined by ), we construct probability distributions of bolometric luminosity , mass of central star , and evolutionary stage (see P09 for details). We allowed the model fitting tool to accept a range of distances from 1.9 to 2.3 kpc, hence incorporating the uncertain distance to the M17 complex into the uncertainties on the resultant model parameters (P09). The results for each source are summarized in Table 1. The final sample includes 133 Stage 0/I, 276 Stage II, 4 Stage III, and 75 YSOs with ambiguous stage. The paucity of Stage III objects is a selection effect and suggests that virtually all of the ambiguous sources are ambiguous between Stages 0/I and II. Stage 0/I objects are more tightly clustered than are Stage II, supporting the idea that the stages represent an evolutionary sequence. The high fraction of Stage 0/I sources () confirms the extreme youth of the population.
Among the final sample, 68 YSOs exhibit excess 4.5 m emission over the best-fit YSO model. These may be unresolved analogs of the “extended green objects” (EGOs), candidate accretion-powered young massive stellar outflows (Cyganowski et al., 2008). The RW06 models do not include outflows, which can produce strong molecular line emission in the 4.5 m band. We set the 4.5 m fluxes to upper limits for the SED fitting in these cases. The majority of 4.5 m excess sources are associated with tight clusters of Stage 0/I YSOs (Fig. 1 and Table 1). Two such groups coincide with known EGOs (G014.33-0.64 and G014.63-0.58; Cyganowski et al., 2008).
3.2. Observed YSO Mass Function
Given the GLIMPSE sensitivity limits and the 2.1 kpc distance to M17, our YSO sample is nearly complete for M☉, corresponding to main-sequence spectral types earlier than A0 (P09). For this mass range, the pre-main-sequence evolutionary tracks are horizontal (Bernasconi & Maeder, 1996; Siess et al., 2000), and YSOs follow the zero-age main sequence mass–luminosity relation (Kang et al., 2009).
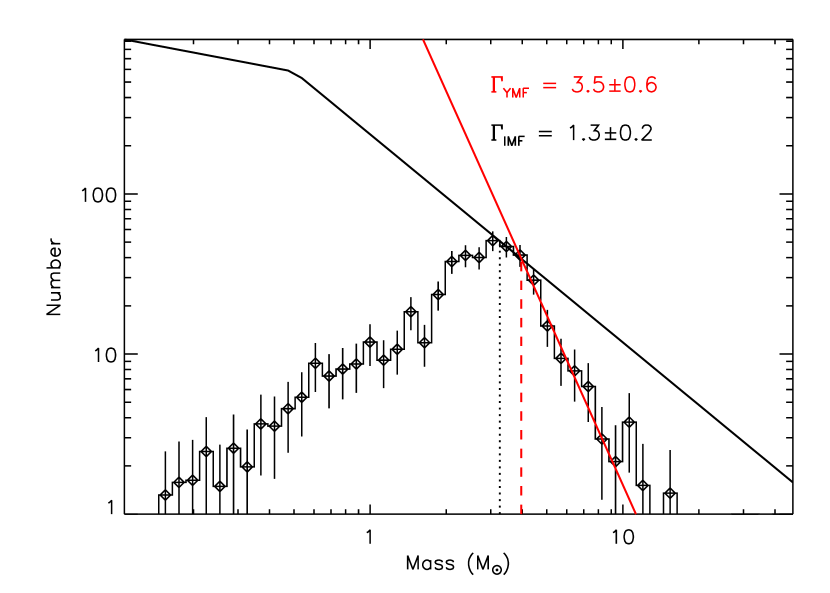
Summing the probability distributions of from the model fits to each YSO, we construct the YSO mass function (YMF; P09) for the 488 sources in our final sample (Fig. 2). The YMF has the same form as the stellar initial mass function (IMF),
| (1) |
where is the number of stars in the (logarithmic) mass interval and is the power-law “slope” (Bastian et al., 2010). Measurements of the IMF over a wide variety of environments, from young open clusters to field stars, have found the slope to be remarkably consistent with the Salpeter (1955) IMF, for M☉ (Kroupa, 2001). The YMF slope, however, is significantly steeper; above a critical mass, M☉. The YMF apparently flattens to for 3.2 M☉ before turning over due to incompleteness at lower masses (Fig. 2). Such a steep slope translates into a glaring deficit of massive stars; the YMF contains YSOs equivalent to main-sequence B stars ( M☉) but zero O stars ( M☉), and OB stars with are missing compared to the predictions of a Salpeter–Kroupa IMF.
4. Discussion
4.1. YSO Mass Spectrum Parameterization
Assuming a Salpeter–Kroupa IMF applies to M17 SWex, the steep YMF slope can be understood in terms of evolution and selection effects. Our sample is populated by ongoing star formation and includes only YSOs with circumstellar material (disks). We parameterize these effects using the linear form of the mass function, the mass spectrum,
| (2) |
(Bastian et al., 2010). The YSO mass spectrum is populated over time as
| (3) |
where is the time since star formation began in the cloud, is the star formation rate (SFR) in mass interval , and is the time at which star formation began for each mass interval. Assuming for simplicity that the SFR is not time-dependent, and the integral in Equation 3 becomes
| (3a) |
where is the fraction of stars that have already formed versus all stars that will eventually form in each mass interval. In the limiting cases of (first stars to form in cloud) or (timescale for differential onset of star formation small compared to age of population), and .
The YSO sample is further biased by disk evolution. Taking to be the disk lifetime as a function of mass,
| (4) |
where is the (mass-dependent) disk fraction. For , .
4.2. Implications of a Steepened YSO Mass Function: Disk Evolution, Delayed Massive Star Formation, or Both?
We have shown that a steep YMF could be produced by delayed formation of massive stars or by shorter disk lifetimes for more massive stars. Both interpretations have physical basis. Can either of these effects alone explain the observed YMF?
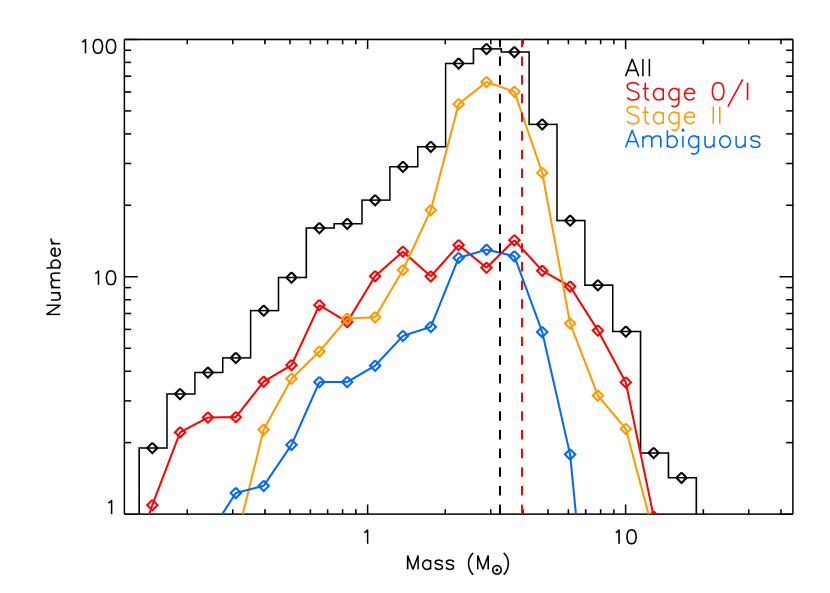
Disk evolution. The YMF is broken down by evolutionary stage in Fig. 3, and it is apparent that the steep slope is driven by Stage II sources. We thus consider the case of disk evolution alone: , (Equation 6). Hernandez et al. (2007) measured the disk fractions in the Orionis cluster (age Myr) to be for M☉ and for M☉, giving . This does not rule out disk evolution as the primary driver of the YMF slope, given the uncertainties, but the disk lifetimes themselves, which set the duration of the Stage II phase, become problematically short. Adopting and M☉ Myr (Haisch et al., 2001), we would predict M☉ Myr. This is comparable to the typical duration of the envelope-accretion phase in low-mass stars ( Myr; Kenyon & Hartmann, 1995). The Stage 0/I objects in our sample span a wide range in mass (Fig. 3), yet the typical accretion timescale is similarly Myr (, where is the accretion rate in the RW06 models; see Table 1 and P09). We expect the maximum age of a 4 M☉ Stage II source in our sample to be Myr ( at M☉; Fig. 3). This longer, more realistic disk lifetime implies .
Delayed Massive Star Formation. Since disk evolution alone cannot explain the observed YMF, delayed massive star formation must also contribute (). While diskless low- and intermediate-mass stars are lost among the overwhelming field star population in the IR images, massive stars cannot easily hide within a dense molecular cloud. The Kroupa (2001) IMF, scaled to match the YMF peak (Fig. 2), predicts O stars, including at least one early O star ( M☉); such stars ionize dusty compact and ultracompact H II regions. The few H II regions in M17 SWex (visible as compact, bright extended sources in Fig. 1) are insufficiently luminous to contain O stars (Elmegreen et al., 1979; Jaffe & Fazio, 1982). We note also that the ratio steadily decreases with for M☉ and actually inverts for M☉ (Fig. 3), suggesting that the more massive YSOs are preferentially younger. This is not a firm result, however, because it is based on sources, and the trend may instead reflect instability of disks around massive YSOs.
While the data presented here do not support more than simple parameterizations, we can constrain the delay timescale for the most massive stars: M☉. If the YMF break at M☉ (Fig. 2) is real, not an artifact of incompleteness, then , hence (Equation 5), and Myr (Equation 4) is age of the oldest YSOs in the cloud.
4.3. Present-Day Star Formation Rate
Integrating the scaled Kroupa (2001) IMF (Fig. 2) over M☉ yields a total population of YSOs in M17 SWex, with a total stellar mass of M☉. Elmegreen & Lada (1976) predicted that M17 SWex would eventually form an OB association; these numbers, lower limits due to possible incompleteness, show that the M17 proto-OB association is already forming. Adopting Myr, the present-day SFR in M17 SWex is 0.011 M☉ yr-1, comparable to the time-averaged SFR of M17 itself (P09), albeit distributed over a much larger volume.
4.4. Sequential Star Formation in the M17 Complex
Elmegreen et al. (1979) compared the morphology of the M17 complex to the dust lanes and “beads-on-strings” H II regions of extragalactic spiral structure. P09 discovered an extended, diffuse H II region northeast of M17, called M17 EB, ionized by a group of optically revealed O stars in a 2–5 Myr old cluster or association. When M17 SWex is included, the entire M17 complex presents a clear sequence of star formation extending pc parallel to the Galactic midplane and spanning several Myr in age. As Elmegreen & Lada (1976) noted, Galactic spiral density waves propagate in the direction of decreasing age. The difference between the Galactic rotation speed and the spiral pattern speed at the location of M17 is (Brand & Blitz, 1993; Martos et al., 2004). The timescale for a spiral shock to cross the entire M17 complex is Myr, the same order of magnitude as the observed age spread.
The rapid passage of the M17 complex through the Sagittarius spiral arm served as the “global” trigger ultimately responsible for the formation of this large OB association. Has sequential “local” triggering driven by OB stars (Elmegreen & Lada, 1977) played an important role? While there is strong circumstantial evidence for locally triggered star formation on the periphery of the M17 and M17 EB H II regions (P09 and references therein), it remains unclear whether any of the major OB clusters were similarly triggered. Global triggering appears to be a far more likely explanation for the formation of the proto-OB association in M17 SWex. The Myr spread in ages among the YSO sample is small compared to the 2–3 Myr timescale for sequential triggering by OB stars (Elmegreen & Lada, 1977). The spatial distribution of both the stars and the dust (Fig. 1) suggest a disturbed molecular cloud that is experiencing global collapse and fragmentation.
5. Summary
We have catalogued 488 predominantly intermediate-mass YSOs in M17 SWex. Analysis of our YSO sample yields the following main results:
-
•
M17 SWex will form B stars. The total stellar population in the cloud is , with total stellar mass M☉. The present-day SFR is M☉ yr-1. M17 SWex is therefore forming a proto-OB association.
-
•
O stars are conspicuously absent. The YMF slope is significantly steeper than Salpeter for M☉.
-
•
Disk evolution proceeds more rapidly for higher-mass stars, with typical disk lifetimes of Myr for YSOs with M☉.
-
•
Massive stars begin forming at later times than low-mass stars. M17 SWex probably has not yet formed its most massive star, predicted to be an early O-type star of M☉.
If a Myr delay in the onset of massive star formation is the rule in Galactic giant molecular clouds, the best places to study the initial conditions of massive star formation may be clouds where intermediate-mass star formation has already begun.
References
- Bastian et al. (2010) Bastian, N. Covey, K. R., & Meyer, M. R. 2010, ARA&A, in press (astro-ph/1001.2965)
- Benjamin et al. (2003) Benjamin, R.A. et al. 2003, PASP, 115, 953
- Bernasconi & Maeder (1996) Bernasconi, P. A. & Maeder, A. 1996, A&A, 307, 829
- Beuther & Sridharan (2007) Beuther, H. & Sridharan, T. K. 2007, ApJ, 668, 348
- Brand & Blitz (1993) Brand, J. & Blitz, L. 1993, A&A, 275, 67
- Butler & Tan (2009) Butler, M. J. & Tan, J. C. 2009, ApJ, 696, 484
- Carey et al. (2009) Carey, S. J. et al. 2009, PASP, 121, 76
- Chini & Hoffmeister (2008) Chini, R. & Hoffmeister, V. 2008, Handbook of Star Forming Regions, Volume II, B. Reipurth, ed., San Francisco: ASP Monograph Publications p. 625
- Cyganowski et al. (2008) Cyganowski, C. J. et al. 2008, AJ, 136, 2391
- Elmegreen & Lada (1976) Elmegreen, B. G. & Lada, C. J. 1976, AJ, 81, 12
- Elmegreen & Lada (1977) Elmegreen, B. G. & Lada, C. J. 1977, ApJ, 214, 725
- Elmegreen et al. (1979) Elmegreen, B. G., Lada, C. J., & Dickinson, D. F. 1979, ApJ, 230, 415
- Flaherty et al. (2007) Flaherty, K. M. et al. 2007, ApJ, 663, 1069
- Haisch et al. (2001) Haisch, K. E., Lada, E. A., & Lada, C. J. 2001, AJ, 121, 2065
- Hernandez et al. (2007) Hernández, J. et al. 2007, ApJ, 662, 1067
- Indebetouw et al. (2005) Indebetouw, R. et al. 2005, ApJ, 619, 931
- Indebetouw et al. (2007) Indebetouw, R. et al. 2007, ApJ, 666, 321
- Jaffe & Fazio (1982) Jaffe, D. T. & Fazio, G. G. 1982, ApJ, 257, L77
- Kang et al. (2009) Kang, M., Bieging, J. H., Povich, M. S., & Lee, Y. 2009, ApJ, 706, 83
- Kenyon & Hartmann (1995) Kenyon, S. J. & Hartmann, L. 1995, ApJS, 101, 117
- Kroupa (2001) Kroupa, P. 2001, MNRAS, 322, 231
- Kurucz (1993) Kurucz, R. 1993, ATLAS9 Stellar Atmosphere Programs and 2 km/s grid. Kurucz CD-ROM No. 13. Cambridge, MA: Smithsonian Astrophysical Observatory
- Martos et al. (2004) Martos, M., Hernandez, X., Yáñez, M., Moreno, E., & Pichardo, B. 2004, MNRAS, 350, L47
- McClure (2009) McClure, M. 2009, ApJ, 693, L81
- Price et al. (2001) Price, S. D., Egan, M. P., Carey, S. J., Mizuno, D. R., and Kuchar, T. A. 2001, AJ, 121, 2842
- Povich et al. (2009) Povich, M. S. et al. 2009, ApJ, 696, 1278 (P09)
- Rathborne et al. (2006) Rathborne, J. M., Jackson, J. M., & Simon, R. 2006, ApJ, 641, 389
- Robitaille et al. (2006) Robitaille, T. P., Whitney, B. A., Indebetouw, R., Wood, K., & Denzmore, P. 2006, ApJS, 167, 256 (RW06)
- Robitaille et al. (2007) Robitaille, T. P., Whitney, B. A., Indebetouw, R., & Wood, K. 2007, ApJS, 169, 328
- Salpeter (1955) Salpeter, E. E. 1955, ApJ, 121, 161
- Smith et al. (2010) Smith, N. et al. 2010, MNRAS, in press
- Siess et al. (2000) Siess, L., Dufour, E., & Forestini, M. 2000, A&A, 358, 593
- Whitney et al. (2008) Whitney, B. A. et al. 2008, AJ, 136, 18