Magnetism, structure, and charge correlation at a pressure-induced Mott-Hubbard insulator-metal transition
Abstract
We use synchrotron x-ray diffraction and electrical transport under pressure to probe both the magnetism and the structure of single crystal NiS2 across its Mott-Hubbard transition. In the insulator, the low-temperature antiferromagnetic order results from superexchange among correlated electrons and couples to a (1/2, 1/2, 1/2) superlattice distortion. Applying pressure suppresses the insulating state, but enhances the magnetism as the superexchange increases with decreasing lattice constant. By comparing our results under pressure to previous studies of doped crystals we show that this dependence of the magnetism on the lattice constant is consistent for both band broadening and band filling. In the high pressure metallic phase the lattice symmetry is reduced from cubic to monoclinic, pointing to the primary influence of charge correlations at the transition. There exists a wide regime of phase separation that may be a general characteristic of correlated quantum matter.
pacs:
71.30.+h, 75.30.Kz, 61.05.cp, 64.75.QrI Introduction
One of the great challenges of understanding correlated materials is teasing apart the relative influences of the spin, charge, orbital, and lattice degrees of freedom. The point where an insulator becomes a metal highlights acutely the competition between mechanisms, but it also affords a special opportunity to limn the pertinent physics when different routes across the phase transition are available. Going back to the original ideas of Mott and Hubbard, we know that strong Coulomb repulsion between electrons on a single lattice site can localize charge even when band theory predicts metallic behavior 2 ; 6 , and antiferromagnetism was attributed to a consequence of superexchange between localized electrons 24 . At the same time, Slater claimed that antiferromagnetism alone could account for the formation of the insulating gap 3 . All can be subsumed by symmetry changes wrought by a structural phase transition 5 .
The cubic pyrite crystal NiS2 has long been recognized as a canonical Mott-Hubbard correlated insulator 6 ; 7 ; 9 ; 10 ; 13 ; 14 ; 15 . Band structure calculations 14 put the sulfur band and Ni band well below the half filled Ni band, pointing to on-site Coulomb repulsion as the source of the insulating energy gap , which lies in the range 1-10 meV (Ref. [15, ]). The small size of this gap demonstrates that NiS2 is an incipient Mott insulator 13 with the Coulomb repulsion comparable to the bandwidth, = 2.1 eV (Ref. [14, ]). The gap can be suppressed either by Se doping 7 ; 11 ; 12 or applied pressure 16 ; 17 ; 19 , but the scale of the pressure required to drive the gap to zero in the pure limit has introduced technical obstacles to systematic studies of the competition between electronic, magnetic, and structural correlations at the quantum phase transition. Doping with Se expands the lattice and reduces the Ni bandwidth 2 ; 7 , and the transition in this case is thought to be driven by increasing charge transfer between the Ni and Se bands 6 . Applying pressure tunes the ratio and provides a more direct approach to the Mott-Hubbard model.
We use synchrotron x-ray diffraction and electrical transport in a diamond anvil cell to parse the roles of the low temperature antiferromagnetism and the lattice structure, both through the insulating state and at the transition to the metal in the Mott-Hubbard system, NiS2. The reduced symmetry in the metal to monoclinic - a highly unusual occurrence for correlated materials described below - eliminates the change in the structure as a likely origin of the delocalization of charge. By comparison of the pressure-induced transition in the pure compound to the insulator-metal transition driven by chemical substitution of Se for S, we identify the charge degrees of freedom as the predominant driving mechanism. Realizing the insulator-metal transition in high quality single crystals of a stoichiometric material using applied pressure further clarifies the physics by avoiding complications that arise from chemical disorder, most notably the competition between Anderson localization and the Mott transition.
II Experimental Methods
High-pressure single-crystal x-ray diffraction measurements were carried out at beamlines 4-ID-D and 6-ID-B of the Advanced Photon Source. In a vertical scattering geometry with a psi-diffractometer, a high q-resolution (FWHM ) is achieved using a 50 size detector slits positioned 1.3 m away from the sample along the arm 29 . The use of double-bounce Pd mirrors for 20 keV x-rays and an energy discriminating NaI scintillation detector eliminated higher-harmonic contamination of the diffraction signal. Our single crystals were grown by the Te flux method to remove potential complications from excess impurity concentrations 11 . Crystals were 25 to 50 in diameter and fit well within the diamond anvil cell pressure chamber. Five different crystals were studied under pressure using a methanol:ethanol 4:1 mixture for the pressure medium. Base temperature varied between 3.5 and 5.8 K, and the pressure was calibrated in situ using silver diffraction 29 .
The problem of vacancies, common to sulfides, is well characterized 10 in NiS2. Both S (about 4%) and Ni (varying) vacancies can be determined from the measured lattice constants and electrical resistivity; in this way we estimate our sample stoichiometry to be NiS1.96. There are two coexisting antiferromagnetic structures in NiS2. The M1 antiferromagnetic order with a wavevector (1, 0, 0) emerges from a second order phase transition at = 37 to 54 K, where strongly depends on vacancy concentration and varies from sample to sample (i.e. Ref. [9, ]). The M2 antiferromagnetic order has a (1/2, 1/2, 1/2) wavevector and emerges at a first order transition at K, where the transition temperature is consistent across all published reports including those for different vacancy concentrations. However, vacancies are responsible for the variable canting angle in an antiferromagnet 30 , as observed in the M2 phase of NiS2 (Ref. [9, ; 10, ]).
III Antiferromagnetism at ambient and high pressures
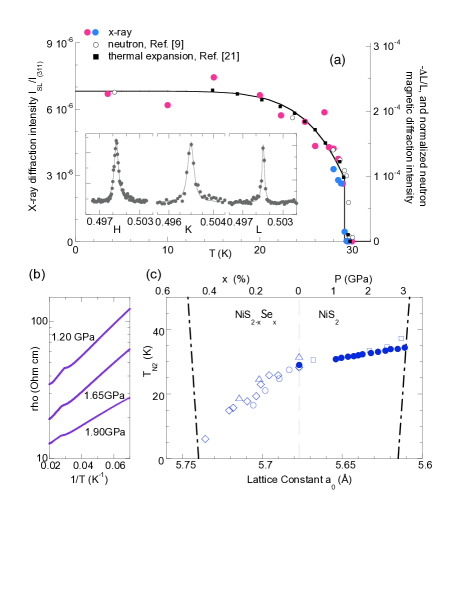
One outstanding question in the field of Mott-Hubbard systems concerns the role of period doubling antiferromagnetism at the insulator-metal transition. The magnetostrictive response of the lattice to M2 is likely rhombohedral 20 and the distortion from cubic symmetry is extremely small, with a relative lattice constant change (Ref. [21, ]). Therefore, for our diffraction measurements, we were able to model the insulating ground state using a cubic matrix. At ambient pressure and we report the discovery of charge-originated superlattice diffraction peaks at (1/2, 1/2, 1/2)-type positions in reciprocal space (Fig. 1), corresponding to the M2 magnetic structure. Given the compatibility of diamond anvil cell technology with high energy x-ray diffraction, this opens up the possibility of combined magnetic and structural studies of the pressure-driven Mott-Hubbard transition in pure NiS2. The temperature dependence of the superlattice intensity (Fig. 1a) scales linearly with the magnetic M2 neutron diffraction intensity 9 . The x-ray supperlattice and neutron M2 diffraction intensities scale quadratically with the superlattice displacement and also the magnetic moment, respectively. The scaling in Fig. 1a thus points to a linear coupling between the M2 magnetic moment and the superlattice displacement. A linear coupling between magnetism and the lattice is rather common in solids, and most often observed in low-dimensional systems 22 . By comparison, the external magnetostriction 21 ; 32 , measured by the linear thermal expansion, scales quadratically with the M2 magnetic moment (Fig. 1a).
The intensity of the superlattice peaks provides a quantitative estimate of lattice distortion through the relation , where is the superlattice ordering wavevector and and are the atomic form factors at the superlattice and (3, 1, 1) positions, respectively. Given the domain degeneracy in each superlattice order and uncertainty over the direction of , we evaluate by averaging the direction of superlattice displacement uniformly over the full solid angle. Further averaging was carried out over the four (1/2, 1/2, 1/2)-type superlattice domains. In this way we estimate , which is a factor of smaller than the lattice constant . Using a value for the lattice force constant appropriate to pyrite-structured transition metal dichalcogenides ( N/cm = 6.25 eV/ , Ref. [23, ]), we estimate that the elastic energy associated with the superlattice distortion is approximately 0.017 meV per Ni atom. This is at least two orders of magnitude smaller than the insulating gap and the magnetic exchange coupling, and we therefore consider the superlattice to be a minimally intrusive representation of the underlying magnetic order. We also point out that the superlattice distortion cannot account for the insulating behavior. For a wide band model appropriate to NiS2 () both the lattice and electronic energies scale as , and we need only confirm that net quadratic coefficient is positive. Using Eq. (3.54) of Ref. [5, ] and inserting appropriate values we find that the quadratic coefficient lies in the range 2.4 - 3.1 eV/. Rather than coupling to the formation of an energy gap, the superlattice is likely driven by the variation in exchange constant with Ni ion displacement 22 .
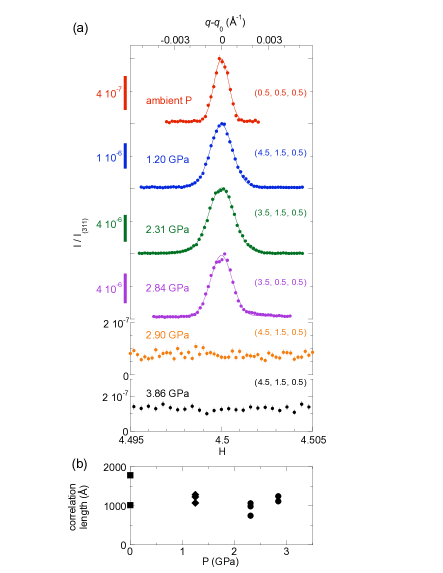
Using the superlattice reflections as a measure of the M2 order, we are able to track the magnetism and the crystal lattice through the pressure-driven insulator-metal transition. The only high-pressure magnetic scattering study published to date by Panissod et al. (Ref. [16, ]) was limited to GPa at 4.2 K with no disappearance of antiferromagnetism observed. This study identified the insulator-metal phase boundary with a suspected lattice discontinuity at GPa, leading to the conclusion that the magnetism is continuous across the insulator-metal transition 16 . Here we observe the (1/2, 1/2, 1/2)-type superlattice distortion at every pressure from 0 to 2.84 GPa (Fig. 2a) at base temperature. Above 2.84 GPa the superlattice vanishes in all samples (Fig. 2c-d). Published accounts 17 ; 19 and our own transport measurements place the critical pressure for the insulator-metal phase boundary in the range 2.2 - 3.1 GPa. This range brackets the upper limit of the observed superlattice diffraction. It is therefore natural to conclude that the disappearance of the low temperature M2 magnetic state, the structural phase transition (see below), and the insulator-metal transition all coincide at GPa.
The relationship between the correlated insulator and M2 antiferromagnetism is further revealed by considering the phase boundary as a function of lattice constant for both NiS2 under pressure and NiS2-xSex in the P-x-T phase diagram (Fig. 1c). Antiferromagnetic coupling of correlated electrons results from superexchange through the S ligand fields 24 . This coupling grows stronger as the lattice constant is reduced 2 , whether by chemical substitution or by applied pressure, continuing smoothly and continuously across the substitution-pressure interface. For the NiS2-xSex(, ) system, increases as the lattice constant shrinks, consistent with the superexchange interaction. The M2 magnetism and the associated superlattice distortion should be considered as byproducts of electron correlation and are not by themselves responsible for driving the insulating state. Important evidence for this also comes from electrical resistivity data which show that the Arrhenius activation energy is unchanged on cooling through (Fig. 1b). The insulating energy gap is thus well established before the formation of the M2 phase, reflecting the fact that the energy scales of the charge and magnetic interactions are well separated. The Hubbard is comparable to the Ni bandwidth eV, the magnetic exchange coupling is comparable to the transition temperature meV, and the superlattice distortion energy scale is an even smaller 0.02 meV.
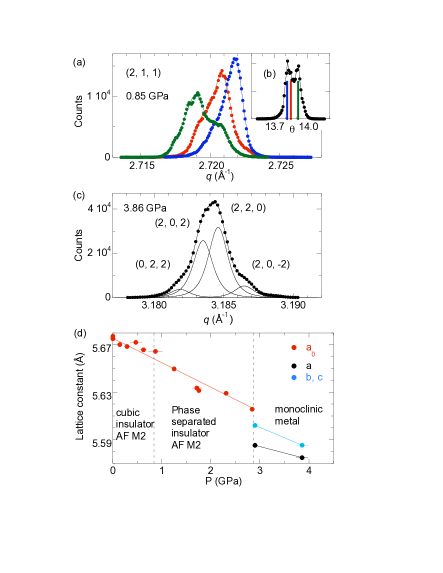
Careful study of the lattice structure reveals additional information about the nature of the transition. High-resolution - longitudinal scans at all orders of the superlattice reflection are consistently close to resolution-limited (Fig. 2a), giving M2 correlation lengths greater than 1000 Å(Fig. 2b). This is consistent for all pressures within the phase boundary. For the fcc lattice peaks, longitudinal scans (Fig. 3) reveal a more complicated picture. All measured lineshapes are resolution-limited for GPa. However, beginning at 0.85 GPa we observe multiple splitting of diffraction peaks in almost every sample at every pressure. This indicates the emergence of structural domains of reduced symmetry. Importantly, the superlattice reflections remain resolution limited before disappearing entirely above 2.84 GPa (Fig. 2a). The contrast between the multiply-split fcc Bragg peaks and the sharp superlattice reflections is proof of phase coexistence between 0.85 GPa and 2.84 GPa. We note that the onset of the high-pressure structural phase that we observe at 0.85 GPa may explain the phase boundary at GPa claimed in previous neutron scattering work 16 .
IV lattice structure under pressure
The crystal symmetry of the high-pressure metallic phase can be determined either with single crystal refinement of a single-domain specimen or with powder refinement of a polycrystalline sample with full knowledge of symmetry split peaks. We identified a single-domain sample in the high pressure phase at 2.9 GPa. Six diffraction orders were measured and a least-squares refinement reveals an almost monoclinic structure with lattice parameters (to a 95% confidence level) = 5.5852(22) Å, Å, = 89.984(8)o, = 89.930(18)o, and = 89.967(13)o. The values of and () measured at = 2.9 GPa are consistent with measurements at 3.86 GPa (Fig. 3), where the four-fold splitting of the (2, 2, 0) peak only can be explained by a symmetry of monoclinic or lower. Constraining the symmetry to monoclinic, we obtain (to a 95% confidence level) = 5.5748(9) Å, Å, at 3.86 GPa. The four-fold splitting of (2, 1, 1) at 0.85 GPa (Fig. 3) is consistent with this picture, as it cannot be explained by a single phase of symmetry higher than monoclinic.
Notably, symmetry reduction on passing into the metallic phase is the opposite of what is observed in many other transition metal oxides including the prototypical Mott-Hubbard system V2O3, which is a rhombohedral metal and a monoclinic insulator. For a non-interacting bandstructure, a reduction of lattice symmetry favors insulating behavior 5 ; 6 . The observation here for NiS2 that the symmetry is reduced in the metal therefore emphasizes the role played by electron correlations in the insulator.
V Conclusion
Our results address longstanding debates over the role of magnetism and crystal structure at the insulator-metal transition 2 ; 3 ; 5 ; 6 ; 31 , while at the same time raising questions about quantum phase transitions in the presence of strong electron correlations. The broad regime of phase coexistence that we observe while tuning adds to a growing list of correlated electron systems that exhibit phase coexistence around a first order quantum phase transition 25 . We have established that the magnetic, superexchange interaction cannot account for electron localization in the insulator and that strong electron correlations drive the insulator-metal transition even in the presence of a structural distortion. Magnetotransport measurements in the compressed metal are required to probe the evolution and gapping of the Fermi surface, as well as the role of quantum fluctuations, as the transition is approached from above.
Acknowledgements.
We are grateful to D. Robinson and J.-W. Kim for technical support at 6-ID-B of the Advanced Photon Source, and to X. Yao for growth of the crystals. The work at the University of Chicago was supported by NSF Grant No. DMR-0907025. Use of the Advanced Photon Source was supported by the U.S. DOE-BES, under Contract No. NEAC02-06CH11357.References
- (1) N. F. Mott and Z. Zinamon, Rep. Prog. Phys. 33, 881 (1970).
- (2) M. Imada, A. Fujimori, and Y. Tokura, Rev. Mod. Phys. 70, 1039 (1998).
- (3) P. W. Anderson, Phys Rev. 115, 2 (1959).
- (4) J. C. Slater, Phys. Rev. 82, 538 (1951); T. Moriya and K. Ueda, Rep. Prog. Phys. 66, 1299 (2003).
- (5) D. Adler, Rev. Mod. Phys. 40, 714 (1968).
- (6) Y. Feng et al., Rev. Sci. Instrum. 81, 041301(2010).
- (7) X. Yao et al., Phys. Rev. B 54, 17469 (1996); J.M. Honig and J. Spałek, Chem. Mater. 10, 2910 (1998).
- (8) J. A. Wilson and G. D. Pitt, Philo. Mag. 23, 1297 (1971).
- (9) T. Miyadai et al., J. Phys. Soc. Jap. 38, 115 (1975).
- (10) G. Krill et al., J. Phys. C 9, 761 (1976).
- (11) D. W. Bullett, J. Phys. C 15, 6163 (1982).
- (12) R. L. Kautz, M. S. Dresselhaus, D. Adler, A. Linz, Phys. Rev. B 6, 2078 (1972).
- (13) Q. Si, E. Abrahams, J. Dai, and J.-X. Zhu, New J. Phys. 11, 045001 (2009).
- (14) S. Sudo, J. Mag. Mag. Mat. 114, 57 (1992); H. S. Jarrett et al., Mat. Res. Bull. 8, 877 (1973).
- (15) Y. Sekine et al., Physica B 237, 148 (1997); N. Takeshita et al., arXiv:0704.0591 (2007).
- (16) P. Panissod, G. Krill, C. Vettier, and R. Madar, Solid State Comm. 29, 67 (1979).
- (17) N. Mori and H. Takahashi, J. Mag. Mag. Mat. 31, 335 (1983).
- (18) P.-G. de Gennes, Phys. Rev. 118, 141 (1960).
- (19) T. Thio, J. W. Bennett, and T. R. Thurston, Phys. Rev. B 52, 3555 (1995).
- (20) H. Nagata, H. Ito, and T. Miyadai, J. Phys. Soc. Jap. 41, 444 (1976).
- (21) R. Werner, C. Gros, and M. Braden, Phys. Rev. B 59, 14356 (1999).
- (22) E.R. Callen and H.B. Callen, Phys. Rev. 129, 578 (1963).
- (23) H. D. Lutz, J. Himmrich, B. M ller, and G. Schneider. J. Phys. Chem. Solids 53, 815 (1992).
- (24) J. Spałek, A. Datta, and J.M. Honig, Phys. Rev. Lett 59, 728 (1987).
- (25) Y. J. Uemura et al., Nature Phys. 3, 29 (2007).