Star Formation Signatures in Optically Quiescent Early-type Galaxies
Abstract
In recent years argument has been made that a high fraction of early-type galaxies in the local universe experience low levels () of star formation (SF) that causes strong excess in UV flux, yet leaves the optical colors red. Many of these studies were based on GALEX imaging of SDSS galaxies (), and were thus limited by its FWHM. Poor UV resolution left other possibilities for UV excess open, such as the old populations or an AGN. Here we study high-resolution far-ultraviolet HST/ACS images of optically quiescent early-type galaxies with strong UV excess. The new images show that three-quarters of these moderately massive () early-type galaxies shows clear evidence of extended SF, usually in form of wide or concentric UV rings, and in some cases, striking spiral arms. SDSS spectra probably miss these features due to small fiber size. UV-excess early-type galaxies have on average less dust and larger UV sizes ( kpc) than other green-valley galaxies, which argues for an external origin for the gas that is driving the SF. Thus, most of these galaxies appear ‘rejuvenated’ (e.g., through minor gas-rich mergers or IGM accretion). For a smaller subset of the sample, the declining SF (from the original internal gas) cannot be ruled out. SF is rare in very massive early-types (), a possible consequence of AGN feedback. In addition to extended UV emission, many galaxies show a compact central source, which may be a weak, optically inconspicuous AGN.
Subject headings:
galaxies: evolution—ultraviolet: galaxies—galaxies: elliptical and lenticular, cD1. Introduction
In this paper we present a discovery of significantly extended regions of star formation in some early-type galaxies (ETGs)–galaxies usually thought to lie on the passive side of galaxy bimodality. Bimodality in terms of morphology and color has been known since the earliest studies of galaxies, but it was not until the massive datasets of the Sloan Digital Sky Survey (SDSS) that fuller implications in terms of galaxy evolution became evident (Strateva et al., 2001; Kauffmann et al., 2003). Optical colors reflect the mean age of stellar populations and are therefore sensitive only to high levels of continuous SF (Kauffmann et al., 2007). If the SFR per unit stellar mass (specific SFR) drops below some threshold, optical colors become uniformly red and SDSS photometry cannot distinguish a truly passive galaxy from one that also contains a young population. These limitations are alleviated when ultraviolet (UV) photometry, dominated by young stars, is available. Early results from GALEX showed that a surprisingly high fraction (15%) of optically red SDSS ETGs exhibit strong UV excess (Yi et al., 2005). Rich et al. (2005) found strong far-UV (FUV) excess even when selecting ETGs with no H emission in SDSS spectra. Is this UV excess due to star formation, as assumed by Yi et al. (2005); Kaviraj et al. (2007, 2009)? While SF and molecular gas have been studied in nearby early-type galaxies for some time (e.g., Bregman et al. 1992), their significance as a possible phase in galaxy evolution or a mode of galaxy growth requires the large samples we have today. Before considering such far-reaching implications one must ask whether other explanations for the UV flux exist? After all, nearby ellipticals are known to exhibit a moderate UV excess (the “UV upturn”, Code 1969), that comes from old stars (presumably hot horizontal branch), and not massive young stars (Greggio & Renzini, 1990). Also, a continuum from a weak AGN could in principle produce an UV excess (Agüeros et al., 2005).
With FWHM, GALEX imaging marginally resolves SDSS galaxies at (angular diameter ), which is why we turned to high-resolution FUV imaging with the Solar Blind Channel (SBC) of the ACS. HST images of our sample of massive ETGs with strong UV excess and no obvious optical signs of SF reveal a surprise: they are dominated by extended star formation on scales of 10–50 kpc, and with rates of up to 2 .
2. Data and Sample
Our sample is selected from the SDSS DR4 main spectroscopic survey () matched to GALEX Medium Imaging Survey IR1.1 (; AB magnitudes throughout). The details of SDSS and GALEX data and the matching procedure are given in Salim et al. (2007).
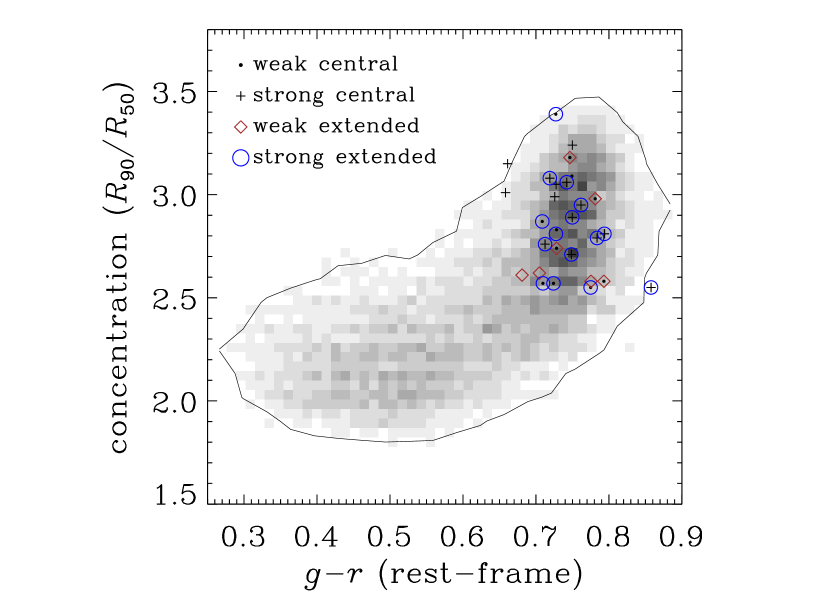
From the matched SDSS/GALEX catalog we select optically quiescent early-type galaxies (QETGs) in the following way: (1) redshift to yield a sample with larger angular sizes, (2) -band light concentration (ratio of 90 and 50% Petrosian radii) to select dominant spheroids (Fig. 1), (3) no detectable H emission based on DR4 version of Brinchmann et al. 2004 BPT classification (“No H” category in Salim et al. 2007). Note that no color selection has been applied to select QETGs.
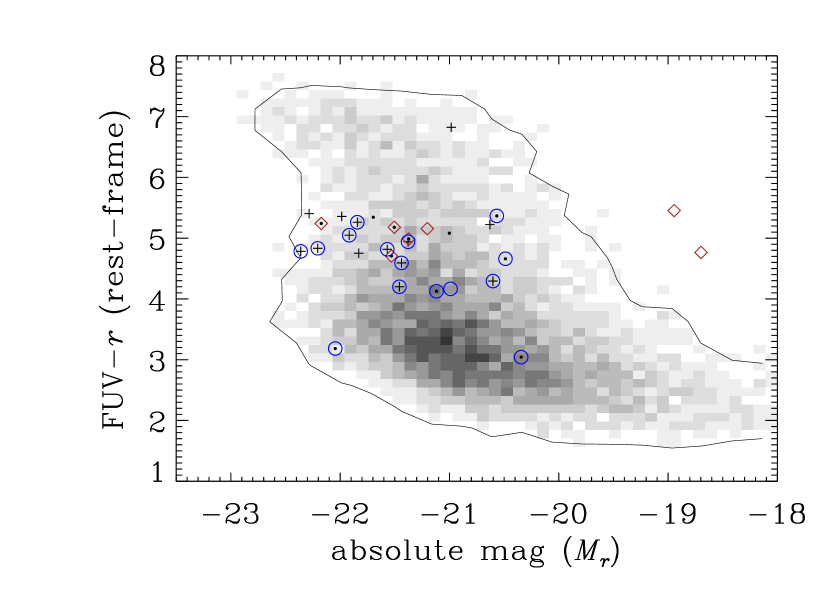
Out of QETGs, one-fifth has rest-frame FUV-optical colors (Fig. 2) bluer than 111Colors are given in rest frame throughout.. Donas et al. (2007) show that nearby RC3 ellipticals (without lenticulars), where the UV excess is known to come from classical UV upturn (old populations), are redder than this limit. In contrast, we are interested in QETGs with strong UV excess, so we select galaxies with . There are 60 such galaxies from which we exclude blends, obvious optical disturbances, late-type contaminants, and E+A post-starbursts (based on H index), to arrive at a final HST sample of 30.
The UV-optical () color range of our sample can be seen from Figure 2. The sample is presented with symbols, while greyscale represents all SDSS-GALEX galaxies at (the underlying population). By selection, the sample is bluer than the red sequence, with two galaxies ( ) lying squarely in the blue sequence.222When referring to blue/red sequence/cloud or the green valley, one needs to specify the color used to distinguish these populations. E.g., the green valley makes sense as a separate population only in UV-optical colors (Wyder et al., 2007).
While no optical color cut has been explicitly applied, our strong UV excess sample has distinctly red optical color (Fig. 1), placing them firmly in the optical red sequence. Similar confinement to the red sequence is seen in colors (not shown). Schawinski et al. (2009) and (Kannappan et al., 2009) study blue early-type galaxies in SDSS selected by atypically blue . However, our sample galaxies are redder than their cuts.
3. HST UV observations
With FWHM of , GALEX makes it difficult to pinpoint the origin of the FUV light at . In contrast, ACS/SBC on the HST places 80% of point source energy in (Ford et al., 2003). Targets were observed with one orbit through the long-pass filter F125LP ( Å). Processing was performed using MULTIDRIZZLE with SBC-optimized parameters, and smoothed using ADAPTSMOOTH (Zibetti, 2009).
4. Results
4.1. UV morphology
Twenty-nine targets were successfully imaged, and each produced a detection, either of a compact central source or of extended structures (or both). To our surprise, 22 galaxies (76%) revealed an extended UV morphology and an additional three had UV patches within several arcsec of the nucleus. In all cases the extended UV emission is structured, and thus results from star formation (unlike a diffuse component one might expect from an old population). The UV extent is typically larger than the optical size, though mostly contained within a radius containing 90% optical Petrosian flux. We divide extended structures into strong (15) and weak (7) based on visual appearance and provisional flux measurements. These are labeled in figures by circles and diamonds respectively. In all galaxies save four a compact central source is present as well, which we divide into strong (14; plus sign) and weak point sources (11; dots).
Several strong extended UV morphologies are illustrated in Figure 3. Galaxy (a) has a weak central source, while others exhibit a strong central source. Insets show -band SDSS images with ACS fields indicated. As required by sample selection, optical images appear like ETGs, though, after the fact, hints of structure are visible in (a), (d) and a couple of other galaxies.
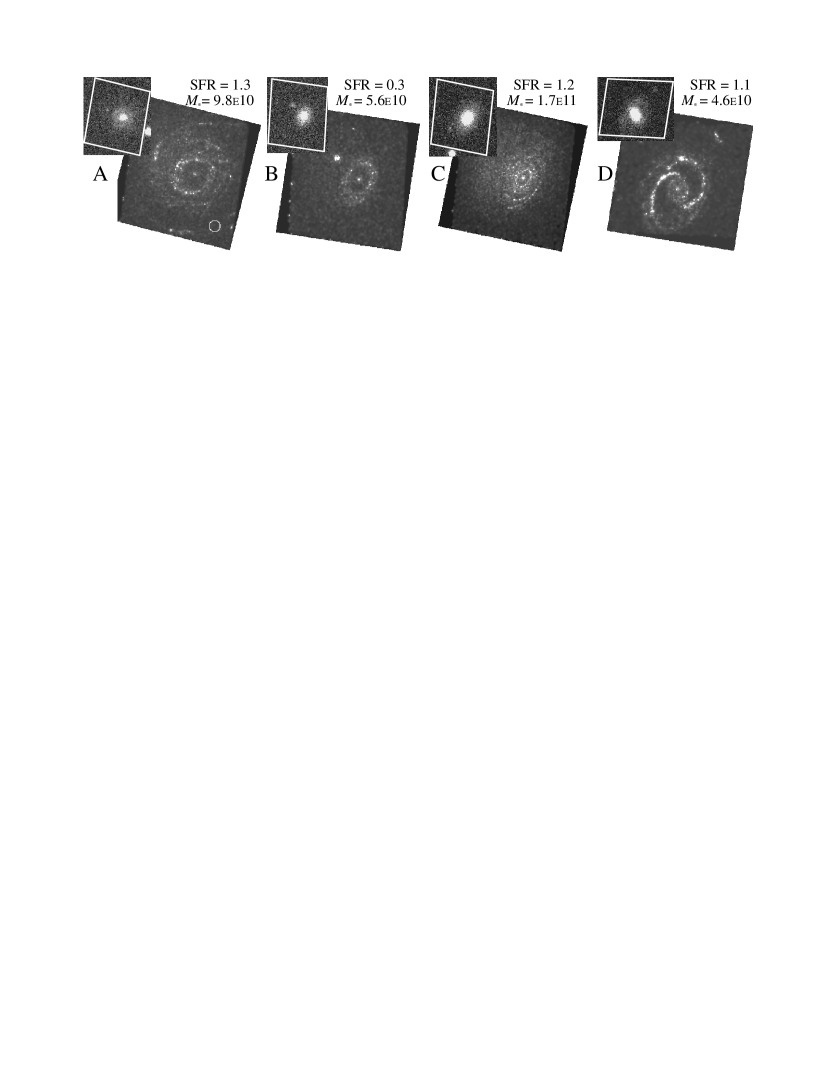
The galaxy in panel (a) of Figure 3 shows multiple star forming features, including an inner ring and what look like flocculent spiral arms. Two other galaxies in the sample show flocculent features. Panel (b) shows a galaxy with a wide SF ring. Such morphology is most common in our sample (eight other cases). Next is one of four galaxies showing thin concentric rings. The last (panel d) is the most striking in terms of surface brightness, with two bright spiral arms emanating from what appears to be a co-rotation ring, connected by a fainter outer Lindblad resonance ring (Schwarz, 1984). The optical image shows a hint of red spiral arms. Two other galaxies in the sample appear to have spiral arms, albeit less prominent.
4.2. Placing the UV excess sample in context
We first return to the plot showing concentration vs. optical color (Fig. 1). Two of the optically bluest sources do not have extended structures, emphasizing the disconnect between the UV excess and the optical colors. On average, galaxies with a strong central source tend to be more optically concentrated than those with only a weak central source, which are in turn more highly concentrated than those with no central source.
Figure 2 shows the color-magnitude diagram. Sample galaxies span a wide range in absolute magnitude, with a median of , which is close to (Blanton et al., 2001). Similarly to concentration, there exists the trend between the strength of central source and absolute magnitude. Not surprisingly, this trend is also present vs. stellar mass and, even more strongly, velocity dispersion. Compared to all UV-detected QETGs, the UV-strong ones have somewhat lower stellar masses (median is ) , with a clear deficit at . In other words, most massive ETGs do not exhibit strong UV excess. 333Chabrier IMF stellar masses, star formation rates (SFRs) and FUV attenuations were derived from UV/optical SED fitting described in Salim et al. (2007). Two galaxies stand out as low luminosity (and mass; ). They exhibit less extended (yet still patchy) UV morphology without a central source.
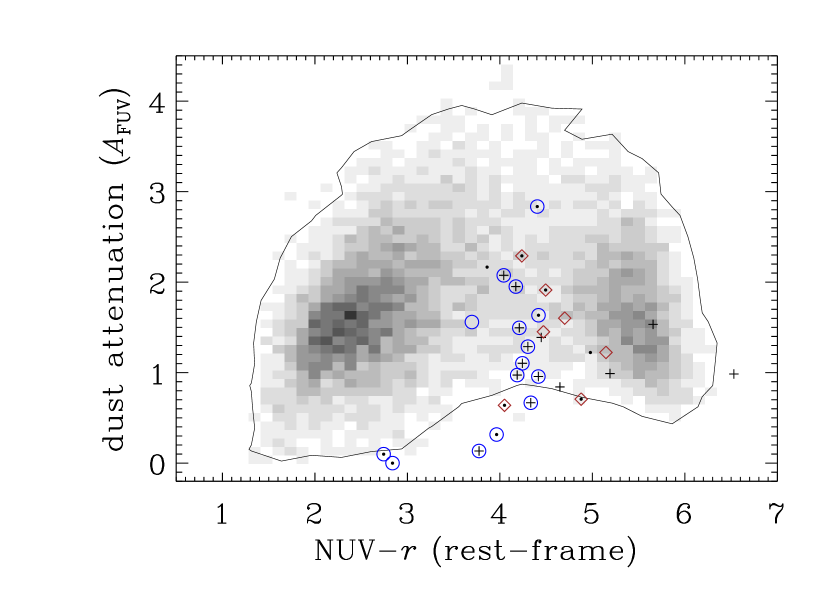
Switching from to the less dust-sensitive will allow us to place the sample in a better SF history context. Figure 4 plots FUV attenuation against color. First focusing on the color, we see that the majority of UV excess ETGs fall in the green valley (). basically “resolves” the optical red sequence into a green valley and UV-optical red sequence. Every red galaxy had to pass through the green valley at some point, and presumably most green valley galaxies are transiting for the first time (Martin et al., 2007). After a galaxy gets on a red sequence it can enter the green valley again if it experiences a star formation episode (“rejuvenation”). From Figure 4 one notices that sample galaxies in the UV red sequence lack strong extended structures, while the contrary is true for bluer galaxies. Thus, we conclude that UV excess galaxies are powered by star formation if they are in the green valley or bluer, but they are dominated by a central source (perhaps an AGN) if despite blue their places them in the red sequence. The dust attenuation of sample galaxies is smaller than that of other galaxies of the same color, which may hold clues to their evolutionary path. Different UV morphologies have no significant differences in terms of dust attenuation.
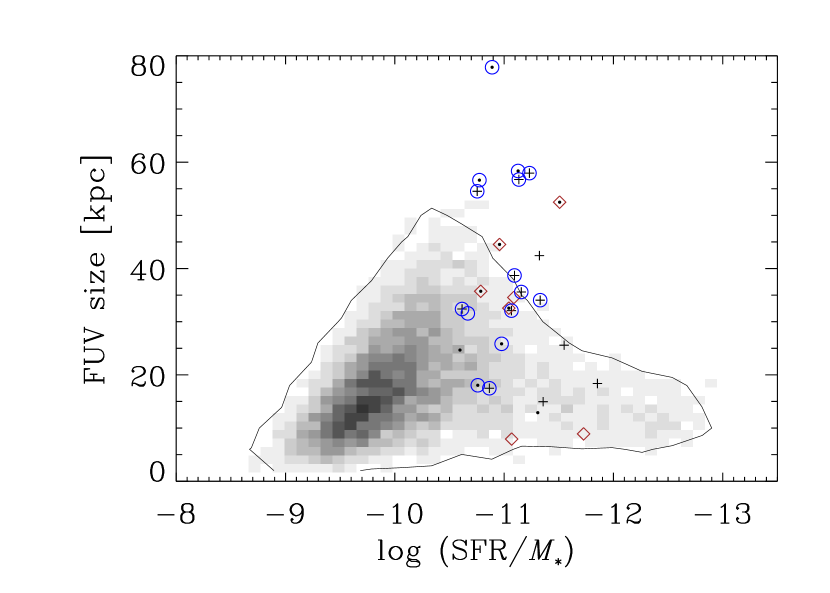
To distinguish the effects of dust from those of SF history, we switch from to (dust-corrected) specific SFR (). The specific SFR is plotted against the far-UV physical size in Figure 5, with more actively star-forming galaxies on the left. Our sample now spans a narrower range in than it did in . Two galaxies that sat in the blue sequence owed such blue colors to very low dust attenuation, and actually have “transitional” specific SFRs as do other sample galaxies. Galaxies without extended UV emission tend to have lower specific SFRs, in agreement with inferences from color. Sample galaxies span a range of SFRs from 0.01 to 2 , with a median of 0.4 .
UV sizes in Figure 5 are GALEX FWHM measurements for both the sample and the underlying population (to avoid biasing one measurement). Bursty galaxies are typically less massive and smaller compared to those with . Beyond that, SF activity decreases as do the UV sizes. However, sample galaxies are on average significantly larger than the underlying galaxy sample of the same specific SFR.
5. Discussion
This study was motivated by the results of Rich et al. (2005) in which QETGs were selected to study the classical, old-population UV upturn, but instead resulted in much bluer samples that did not adhere to relations expected for classical UV upturn. Agüeros et al. (2005) suggested that the blue UV-optical extent came from a low-level AGN contamination, while other studies (e.g., Yi et al. 2005) attributed blue colors in ETGs to star formation.
Our current study clearly demonstrates that the majority of UV excess ETGs (even though optically quiescent) indeed have UV morphology consistent with SF. This is especially the case for galaxies with , a cut originally proposed by Yi et al. (2005) to distinguish SF from the old-population UV upturn. So why is there little or no H when from the FUV flux one expects H S/N of around 40? As Figure 3 shows, the SDSS fiber may entirely miss the UV-bright regions. However, in some cases there appears to be UV emission within the fiber diameter and still no H. Thus, there is a possibility that H emission is genuinely suppressed in the central parts or throughout these galaxies. This would happen if no SF took place over the last 10 Myr (the lifetime of massive stars producing ionizing emission), or if few such stars are being produced (e.g., Lee et al. 2009). Planned resolved H imaging should settle this issue.
Now that we established the nature of the UV emission, we turn to the origin of star-forming gas. We consider these scenarios: (1) observed SF is what remains of the original, continuous SF; (2) SF results from a gas accreted from a minor gas-rich merger or (3) accreted directly from IGM, after a period of quiescence. In scenarios 2 and 3 galaxy is again in the green valley after it was already on the red sequence, while in 1 it is transiting from blue to red sequence for the first time. While we selected the sample to have highly concentrated light profiles, high concentrations are typical for most green valley galaxies, so this cannot be used to distinguish scenario 1 from the other two. The fact that strong UV-excess ETGs typically have blue sequence-like masses () may suggest scenario 1, because if already passive ETGs are being rejuvenated, why would this happen less often to massive ETGs? SAURON sees a similar phenomenon in nearby ETGs, where slow rotators do not show infrared signatures of SF (Shapiro et al., 2010). Presence/absence of SF may be another form of ’E-E’ dichotomy (Kormendy et al., 2009), in which more luminous () ellipticals are slow rotators and have X-ray emitting gas, possibly maintained by radio mode AGN (Croton et al., 2006), which prevents gas accretion. In our sample, ETGs with SF all have .
Under scenario 1 our UV-strong galaxies will have properties like other green-valley galaxies, most of which presumably transition from blue to red and are not rejuvenated red galaxies (Martin et al., 2007). However, both low dust attenuation (Fig. 4) and large UV size (Fig. 5) argue that this cannot be the case for the majority of the sample. Low dust attenuation makes our sample more similar to red sequence than to green-valley galaxies. And if red galaxies acquired gas from dwarfs, merging would not increase the dust content significantly, since dwarfs are almost dust-free (e.g., Dale et al. 2007). Similarly, the UV sizes of our sample are larger than of the underlying galaxies with similar specific SFR, suggesting an external origin. Together, this implies that most (but possibly not all) of UV-excess ETGs are rejuvenated systems.
Rings, in one form or other, are present in 15 out of 22 galaxies having extended UV. Rings in disk galaxies are commonly attributed to either bar-induced resonances (Buta & Combes, 1996) or head-on collisions (Appleton & Struck-Marcell, 1996). However, collisional rings, in addition to being rare, are usually off-center (Lynds & Toomre, 1976), which is not the case here. In a nearby SAURON elliptical NGC2974, UV rings detected by GALEX were explained as resonant features due to a hypothetical, optically undetected bar (Jeong et al., 2007). If ring structures in our sample are due to resonances, the bars that induce them would need to be more common than observed in S0 galaxies (, Aguerri et al. 2009). Of galaxies in the sample, the galaxy in Figure 3 (d) most clearly shows classical resonance features, and the bar is present. Other ringed galaxies show no obvious evidence of bars in SDSS images. Perhaps some other, less-investigated process introduces rotational asymmetry and forms rings (Buta & Combes, 1996). Resonances have been classically studied in disk galaxies with existing gas, while here we are probably dealing with newly-accreting gas, which may behave differently. Regardless of the origin of the rings, we still need to identify the source of the cold gas.
Recently, Kaviraj et al. (2009) advocated that minor gas-rich mergers (scenario 2) can fully explain the extent and frequency of NUV-excess ETGs. They also construct N-body simulations (Peirani et al., 2009) of minor mergers, but these do not produce ring-like UV morphologies that we see. Instead, their young stars are highly concentrated in the nuclear region of the host. However, their hosts are kinematically more similar to ellipticals, while as found by Shapiro et al. (2010) and indicated here, the only type of ETGs that allow extensive SF may be S0/fast-rotators. Also, our selection against H in the central region may bias against central starbursts. Peirani et al. (2009) simulations also predict that there should exist stellar signatures of mergers, such as shells and tidal tails, but the current optical data are not adequate to search for them.
The SFRs of our ETGs are similar to those of gas-rich dwarfs with stellar 20 times lower masses. Ignoring dwarf galaxy duty cycles and merger timescales, this would imply very minor mergers.
Finally, regarding scenario 3 (IGM accretion, Kereš et al. 2005), we first ask why does IGM lead to SF rejuvenation and not just the continuation of the original SF that formed the bulk of stellar population. Many recent models require AGN feedback both to shut down SF and to maintain their quiescence (Croton et al., 2006). However, if the AGN stopped being active, a galaxy could possibly re-acquire cold gas, producing cyclical phases of AGN feedback and star formation. Our galaxies, showing at best only very weak AGN activity, may currently be in the renewed star-forming phase. (In contrast, in more massive ETGs, , the accretion may be permanently disrupted.) Large UV sizes (Fig. 5) and similarities with XUV-disk phenomenon (Thilker et al., 2007; Donovan et al., 2009) point towards this scenario, but we currently cannot strongly favor IGM accretion over minor mergers as the main source of gas in our sample.
In closing we turn to the nature of the UV emission of the compact central source. While the compactness of UV emission suggests an AGN, ACS/SBC resolution cannot outright rule out a highly nucleated stellar bulge. We see a correlation between the strength of the central source and velocity dispersion that may (through accretion rate being a function of ; Martin et al. 2007) suggest an AGN, but again does not exclude stellar origin. While emission lines are too weak (by selection) to allow secure individual BPT classification, averaging the measurements results in strong and weak central sources landing in the AGN (Seyfert) part of the BPT diagram, and those with no central source in the SF/AGN composite region. Finally, galaxies with no extended UV, where we can measure central UV color have , which is more consistent with a blue continuum source (Agüeros et al., 2005) than an old stellar population.
6. Conclusions
Early-type galaxies with strong far-UV excess are dominated by SF, except when they are red in the , in which case the FUV comes from a compact source, possibly an optically weak AGN. Extended SF around ETGs has recently been found in some individual nearby galaxies, but these have stellar masses one to two orders of magnitude smaller (Thilker et al., 2010; Donovan et al., 2009). We extended SF in galaxies up to . However, strong UV excess is rare in yet more massive ETGs–possible consequence of AGN feedback and a reflection of an ‘E-E’ dichotomy. In the majority of cases the SF gas is probably external in origin (minor mergers or IGM accretion), making these ETGs ‘rejuvenated’. Most common UV morphology are rings, which likely result from resonances (from yet undetected bars or other disturbances). A smaller fraction of UV-excess ETGs may be more typical green-valley galaxies, where we see the declining original SF activity. Similar conclusions regarding the heterogeneity of evolutionary paths of transiting galaxies (but not necessarily ETGs) were recently reached by Cortese & Hughes (2009) based on HI content of nearby ( Mpc) galaxies.
References
- Aguerri et al. (2009) Aguerri, J. A. L., Méndez-Abreu, J., & Corsini, E. M. 2009, A&A, 495, 491
- Agüeros et al. (2005) Agüeros, M. A., et al. 2005, AJ, 130, 1022
- Appleton & Struck-Marcell (1996) Appleton, P. N., & Struck-Marcell, C. 1996, Fundamentals of Cosmic Physics, 16, 111
- Blanton et al. (2001) Blanton, M. R., et al. 2001, AJ, 121, 2358
- Bregman et al. (1992) Bregman, J. N., Hogg, D. E., & Roberts, M. S. 1992, ApJ, 387, 484
- Brinchmann et al. (2004) Brinchmann, J., Charlot, S., White, S. D. M., Tremonti, C., Kauffmann, G., Heckman, T., & Brinkmann, J. 2004, MNRAS, 351, 1151
- Buta & Combes (1996) Buta, R., & Combes, F. 1996, Fundamentals of Cosmic Physics, 17, 95
- Code (1969) Code, A. D. 1969, PASP, 81, 475
- Cortese & Hughes (2009) Cortese, L., & Hughes, T. M. 2009, MNRAS, 400, 1225
- Croton et al. (2006) Croton, D. J., et al. 2006, MNRAS, 365, 11
- Dale et al. (2007) Dale, D. A., et al. 2007, ApJ, 655, 863
- Donas et al. (2007) Donas, J., et al. 2007, ApJS, 173, 597
- Donovan et al. (2009) Donovan, J. L., et al. 2009, AJ, 137, 5037
- Ford et al. (2003) Ford, H. C., et al. 2003, Proc. SPIE, 4854, 81
- Greggio & Renzini (1990) Greggio, L., & Renzini, A. 1990, ApJ, 364, 35
- Jeong et al. (2007) Jeong, H., Bureau, M., Yi, S. K., Krajnović, D., & Davies, R. L. 2007, MNRAS, 376, 1021
- Kannappan et al. (2009) Kannappan, S. J., Guie, J. M., & Baker, A. J. 2009, AJ, 138, 579
- Kaviraj et al. (2007) Kaviraj, S., et al. 2007, ApJS, 173, 619
- Kaviraj et al. (2009) Kaviraj, S., Peirani, S., Khochfar, S., Silk, J., & Kay, S. 2009, MNRAS, 394, 1713
- Kauffmann et al. (2003) Kauffmann, G., et al. 2003, MNRAS, 341, 54
- Kauffmann et al. (2007) Kauffmann, G., et al. 2007, ApJS, 173, 357
- Kereš et al. (2005) Kereš, D., Katz, N., Weinberg, D. H., & Davé, R. 2005, MNRAS, 363, 2
- Kormendy et al. (2009) Kormendy, J., Fisher, D. B., Cornell, M. E., & Bender, R. 2009, ApJS, 182, 216
- Lee et al. (2009) Lee, J. C., et al. 2009, ApJ, 706, 599
- Lynds & Toomre (1976) Lynds, R., & Toomre, A. 1976, ApJ, 209, 382
- Martin et al. (2007) Martin, D. C., et al. 2007, ApJS, 173, 342
- Masters et al. (2010) Masters, K. L., et al. 2010, arXiv:1001.1744
- Peirani et al. (2009) Peirani, S., Crockett, R. M., Geen, S., Khochfar, S., Kaviraj, S., & Silk, J. 2009, arXiv:0912.2629
- Rich et al. (2005) Rich, R. M., et al. 2005, ApJ, 619, L107
- Salim et al. (2007) Salim, S., et al. 2007, ApJS, 173, 267
- Schawinski et al. (2009) Schawinski, K., et al. 2009, MNRAS, 396, 818
- Schwarz (1984) Schwarz, M. P. 1984, MNRAS, 209, 93
- Shapiro et al. (2010) Shapiro, K. L., et al. 2010, MNRAS, 92
- Strateva et al. (2001) Strateva, I., et al. 2001, AJ, 122, 1861
- Thilker et al. (2007) Thilker, D. A., et al. 2007, ApJS, 173, 538
- Thilker et al. (2010) Thilker, D. A., et al. 2010, arXiv:1003.4985
- Yi et al. (2005) Yi, S. K., et al. 2005, ApJ, 619, L111
- Wyder et al. (2007) Wyder, T. K., et al. 2007, ApJS, 173, 293
- Zibetti (2009) Zibetti, S. 2009, arXiv:0911.4956