A Analog of Local Ultra-massive Elliptical Galaxies 11affiliation: Based on data collected at Subaru Telescope, which is operated by the National Astronomical Observatory of Japan (S09A-043).
Abstract
We present observations of a very massive galaxy at which show that its morphology, size, velocity dispersion and stellar population properties that are fully consistent with those expected for passively evolving progenitors of today’s giant ellipticals. These findings are based on a deep optical rest-frame spectrum obtained with the Multi-Object InfraRed Camera and Spectrograph (MOIRCS) on the Subaru telescope of a high- passive galaxy candidate (pBzK) from the COSMOS field, for which we accurately measure its redshift of and obtain an upper limit on its velocity dispersion . By detailed stellar population modeling of both the galaxy broad-band SED and the rest-frame optical spectrum we derive a star-formation-weighted age and formation redshift of – Gyr and –, and a stellar mass of –. This is in agreement with a virial mass limit of , derived from the measured value and stellar half-light radius, as well as with the dynamical mass limit based on the Jeans equations. In contrast with previously reported super-dense passive galaxies at , the present galaxy at appears to have both size and velocity dispersion similar to early-type galaxies in the local Universe with similar stellar mass. This suggests that massive and passive galaxies may exhibit a wide range of properties, then possibly following quite different evolutionary histories from to .
Subject headings:
galaxies: evolution — galaxies: formation — galaxies: high-redshift1. Introduction
Understanding the formation of massive elliptical galaxies remains a crucial unsolved issue of galaxy evolution. The recent discovery and the first redshift measurements, through deep ultraviolet (UV) rest-frame spectroscopy, of a substantial population of passively evolving galaxies at (e.g., Cimatti et al., 2004; McCarthy et al., 2004; Daddi et al., 2005) have shown that quenching of star formation in the most massive galaxies was already well under way at .
A puzzling property of such objects has been revealed soon afterwards with some of them being found to have a factor of smaller effective radii compared to local early-type galaxies (ETGs) of the same stellar mass (e.g., Daddi et al., 2005; Trujillo et al., 2006; Longhetti et al., 2007; Cimatti et al., 2008; van Dokkum et al., 2008), implying that they are times denser than their possible descendants in the local Universe. Several alternative mechanisms have been proposed to make such compact ETGs grow in size so to finally meet the properties of local ETGs (e.g., Khochfar & Silk, 2006; Fan et al., 2008; Naab et al., 2009; La Barbera et al., 2009; Feldmann et al., 2010), but no general consensus has yet emerged.
On the other hand, ETGs at with large effective radii, comparable to the local ETGs, have also been found (e.g., Mancini et al., 2010; Saracco et al., 2009, see also Daddi et al. 2005), indicating a diversity of structural properties in the ETG population at . Moreover, possible effects have also been discussed that could bias size estimates towards lower values (e.g., Daddi et al., 2005; Hopkins et al., 2009; Mancini et al., 2010; Pannella et al., 2009).
An independent way to check these issues is by measuring stellar velocity dispersions (): if high- ETGs are really super-dense, their should be much higher than that of local ETGs of the same mass. Cappellari et al. (2009) measured from deep UV rest-frame spectroscopy of a sample of 9 ETGs at from the GMASS survey (Cimatti et al., 2008), finding two galaxies with similar stellar density and as local ETGs of the same mass. The remaining galaxies have higher stellar densities and higher from their stacked spectrum, but still overlapping with the densest local ETGs.
In this respect, near-infrared (NIR) spectroscopy offers a great advantage for the galaxies at as the optical break at rest-frame Å and Ca II H+K (the strongest spectral features of passively evolving galaxies) are redshifted into NIR, and the rest-frame optical continuum is much brighter than that in the rest-frame UV. Thus, van Dokkum et al. (2009) measured a velocity dispersion of for a compact ETG at using a deep NIR spectrum from Kriek et al. (2009). This value of is much higher than that of the most massive local ETGs, and would be consistent with the small half light radius measured for that galaxy.
2. Observations and Data Reductions
We have obtained 4.7 hours of MOIRCS spectroscopy of 34 BzK-selected galaxies (Daddi et al., 2004) from the catalog of McCracken et al. (2010) in the COSMOS field. We used the zJ500 grism with slits, providing a resolution of in the -band over the range 9500–16000Å. The primary aim of our observation was to measure redshifts for passive BzK galaxies (pBzKs) and locate them accurately in the COSMOS large scale structure. We preferentially selected the most massive pBzKs (which are also the brightest in the NIR) to maximize the chance of determining also physical information in addition to redshifts for at least a fraction of them, in particular the galaxy (#254025) discussed in this paper and already studied by Mancini et al. (2010). The observations were made under partly cloudy conditions and with seeing. A sequence of 600s integrations were made in a two position dithering pattern separated by . The A0V-type star HIP 55627 was observed to obtain (relative) flux calibration and to correct for telluric absorption. The data were reduced using the MCSMDP pipeline (Yoshikawa et al., in preparation), including flat-fielding by dome flat, sky subtraction between each exposure pairs, bad pixel and cosmic ray rejection, distortion correction, wavelength calibration (based on the OH telluric lines), residual sky subtraction and finally co-addition with appropriate offsets and weights. The 2-dimensional spectra are flux-calibrated using the standard star spectrum, and 1-dimensional spectra were extracted with the IRAF apall task using a aperture. The absolute flux calibration was then obtained by normalizing to the -band total magnitude.
Whilst the results for the complete sample observed with MOIRCS will be presented elsewhere we will concentrate here on the pBzK galaxy #254025. This galaxy one of the 12 ultra-massive high redshift ETG candidates in Mancini et al. (2010), with a photometric redshift of and very bright NIR magnitudes of and . Mancini et al. (2010) also report that the galaxy is non-detected at Spitzer/MIPS to implying a star formation rate . Using HST/ACS F814W imaging (rest-frame UV) they measure a Sérsic index and an effective radius of kpc, consistent with the stellar mass-size relation of local elliptical galaxies (Mancini et al., 2010).
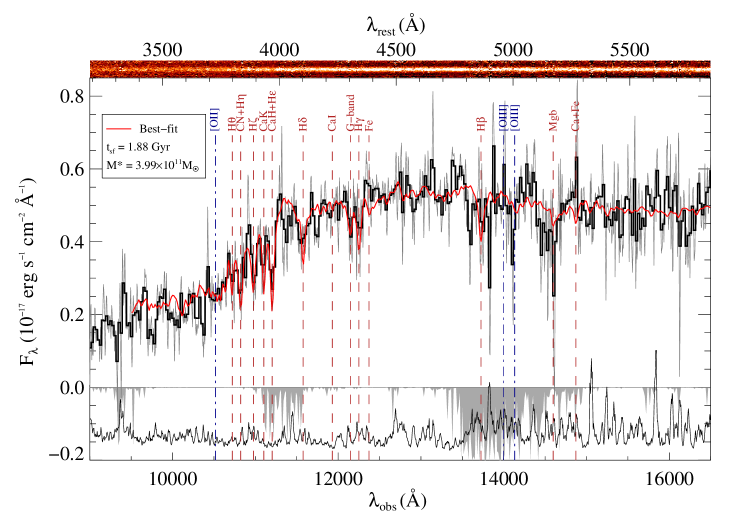
Figure 1 shows the resulting 1D and 2D MOIRCS spectra of #254025. The 4000 Å break is clearly seen, together with strong Balmer and metallic absorption lines, namely Ca II H +H, Ca II K, H, H, H, G-band and CN+H. H falls in the region with low atmospheric transmission and with strong OH-lines. No emission lines are observed. While [O III] falls in a region with low atmospheric transmission, [O II] is uncontaminated and its non-detection sets a upper limit of SFR of (not corrected for extinction), using the Kennicutt (1998) conversion. From the spectrum, the absorption line redshift is measured as .
3. Results
3.1. Stellar Populations
Having determined the spectroscopic redshift, we proceeded to fit stellar population templates, separately to the broad-band spectral energy distribution (SED) and to the MOIRCS spectrum. We allowed for a wide range of possible star formation histories (SFHs), including: (1) instantaneous bursts, i.e., simple stellar populations (SSP); (2) constant SFRs for a duration within 0.01–3.5 Gyr 111The age of the Universe at is about 3.5 Gyr, given the adopted cosmology., terminated by SF quenching and followed by passive evolution; (3) delayed, exponentially declining SFH described as with within – Gyr; (4) exponentially increasing SFH, for a duration within – Gyr, followed by SF quenching and passive evolution. We choose Gyr, corresponding to a stellar mass doubling time of Gyr, as suggested for galaxies by the existence of tight stellar mass-SFR relation, with (Daddi et al., 2007; Renzini, 2009). For all the SFHs, template ages were allowed to range in – Gyr. We use a Chabrier (2003) IMF. The fits were made with metallicities of 0.5, and 2. To reduce the number of free parameters we have assumed no dust extinction, appropriate for a passively evolving galaxy, considering the strict upper limit on the SFR that is set by the spectrum, an assumption that is validated by the good fit that is achieved in the blue continuum (see Figure 1).
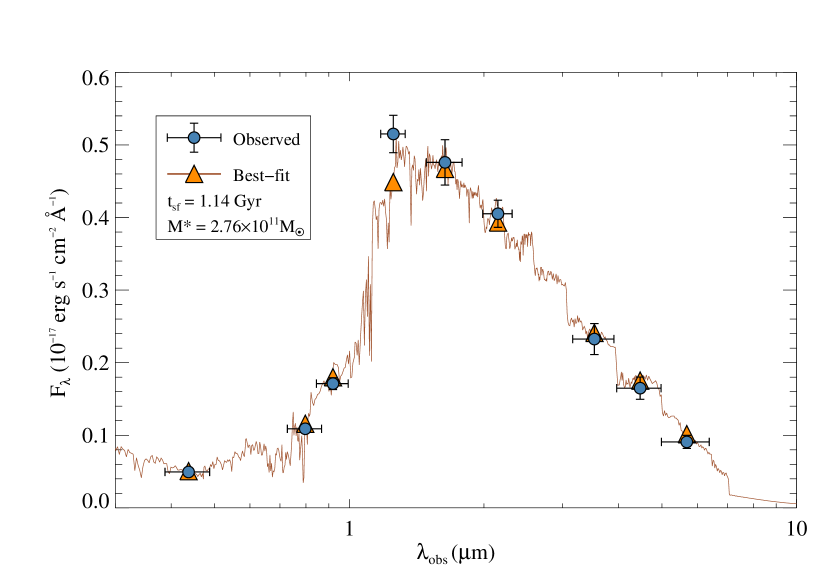
The SED fitting was carried out for the broad-band data from Subaru/Suprime-Cam (Capak et al., 2007; Taniguchi et al., 2007), data from CFHT/WIRCAM (McCracken et al., 2010), and the Spitzer/IRAC , and data (Sanders et al., 2007). Artificial errors of 0.05 mag for the bands and 0.1 mag for the IRAC bands are added to the observed errors in quadrature to account for systematics in zero-point determinations, in the photometric measurements, and in the stellar population models. The templates for the SED fitting are generated from population synthesis models by Maraston (2005, hereafter M05).
The spectral resolution of the M05 models is significantly lower than that of our MOIRCS spectrum. Hence, for fitting the spectrum, we used templates from the Bruzual & Charlot (2003, hereafter BC03) spectral synthesis library. Although these models might not account properly for TP-AGB stars (e.g., Maraston et al., 2006), this effect is not significant at 4000Å rest-frame, the wavelength range probed by our spectrum. The template spectra are Gaussian-broadened to an overall velocity dispersion of 350 (see §3.2) to match that the observed spectrum, and having fixed it the stellar population parameters are derived with the over the observed wavelength range 9500–16000Å.
The stellar population parameters of the best-fit models from each adopted SFH are listed in Table 1 and the best-fit templates for the spectrum and SED are shown in Figures 1 and 2, respectively. The best fit spectra have star-formation (SF) weighted ages of Gyr and stellar masses of for the broad-band SED, and Gyr and stellar mass of for the spectrum. The best fit results are from for the SED and for the spectrum. However, for the spectrum very similar values are derived using solar metallicity models that result in a slightly higher (Table 1). We notice that solar, or slightly supersolar metallicities are appropriate for local elliptical galaxies with stellar masses similar to galaxy #254025 (Thomas et al., 2005). The SF weighted age of – Gyr corresponds to an average formation redshift of –, although the SF could have started much earlier. In the case of the spectral fitting, all SFHs adopted here fit equally well with and – Gyr, consistent with the detection of strong Balmer absorption lines which are most prominent in A-type stars. Moreover, in the case of the SED fits (apart for the SSP spectra) the various SFHs do not give very different values and therefore it is not possible to discriminate between them. The same can be said for the derived metallicities. If we allow for dust reddening, the best fitting , and would change by only %, with some increase of the formal uncertainties within each class of SFH.
3.2. Velocity Dispersion and Dynamical Modeling
Our high S/N spectrum ( per 60 spectral interval in the continuum) allows us to measure a velocity dispersion from the absorption line width , which is a combination of the galaxy stellar velocity dispersion and the instrumental resolution . This S/N is comparable to spectra of GMASS galaxies with successful individual determinations (Cappellari et al., 2009). Therefore we followed the same approach of Cappellari et al., based on the Penalized Pixel-Fitting method (pPXF; Cappellari & Emsellem, 2004). The MILES stellar library containing 985 stars (Sánchez-Blázquez et al., 2006) is adopted here since it provides the best uniform and complete set of stars.
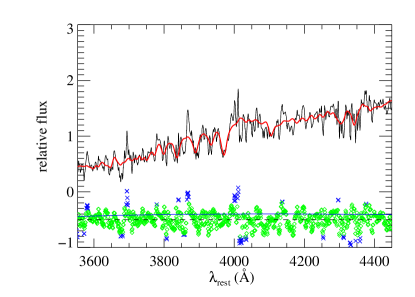
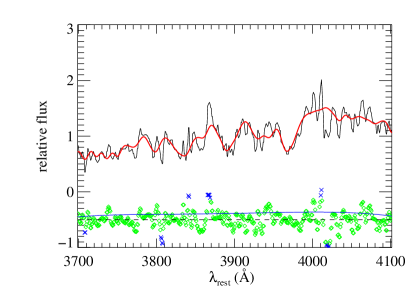
Figure 3 shows the best-fit templates from pPXF, corresponding to km s-1 (random) 30 km s-1 (systematic) for the rest-frame wavelength range of Å. The random error ( confidence) is determined as half of the interval in spanned by 68 out of 100 Monte Carlo realizations of the input spectrum. A rough estimate of the systematic error is obtained as half of the interval in spanned by all repeated extractions of the kinematics using different, but equally acceptable, combinations for the values of the degree (from 0–4) of the additive and multiplicative polynomials in pPXF. Restricting the fit to the region with the Balmer and Ca II H+K lines ( Å in the rest-frame) gives km s-1 (total error), consistent with the value derived from the full spectral range.
In order to derive we need to determine accurately the instrumental resolution. To do this we have used our combined MOIRCS spectrum without sky subtraction and simultaneously fitted Gaussian profiles to a series of telluric OH-lines at Å, i.e., near the strongest absorption features of the galaxy’s spectrum. The central wavelength for each OH-line was taken from Rousselot et al. (2000) and we left , OH-line intensities, and constant baseline as free parameters. The fitting procedure reproduces the observed sky spectra very well. Over – Å, the instrumental resolution changes from 270 to 330 . We adopt (random) (systematic).
The derived galaxy stellar velocity dispersion is , which gives (random) (systematic). The relatively large uncertainties in , and as is close to , we cannot place a lower limit to . However, we can derive a upper limit of (or at the level), which is consistent with both determinations. If Balmer lines suffer from fill-in from emission lines could be somewhat lower.
From the stellar velocity dispersion the virial mass can be calculated as . We have set as empirically calibrated on local galaxies with state-of-the-art dynamical modeling (Cappellari et al., 2006), with the velocity dispersion being measured within a large aperture () as in our case. The effective radius was measured by Mancini et al. (2010) from the HST/ACS F814W image ( Å in the rest-frame) as or kpc at . Thus the upper limit of the virial mass is derived as .
We have also constructed a dynamical model based on axisymmetric Jeans dynamical models as those used to model the GMASS galaxies by Cappellari et al. (2009), adopting a multi-Gaussian expansion (MGE; Emsellem et al., 1994). This method has the advantage that the derived is virtually insensitive to possible underestimation of the size, which can be a possibility at high redshifts Considering the bolometric surface brightness dimming of , a factor coming from the source redshifting and the -correction between rest-frame 2900 Å to rest-frame -band, we derived a rest-frame -band luminosity of . The second moment of the velocity was also estimated (assuming and axisymmetry) by using the Jeans anisotropic MGE (JAM) method (Cappellari, 2008). The upper limit for the dynamical can be calculated by , which can be converted into the upper limit of the dynamical mass from the JAM model as . Therefore the virial mass and Jeans mass agree well though both of them are upper limits. A JAM model constructed from a noiseless model with the best fitting Sérsic parameters of Mancini et al. (2010), as opposed to the actual ACS image, gives the same within 1%. This is due to the robustness of the central recovered using dynamical models (in contrast to virial estimates) to photometric uncertainties at large radii (e.g., §3.2 in Cappellari et al., 2009).
4. Discussion and Conclusions
Figure 4 compares the properties of the galaxy #254025 and other galaxies for which the same quantities have been measured (Cappellari et al., 2009; van Dokkum et al., 2009). The figure includes ETGs at , selected from the Sloan Digital Sky Survey (SDSS) on the base of their red color and high Sérsic index (Blanton et al., 2005). The dynamical and stellar masses agree very well for the high- objects, within a factor of . Note that our massive galaxy has physical properties in good agreement with those of local ETGs of similar stellar mass. Our galaxy provides a second example of a very massive passively evolving system for which a stellar velocity dispersion has been measured (the GMASS objects of Cappellari et al., which in Figure 4 also lie on the scaling relations, but have stellar masses below ). The “normal” size and velocity dispersion of our massive ETG is strikingly in contrast with the extreme properties (i.e., a very high and a small kpc) of the galaxy studied by van Dokkum et al. (2009) with similar stellar mass (). This suggests a substantial diversity in the physical properties of the massive ETG population at including “immature”, albeit virialized, systems — which will have to evolve into normal massive galaxies through some physical processes which decrease their velocity dispersion and increase their sizes — as well as “mature” ETGs, already on the scaling relationships of ETGs. It is clear that many more observations of similar galaxies are required to establish which kind of ETG is commonest at high redshift: either the compact/high- objects like those found by van Dokkum et al. (2009), or the apparently normal, low- objects presented in this paper. Also, nothing prevents our particular object to evolve further from its present state which mimics that of local ellipticals of the same mass. For example, it may grow further and become a brightest cluster galaxy (BCG) or a cD galaxy. For this reason, it would be important to estimate the volume number density of similar objects at high redshifts, and compare it to that of BCGs and cD galaxies.
To conclude, both very compact ETGs and ETGs following the local stellar mass-size and stellar mass- relations appear to co-exist at (see also Mancini et al., 2010). However the number of high- ETGs with individual measurement of the velocity dispersion is still extremely small. Increasing their sample is of great importance to understand the evolution of these galaxies, and in particular how and when they acquire their final structural and dynamical configuration. This paper demonstrates that with reasonable telescope time several absorption features can be detected in the rest-frame optical spectrum of the high- ETGs, from which (at least for the most massive ETGs) the velocity dispersion and several stellar population properties can be derived.
References
- Blanton et al. (2005) Blanton, M. R., et al. 2005, AJ, 129, 2562
- Bruzual & Charlot (2003) Bruzual, G., & Charlot, S. 2003, MNRAS, 344, 1000
- Capak et al. (2007) Capak, P., et al. 2007, ApJS, 172, 99
- Cappellari (2008) Cappellari, M. 2008, MNRAS, 390, 71
- Cappellari & Emsellem (2004) Cappellari, M., & Emsellem, E. 2004, PASP, 116, 138
- Cappellari et al. (2006) Cappellari, M., et al. 2006, MNRAS, 366, 1126
- Cappellari et al. (2009) —. 2009, ApJ, 704, L34
- Chabrier (2003) Chabrier, G. 2003, PASP, 115, 763
- Cimatti et al. (2004) Cimatti, A., et al. 2004, Nature, 430, 184
- Cimatti et al. (2008) —. 2008, A&A, 482, 21
- Daddi et al. (2004) Daddi, E., Cimatti, A., Renzini, A., Fontana, A., Mignoli, M., Pozzetti, L., Tozzi, P., & Zamorani, G. 2004, ApJ, 617, 746
- Daddi et al. (2005) Daddi, E., et al. 2005, ApJ, 626, 680
- Daddi et al. (2007) —. 2007, ApJ, 670, 156
- Emsellem et al. (1994) Emsellem, E., Monnet, G., & Bacon, R. 1994, A&A, 285, 723
- Fan et al. (2008) Fan, L., Lapi, A., De Zotti, G., & Danese, L. 2008, ApJ, 689, L101
- Feldmann et al. (2010) Feldmann, R., Carollo, C. M., Mayer, L., Renzini, A., Lake, G., Quinn, T., Stinson, G. S., & Yepes, G. 2010, ApJ, 709, 218
- Hopkins et al. (2009) Hopkins, P. F., Bundy, K., Hernquist, L., Wuyts, S., & Cox, T. J. 2009, MNRAS, 1635
- Ichikawa et al. (2006) Ichikawa, T., et al. 2006, in Society of Photo-Optical Instrumentation Engineers (SPIE) Conference Series, Vol. 6269, Society of Photo-Optical Instrumentation Engineers (SPIE) Conference Series
- Kennicutt (1998) Kennicutt, Jr., R. C. 1998, ARA&A, 36, 189
- Khochfar & Silk (2006) Khochfar, S., & Silk, J. 2006, ApJ, 648, L21
- Kriek et al. (2009) Kriek, M., van Dokkum, P. G., Labbé, I., Franx, M., Illingworth, G. D., Marchesini, D., & Quadri, R. F. 2009, ApJ, 700, 221
- La Barbera et al. (2009) La Barbera, F., de Carvalho, R. R., de la Rosa, I. G., Sorrentino, G., Gal, R. R., & Kohl-Moreira, J. L. 2009, AJ, 137, 3942
- Longhetti et al. (2007) Longhetti, M., et al. 2007, MNRAS, 374, 614
- Mancini et al. (2010) Mancini, C., et al. 2010, MNRAS, 401, 933
- Maraston (2005) Maraston, C. 2005, MNRAS, 362, 799
- Maraston et al. (2006) Maraston, C., Daddi, E., Renzini, A., Cimatti, A., Dickinson, M., Papovich, C., Pasquali, A., & Pirzkal, N. 2006, ApJ, 652, 85
- McCarthy et al. (2004) McCarthy, P. J., et al. 2004, ApJ, 614, L9
- McCracken et al. (2010) McCracken, H. J., et al. 2010, ApJ, 708, 202
- Naab et al. (2009) Naab, T., Johansson, P. H., & Ostriker, J. P. 2009, ApJ, 699, L178
- Pannella et al. (2009) Pannella, M., et al. 2009, ApJ, 698, L116
- Renzini (2009) Renzini, A. 2009, MNRAS, 398, L58
- Rousselot et al. (2000) Rousselot, P., Lidman, C., Cuby, J., Moreels, G., & Monnet, G. 2000, A&A, 354, 1134
- Sánchez-Blázquez et al. (2006) Sánchez-Blázquez, P., et al. 2006, MNRAS, 371, 703
- Sanders et al. (2007) Sanders, D. B., et al. 2007, ApJS, 172, 86
- Saracco et al. (2009) Saracco, P., Longhetti, M., & Andreon, S. 2009, MNRAS, 392, 718
- Suzuki et al. (2008) Suzuki, R., et al. 2008, PASJ, 60, 1347
- Taniguchi et al. (2007) Taniguchi, Y., et al. 2007, ApJS, 172, 9
- Thomas et al. (2005) Thomas, D., Maraston, C., Bender, R., & Mendes de Oliveira, C. 2005, ApJ, 621, 673
- Trujillo et al. (2006) Trujillo, I., et al. 2006, ApJ, 650, 18
- van Dokkum et al. (2009) van Dokkum, P. G., Kriek, M., & Franx, M. 2009, Nature, 460, 717
- van Dokkum et al. (2008) van Dokkum, P. G., et al. 2008, ApJ, 677, L5

| SED | Spectrum | ||||||||||||
|---|---|---|---|---|---|---|---|---|---|---|---|---|---|
| SFH | or | or | |||||||||||
| (Gyr) | (Gyr) | (Gyr) | () | () | (Gyr) | (Gyr) | (Gyr) | () | () | ||||
| (1) | (2) | (3) | (4) | (5) | (6) | (7) | (8) | (9) | (10) | (11) | (12) | (13) | |
| All | |||||||||||||
| SSP | |||||||||||||
| const. + quenching | |||||||||||||
| delayed exponential | |||||||||||||
| exp. + quenching | |||||||||||||
| All | |||||||||||||
| SSP | |||||||||||||
| const. + quenching | |||||||||||||
| delayed exponential | |||||||||||||
| exp. + quenching | |||||||||||||
| All | |||||||||||||
| SSP | |||||||||||||
| const. + quenching | |||||||||||||
| delayed exponential | |||||||||||||
| exp. + quenching | |||||||||||||
Note. — Column 1: star-formation history (see §3.1); Column 2,8: elapsed time since the onset of star-formation; Column 3,9: star-formation timescale in the case of delayed exponential SFH and quenching time for SFHs with constant SFR+quenching and exponentially increasing SFR+quenching; Column 4,10: star-formation weighted age defined by where is and is SFR; Column 5,11: stellar mass; Column 6,12: rest-frame -band mass-to-light ratio; Column 7,13: reduced for the best-fit template.