123123
S.W. Campbell
11email: simon.w.campbell@upc.edu 22institutetext: Centre for Stellar and Planetary Astrophysics, Monash University, PO Box 28M, Victoria 3800, Australia. 33institutetext: Research School of Astronomy and Astrophysics, Australian National University, Weston, ACT 2611, Australia. 44institutetext: Department of Physics and Astronomy, Aarhus University, Ny Munkegade, 8000 Aarhus C, Denmark. 55institutetext: Department of Astronomy and McDonald Observatory, University of Texas, Austin, TX 78712, USA.
The case of the disappearing CN-strong AGB stars in Galactic globular clusters – preliminary results
Abstract
A previously reported literature search suggested that the AGB stars in Galactic globular clusters may be showing different distributions of CN-strong and CN-weak stars as compared to their RGB stars. In most cases the second giant branches of GCs appeared to be deficient in stars with strong CN bands. However the sample sizes of AGB stars at that time were too small to give a definitive picture. Thus an observing campaign targeting GC AGB stars was proposed. We now have medium resolution spectral observations of about 250 GC AGB stars across 9 globular clusters, obtained with the 2dF/AAOmega instrument on the Anglo-Australian Telescope. In this paper we report some preliminary results regarding the distributions of CN-strong and CN-weak stars on the two giant branches of a selection of globular clusters. We find that some GCs show a total lack of CN-strong stars on the AGB, whilst some show a reduction in CN-strong stars as compared to the RGB. Standard stellar evolution does not predict this change in surface abundance between the two giant branches. We discuss some possible causes of this unexpected phenomenon.
keywords:
AGB stars – Globular cluster – Abundances – Cyanogen1 Introduction
Although Galactic globular clusters (GCs) are chemically homogeneous with respect to Fe and most other heavy elements (see e.g. Kraft et al. 1992), it has long been known that they show inhomogeneities in many lighter elements (e.g. C, N, O, Mg, Al). These inhomogeneities are considered anomalous because they are not seen in halo field stars of similar metallicity (see e.g. Gratton et al. 2000).
One of the first inhomogeneities discovered was that of the molecule cyanogen (CN, often used as a proxy for nitrogen). A picture of ‘CN-bimodality’ emerged in the early 1980s whereby there appears to be two distinct chemical populations of stars in most, if not all, GCs. One population is known as ‘CN-strong’, the other ‘CN-weak’ (we note that the CN-weak population might be more informatively called ‘CN-normal’ – as these stars show CN abundances similar to the Halo field stars). Originally, observations of CN were mainly made in stars on the giant branches but more recently there have been observations on the main sequence (MS) and sub-giant branch (SGB) of some clusters (e.g. Cannon et al. 1998). These observations show that there is little difference in the bimodal CN pattern on the MS and SGB as compared with the giants — indicating a primordial origin for the differing populations. Figure 6 in Cannon et al. (1998) exemplifies this situation.
Due to the paucity of asymptotic giant branch (AGB) stars in GCs (a result of their short lifetimes) there have been very few systematic observational studies of the CN anomaly on the AGB in globular clusters (Mallia 1978 is one of which we are aware). What little that has been done has been an aside in more general papers (e.g. Norris et al. 1981, Briley et al. 1993, Ivans et al. 1999). However these studies have hinted at a tantalising characteristic: most (observed) GCs show a lack of CN-strong stars on the AGB. If this is true then it is in stark contrast to the red giant branch (RGB) and earlier phases of evolution, where the ratio of CN-Strong to CN-Weak stars is roughly unity in many clusters.
This possible discrepancy was noted by Norris et al. (1981) in their paper about abundances in giant stars in NGC 6752. They state that “The behaviour of the CN bands in the AGB stars is… quite difficult to understand… not one of the stars studied here has enhanced CN… yet on the [first] giant branch there are more CN strong stars than CN weak ones.” (also see Figure 3 of that paper).
Motivated by this observation we conducted a literature search to ascertain whether this was true of other GCs (Campbell et al. 2006). The literature search revealed that the AGB star counts for all studies (which are not, in general, studies about AGB stars in particular) are low, usually being (see Table 1 of Campbell et al. 2006). The search also revealed that the picture may not be consistent between clusters. Although most clusters appear to have CN-weak AGBs, at least two seem to have CN-strong AGBs (M5 & 47 Tuc). To further complicate the picture, clusters often appear to have a combination of both CN-strong and CN-weak stars on their AGBs. Again, all these assertions are however based on small sample sizes.
We note that Sneden et al. (2000) also presented a conference paper on this exact topic. Compiling the data in the literature at the time they discussed the relative amounts of CN in AGB and RGB stars in the GCs. They also discuss Na abundance variations in M13. In their closing remarks they suggest observations with larger sample sizes are needed — which may be done using wide-field multi-object spectroscopes. This is the same conclusion the present authors also came to.
Here we present some preliminary results of a study that increases the GC AGB sample sizes substantially. With this new information we hope to confirm or disprove the existence of these abundance differences.
2 The AGB Samples – Photometry & Astrometry

A vital ingredient in being able to find significant numbers of AGB stars in globular clusters is having photometry good enough to separate the AGB from the RGB. Photometric observations have now reached such high accuracy that it is becoming feasible to separate the AGB and RGB populations reliably. During our literature search (Campbell et al. 2006) we came across some very high-quality photometric studies, such as the study of M5 by Sandquist & Bolte (2004). Their set of observations is complete out to 8-10 arc min. They also tabulate all their stars according to evolutionary status – and find 105 AGB stars! This represents a 10-fold increase in sample size. For the current study we have used the Sandquist & Bolte (2004) sample for M5, plus a range of other CMDs, mostly from Grundahl et al. (1999). The Grundahl CMDs are in the Strömgren system (Strömgren 1966). In Figure 1 we show an example of our CMD selection of AGB stars, for NGC 6752. In this case 28 AGB stars were identified and 24 were observed during our observing run.
Using a multi-object spectroscopy instrument placed a further constraint on the AGB samples. Very accurate astrometry was needed. This reduced some of the sample sizes. Also, due to crowding on the 2dF field plate, a few more stars were lost from each sample. In all our AGB sample was reduced from stars to stars, across 10 GCs: NGC 1851, NGC 288, NGC 362, NGC 6752, M2, M4, M5, M10, 47 Tuc, and Omega Cen.
In our GC sample we have included the outlier – M5, which appears to have a majority of CN-strong stars on its AGB, a fact that may cause problems for some explanations of the (possible) phenomenon. We also include 47 Tuc, which shows a mix of CN-weak and CN-strong (Mallia 1978).
In addition to the AGB samples we also have selections of RGB stars, red HB stars, and ‘bright giant branch’ (BGB) stars (the brightest stars in the CMDs, for which we couldn’t split the RGB and AGB - see Figure 1). The RGB stars serve as checks, since these populations are usually well studied in terms of CN, plus they have similar luminosities and temperatures as the AGB stars. The HB stars may provide information on which stars proceed to the second giant branch and which do not (assuming the CN-weak AGB phenomenon is real).
In all we now have a database of stars at various stages of evolution in 10 GCs with accurate photometry and astrometry.
3 Observations
The observing run consisted of 5 nights on the Anglo-Australian Telescope (AAT). We used the multi-object spectroscope, AAOmega/2dF. On the blue arm we used the 1700B grating, which gave a spectral coverage of 3755 to 4437 , which includes the blue CN and CH bands. On the red arm we used the 2000R grating. The resolution of the spectra is . Near the CN bands the S/N , rising to at the CH bands.
4 Preliminary Results
Data reduction and analysis is still ongoing. We are using the 2dFdr software provided by the AAO for initial reductions, then IRAF for analysis.
Although the spectra are only of moderate resolution it is sufficient to check for cluster non-members (or binaries) using radial velocities. For this we used the IRAF command . So far we have only found 1 or 2 stars per cluster that show strongly deviant velocities, which suggests there is not much noise in our sample from non-members.
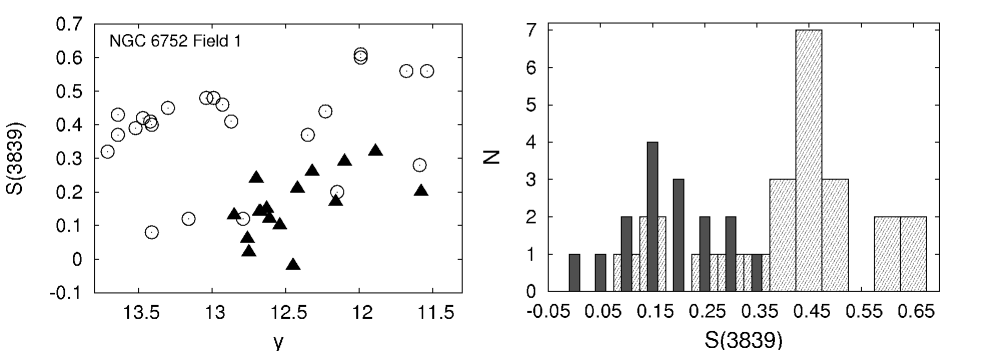
To quantify the CN band strengths in each star we use the S(3839) CN index of Norris et al. (1981) which compares a section of the CN bands with a neighboring pseudo-continuum:
| (1) |
IRAF was used to measure the integrated fluxes. We discarded data with low counts, effectively putting a lower limit on the S/N of at the CN bands. In Figure 2 we show some results for NGC 6752. This is the cluster investigated by Norris et al. (1981) that inspired the current study. They reported that all of their 12 AGB stars were CN-weak, as opposed to the RGB sample which showed bimodality. Our Figure 2 shows the same – a clear bimodality in the RGB sample, whilst all the AGB stars are CN-weak! This preliminary result is based on one of the three 2dF fields, which includes 16 AGB stars and 23 RGB stars. We include a histogram of this data in the right-hand panel of the figure. Indeed the CN-weak AGB is very clear-cut, even without ‘de-trending’ the data for temperature effects on the CN band strengths.
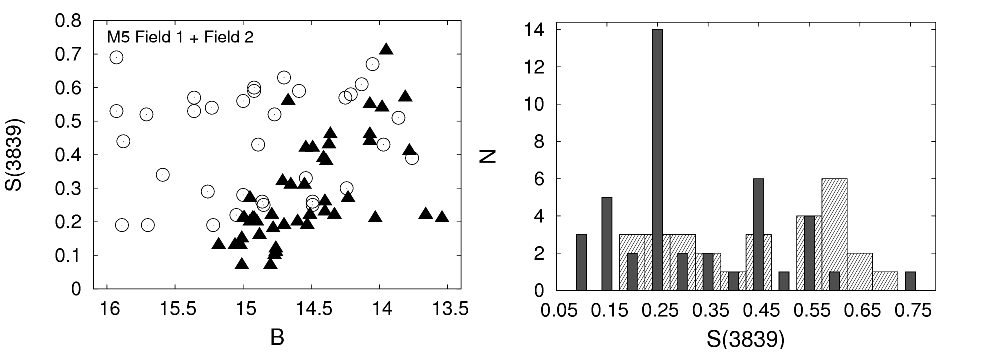
In Figure 3 we show the data for all of the M5 RGB and AGB stars for which we have spectra. The 42 AGB and 28 RGB stars are a combination of both the two 2dF fields that we observed. Here we can see that the situation is not as clear-cut as in NGC 6752 – the bimodality of the RGB can be seen, however the AGB also presents a bimodal distribution of CN-strong and CN-weak stars. However, contrary to the results of Smith & Norris (1993), who report a CN-strong majority on the AGB, our sample shows a definite CN-weak majority on the AGB. The source of the difference may be that the Smith & Norris (1993) sample only contains 8 AGB stars.
Finally we note that our preliminary results for NGC 288 (not displayed here) show a very similar picture to NGC 6752 – a clear-cut bimodality on the RGB and a totally CN-weak dominated AGB.
5 Discussion
The preliminary results of the current study strongly support the unexpected phenomenon in which CN-rich stars seem to ‘disappear’ between the RGB and AGB, leaving CN-weak dominated AGBs.
There is the possibility that the measurements of CN in AGB stars are biased in some way, either by gravity or temperature differences as compared to the RGB stars. However, as discussed by Norris et al. (1981), the fact that we see stars at the same temperature on the RGB with varying CN band strengths indicates that this is not affecting the results. The higher luminosity of the AGB stars at the same temperatures would tend to increase the CN band strengths, indicating that gravity also is not affecting the results. Furthermore, in some of our observations we see CN-rich AGBs as well as CN-weak AGBs in the same cluster, which again indicates that the AGB measurements are not affected by their slightly different properties. We do however plan to perform spectral synthesis calculations to double-check. A benefit of the current study is that our spectra data set is homogeneous (since all the spectra were taken on the same instrument).
If we accept the above arguments and that the paucity (or total lack of) CN-strong stars on the AGB is real, then we need to look at evolutionary affects. There is however no known reason why the surface abundance of CN (which is a proxy for N) should reduce when a star evolves from the RGB to the AGB, at least in standard stellar evolution theory. Moreover, due to the well-known ‘deep mixing’ effect that increases the N abundances (at the expense of C) in stars as they ascend the RGB (e.g. Shetrone 2003), this is actually the opposite to what we would expect on the AGB – we would predict, if anything, more CN-strong stars on the AGB!
Norris et al. (1981) proposed two possible explanations to explain the (apparent) lack of CN-strong stars on the AGB:
-
1.
The two populations in NGC 6752 have different He abundances (they suggest ). This may have come about through a merger of two proto-cluster clouds with differing chemical histories or through successive generations of stars (i.e. self-pollution). The He-rich material would also be N-rich. The He-rich stars would then evolve to populate the blue end of the HB – and not ascend the AGB – leaving only CN-normal stars to evolve to the AGB.
-
2.
Mixing in about half of the RGB stars pollutes their surfaces (increasing N) and also increases mass-loss rates, again leading to two separate mass groups on the HB. As before, the CN-strong, low mass group does not ascend the AGB.
A constraint on the first explanation (for NGC 6752) is that about half the mass of the cluster must be polluted, as the number of CN-strong and CN-normal stars is (usually) roughly equal. As Norris et al. state, this is not a serious problem for the merger scenario, as the merging clouds/proto-clusters may very well have had similar masses. However, due to the constancy of Fe group elements, the chemical histories of the two clouds/proto-clusters would have to have been identical with respect to these heavy elements. This is more difficult to explain since we require differing chemical histories for the light elements.
In light of recent observations on the MS and SGBs of some clusters, the second explanation by Norris et al. may require some clarification. As N appears to have a preformation source (as evidenced by MS observations), the extra mixing is not required (although it does still exist). However, the general suggestion that the differing compositions may affect mass-loss rates and lead to different mass populations on the HB may be a valid one. We are calculating stellar models that include this effect.
An important point apparent in the current results is that there appears to be a variation in the number of CN-strong stars that ‘disappear’ – some GCs show a total lack of CN-strong stars on their AGBs, whilst some show a mix of CN-strong and CN-weak, although they are still dominated by CN-weak stars. Theories such as those of Norris et al. (1981) will have to account for this point also.
Finally, the substantial abundance differences between the GC RGBs and AGBs reported here may reveal other clues to the GC abundance anomaly problems (i.e. those of the heavier p-capture products - see Sneden et al. 2000 for a discussion), and even the GC formation problem. The rest of the results from this study will be published soon, including a more in-depth analysis and discussion.
Acknowledgements.
The Authors wish to thank the Local and Scientific Organising Committees of the Tenth Torino Workshop on Nucleosynthesis in AGB Stars, held at Canterbury University in Christchurch, New Zealand. We also thank the creators and maintainers of the very useful observational datasets and software: 2MASS, GSC, 2dFdr, SIMBAD, IRAF, Aladin and VizieR. SWC acknowledges the support of the Consejo Superior de Investigaciones Científicas (CSIC, Spain) JAE-DOC postdoctoral grant and the MICINN grant AYA2007-66256. RJS acknowledges support from the Australian Research Council’s Discovery Projects funding scheme (project number DP0879472).References
- Briley et al. (1993) Briley, M. M., Smith, G. H., Hesser, J. E., Bell, R. A., 1993, AJ, 106, 142
- Campbell et al. (2006) Campbell, S. W., Lattanzio, J. C., Elliott, L. M., 2006, MmSAI, 77, 864
- Cannon et al. (1998) Cannon, R. D., Croke, B. F. W., Bell, R. A., Hesser, J. E., Stathakis, R. A., 1998, MNRAS, 298, 601
- Gratton et al. (2000) Gratton, R. G., Sneden, C., Carretta, E., Bragaglia, A., 2000, A&A, 354, 169
- Grundahl et al. (1999) Grundahl, F., Catelan, M., Landsman, W. B., Stetson, P. B., Andersen, M. I., 1999, ApJ, 524, 242
- Ivans et al. (1999) Ivans, I.I., Sneden, C., Kraft, R.P., Suntzeff, N.B., Smith, V.V., Langer, G.E., Fulbright, J.P., 1999, AJ, 118, 1273I
- Kraft et al. (1992) Kraft, R. P., Sneden, C., Langer, G. E., Prosser, C. F., 1992, ApJ, 104, 645
- Mallia (1978) Mallia, E. A., 1978, A&A, 70, 115
- Norris et al. (1981) Norris, J., Cottrell, P. L., Freeman, K. C., Da Costa, G. S., 1981, ApJ, 244, 205
- Sandquist & Bolte (2004) Sandquist, E. L., Bolte, M, 2004, ApJ, 611, 323
- Shetrone (2003) Shetrone, M. D., 2003, ApJ, 585L, 45
- Smith & Norris (1993) Smith, G. H., Norris, J, E., 1993, AJ, 105, 173
- Sneden et al. (2000) Sneden, C., Ivans, I. I., Kraft, R. P., 2000, MmSAI, 71, 657
- Strömgren (1966) Strömgren, B., 1966, ARA&A, 4, 433