Spitzer Space Telescope observations of the Carina Nebula: The steady march of feedback-driven star formation††thanks: Based on observations made with the Spitzer Space Telescope, which is operated by the Jet Propulsion Laboratory, California Institute of Technology under a contract with NASA. Support for this work was provided by NASA through an award issued by JPL/Caltech.
Abstract
We report the first results of imaging the Carina Nebula (NGC 3372) with the Infrared Array Camera (IRAC) onboard the Spitzer Space Telescope, providing a photometry catalog of over 44,000 point sources as well as a catalog of over 900 candidate young stellar objects (YSOs) based on fits to their spectral energy distributions (SEDs). We discuss several aspects of the extended emission, including the structure of dozens of dust pillars that result when a clumpy molecular cloud is shredded by feedback from massive stars. There are surprisingly few of the “extended green objects” (EGOs) that are normally taken as signposts of outflow activity in Spitzer data, and not one of the dozens of Herbig-Haro jets detected optically are seen as EGOs. EGOs are apparently poor tracers of outflow activity in strongly irradiated environments, due to the effects of massive star feedback. A population of “extended red objects” tends to be found around late O-type and early B-type stars, some with clear bow-shock morphology. These are dusty shocks where stellar winds collide with photoevaporative flows off nearby clouds. Finally, the relative distributions of O-type stars, small star clusters, and sub-clusters of YSOs as compared to the dust pillars shows that while some YSOs are located within dust pillars, many more stars and YSOs reside just outside pillar heads. We suggest that pillars are transient phenomena, part of a continuous outwardly propagating wave of star formation driven by feedback from massive stars. As the pillars are destroyed, they leave newly formed stars in their wake, and these are then subsumed into the young OB association. The YSOs are found predominantly in the cavity between pillars and massive stars, arguing that their formation was in fact triggered. Altogether, the current generation of YSOs shows no strong deviation from a normal initial mass function (IMF). The number of YSOs is consistent with a roughly constant star-formation rate over the past 3 Myr, implying that propagating star formation in pillars constitutes an important mechanism to construct unbound OB associations. These accelerated pillars may give birth to massive O-type stars that, after several Myr, could appear to have formed in isolation.
keywords:
H ii regions — ISM: individual (NGC 3372) —– stars: formation –— stars: luminosity function, mass function — stars: pre-main-sequence1 INTRODUCTION
Most stars form in OB associations, where the stellar winds, UV radiation, and eventual supernova (SN) explosions from the massive members significantly impact the environment. The feedback from newly born massive stars will ultimately destroy their natal molecular cloud, clearing away the dust and gas and thereby shutting off star formation and determining the star formation efficiency. In the process, the same feedback may simultaneously trigger the birth of new generations of stars, allowing star formation to propagate continuously from one point to the next (Elmegreen & Lada 1977). This distributes the star formation in space and time, giving rise to significant age spreads in the resulting stars. This mode of star formation may give rise to large OB associations, rather than compact single star clusters. The southern Milky Way provides a striking example of this contrast: the Carina Nebula and the cluster NGC 3603 have roughly the same number of O-type stars and roughly the same ionizing photon output (Smith 2006; Crowther & Dessart 1998), but NGC 3603 is dominated by a single dense cluster within a radius of 1 pc, whereas the O-type stars in Carina are distributed in several sub-clusters over 10–20 pc.
Evidence suggests that the dust pillars commonly seen at the borders of H ii regions may be prime sites for this mode of propagating star formation (Bally & Reipurth 2003; McCaughrean & Andersen 2002; Jiang et al. 2002; Stanke et al. 2002; Smith et al. 2005; Rathborne et al. 2004). Whether or not the second generation of stars forming in the pillars was triggered is still unclear: it is difficult to verify whether the stars began to form spontaneously due to initial clumps in the cloud and were simply uncovered by the advancing ionization front, whether their parent clumps were agglomerated in the “collect and collapse” scenario (Elmegreen 1992) where these clumps subsequently formed stars under their own self-gravity, or if they were triggered directly via radiation-driven implosion (Oort & Spitzer 1955; Kahn 1969; Dyson 1973; Elmegreen 1976; Bertoldi 1989; Bertoldi & McKee 1990; Williams et al. 2001; Gorti & Hollenbach 2002). Star formation in these environments plays a critical role in the evolution of H ii regions and the interstellar medium (ISM) (e.g., Elmegreen & Scalo 2004).
The Carina Nebula is a special case among massive star-forming regions in the Milky Way: like the Orion Nebula, it is near enough (2.3 kpc; Smith 2006) to facilitiate studies of the details of faint nebular emission and the population of low to intermediate mass stars forming alongside massive stars, but unlike Orion, Carina has over 70 O-type stars and samples the top end of the stellar mass function. This provides a large region over which to investigate the impact of massive-star feedback. The global properties of the Carina Nebula have been discussed recently by Smith & Brooks (2007). See Smith (2006) for a census of the massive stars that power Carina, and see Walborn (1995, 2009) for excellent reviews of the remarkable collection of extreme O-type stars in the region. The stellar content of the massive central clusters Trumpler (Tr) 14 and 16 includes Carinae, three WNH stars, and a number of the most extreme early O-type stars known (e.g., Walborn et al. 2002a). In fact, Carina is the first region where the earliest spectral type O stars were recognized (Walborn 1973). All other regions in the Milky Way with a comparable stellar population are more distant and more obscured by dust. Thus, Carina provides a laboratory for low-mass star formation and protoplanetary disks in regions analogous to much more extreme starbursts that are far too distant for such studies.
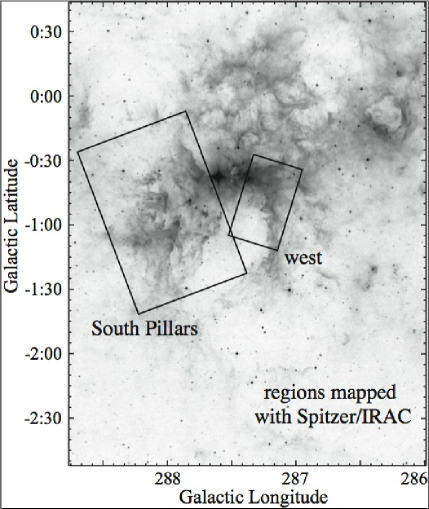
Although a great number of massive stars have formed in the past 3 Myr in Carina, the current hot-bed of star formation activity has migrated to the southern part of the nebula, in a region called the South Pillars (Smith et al. 2000). The widespread ongoing star-formation activity in the South Pillars, as well as the structure of the pillars themselves, was first recognized based on wide-field IR images (Smith et al. 2000) obtained with the Midcourse Space Experiment (MSX). (There appear to be several other regions of ongoing star formation to the north and west as well, which are less active than the South Pillars.) An 8.6 m MSX image of the Carina Nebula is shown in Figure 1. The presence of active, ongoing star formation in this region has since been confirmed by obervations of embedded young clusters like the “Treasure Chest” and others (Smith et al. 2005; Rathborne et al. 2002, 2004; Hägele et al. 2004) and a large number of outflows in the form of irradiated Herbig-Haro (HH) jets throughout the region (Smith et al. 2004a, 2010). There are many dense cores detected in C18O that are spread across the region, providing sites of ongoing and potential future star formation, with some evidence for molecular outflow activity (Yonekura et al. 2005).
The South Pillars are intriguing because they provide a powerful laboratory in which to study the details of the feedback mechanism by which massive stars destroy their natal molecular clouds. In the process, the massive stars influence subsequent generations of stars and planets forming in the surrounding region. Perhaps the birth of some of those newly formed stars was even directly triggered by the external feedback. The massive stars also clear away and illuminate the surrounding gas as we witness the assemblage of an OB association. Study of regions like the South Pillars, where young stars are forming in the immediate vicinity of several dozen stars that will explode as supernovae in the next 1–2 Myrs, may have implications for our own Solar System (see Smith & Brooks 2007).
In this paper we present the first results from observations of the Carina Nebula obtained with the Spitzer Space Telescope (Werner et al. 2004; Gehrz et al. 2007). This is the first systematic study of the IR properties of the stars, dust, and gas in the South Pillars of Carina, so our aim here is to give a broad overview of the region as seen at 3-8 m; more detailed multi-wavelength studies will follow. We present our observations in §2, we discusss the photometry of point sources and the distribution of observed properties among the point source spectral energy distributions (SEDs) in §3, and in §4 we discuss various properties of the extended gas and dust emission and how it relates to nearby stars. This includes extended green objects (§4.2), extended red objects (§4.3), relationships between dust pillars and massive stars (§4.4 and 4.5), and the discussion of a newly recognized star cluster near Tr 16 that was obscured behind a dark dust lane at visual wavelengths (§4.6). In §5 we synthesize the main results, and in §6 we recap with a list of our main conclusions. There are several additional and more detailed results and implications from these data, which cannot be described in full here, but will be included in future papers.
2 OBSERVATIONS
We used the Infrared Array Camera (IRAC; Fazio et al. 2004) onboard Spitzer to map portions of the Carina Nebula in the four bandpasses available with that instrument, centered at 3.6, 4.5, 5.8, and 8.0 m. Because of its intrinsic expanse and its proximity, diffuse emission associated with the Carina Nebula covers many square degrees on the sky at optical to mid-IR wavelengths (see Smith & Brooks 2007). The two fields we targeted with IRAC, shown in Figure 1 superposed on an image obtained with the Midcourse Space Experiment (MSX; Egan et al. 1998), were chosen based on earlier results from MSX showing extended mid-IR emission at lower resolution in Carina (Smith et al. 2000; Smith & Brooks 2007). Motivated by these earlier resuts, we chose to observe the South Pillar region because it represented the complex structure of a clumpy molecular cloud being shredded by feedback from nearby massive stars, resulting in an army of dust pillars with signs of current embedded star formation amid a large number of recently formed young stars. The western region was chosen because it represented a clean edge-on view of an ionization front and photodissiciation region, also showing signs of active ongoing star formation. In both regions, dust pillars point back to the central part of the nebula, suggesting that they are at the same distance and that the dust pillars are in fact shaped by those massive stars (see Smith et al. 2000).
We did not target central regions of the nebula near Carinae itself using IRAC because of potential danger to the IRAC detectors. MSX also showed possible evidence for ongoing star formation in regions of Carina that are north of Tr 14 and Tr 16, but these regions seemed to have less vigorous star formation activity, and interpreting their true location was complicated by geometrical effects and the presence of the Tr 15 cluster, whose distance is not as certain as Tr 14 and Tr 16. Therefore, we did not target regions to the north in this program.
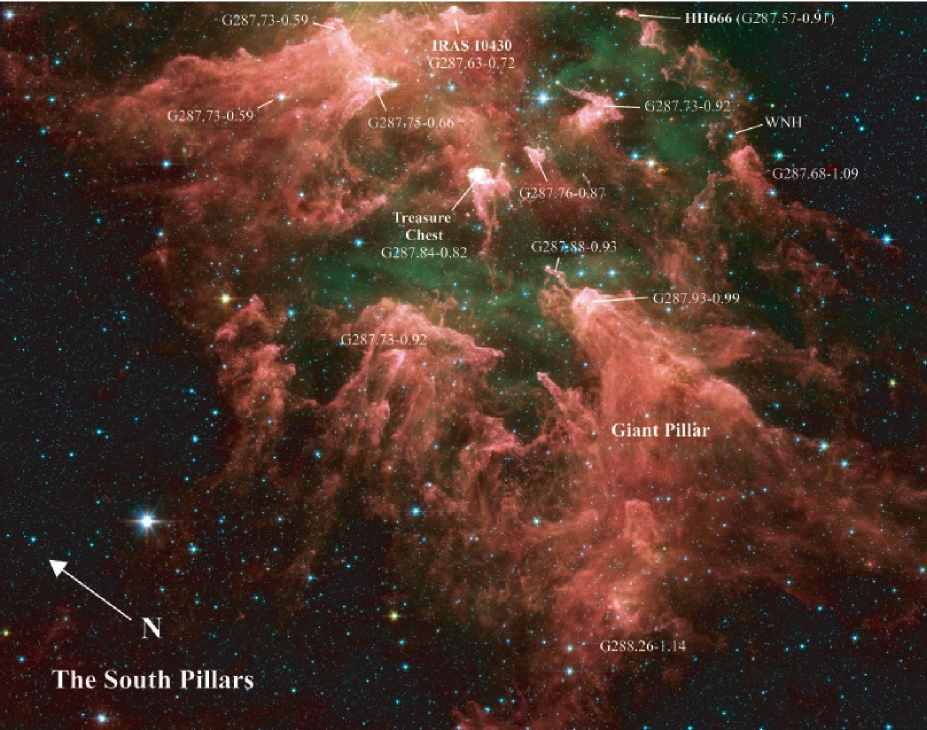
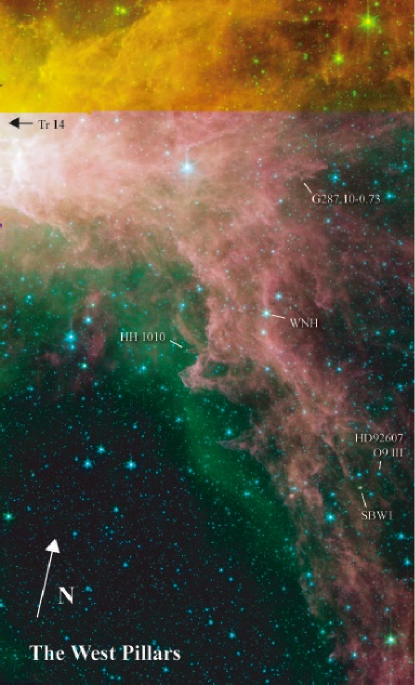
The IRAC data were reduced and combined into a large mosaic using the pipeline developed for the Galactic Legacy Infrared Midplane Survey Extraordinaire (GLIMPSE; see Benjamin et al. 2003; Churchwell et al. 2009).111See http://www.astro.wisc.edu/glimpse/docs.html. With the aim of studying the low-mass (1–3 ) young stellar population, we obtained deeper images at each position (16 2 sec) than were obtained at most positions in the GLIMPSE survey (2 2 sec) where maximizing areal coverage was the driving factor. Additionally, the South Pillars are 1° out of the Galactic plane, so the confusion limit was less restrictive than in most parts of the inner Galactic plane seen by GLIMPSE. The final mosic pixel scale was 06, subsampled by 2 from the raw pixel scale of 12, with a FWHM spatial resolution of roughly 2″ at IRAC wavelengths. The full mosaic color images of the South Pillars and the western region made with IRAC are shown in Figures 2 and 3, respectively.
To create a catalog of point source photometry from the IRAC data, we used the GLIMPSE point-source extractor tool, which is a modified version of DAOPHOT. This resulted in the detection of 53,905 point sources, 48,642 of which were in the area observed by all four IRAC bands (i.e., there were 5,263 sources that fell at the ends of the mapped regions and were only detected in Bands 1 and 3, or Bands 2 and 4). We then cross-referenced these IRAC point sources with the Two-Micron All Sky Survey (2MASS) point source catalog (Skrutskie et al. 2006) to produce a merged 2MASS+IRAC Carina point-source catalog of 44,032 sources that were detected in four or more filters (36,720 in the South Pillars field, and 7312 in the western region; see Figure 1). Of these, 42,626 were fit by stellar photospheres, many of which are foreground and background sources. Carina is seen along the tangent point of the Carina spiral arm, providing substantial background contamination. 1,406 sources could not be well fit by photospheres, and many of these are young stellar objects (YSOs) as discussed in the following section. A brief summary of point source results is given in Table 1, and an electronic version of the Carina point source catalog is available at http://www.astro.wisc.edu/glimpse/Carina_Nebula/.
| Parameter | South Pillars | West Region | Total | Comment |
| Total | 44,428 | 9,477 | 53,905 | all detected IRAC point sources |
| Cropped | 40,605 | 8,037 | 48,642 | in region observed by 4 IRAC bands |
| 2MASS+IRAC | 36,720 | 7,312 | 44,032 | merged, detected in at least 4/7 filters |
| Photospheres | 35,531 | 7,095 | 42,626 | well-fit by stellar photospheres |
| Excess | 1,189 | 217 | 1,406 | poorly fit by stellar photospheres |
| candidate YSOs | 804 | 105 | 909 | SED well fit by YSO models |
| Stage 0/I | 140 | 17 | 157 | SED well fit by YSO models |
| Stage II | 195 | 19 | 214 | SED well fit by YSO models |
| Stage III | 37 | 11 | 48 | SED well fit by YSO models |
| Ambiguous | 432 | 58 | 490 | SED well fit by YSO models |
| Class I | 151 | 13 | 164 | color-color |
| Class II | 451 | 63 | 514 | color-color |
| Class III | 140 | 17 | 157 | color-color |
3 Point Sources
3.1 SED-Based Selection and Analysis of YSOs
The South Pillar and Western regions we observed with Spitzer/IRAC include many thousands of point sources projected on the sky amid dust pillars and other diffuse emission, but the ones that we are most interested in are the young stellar objects (YSOs) that trace the current and recent star formation in the region. Some are still embedded in the pillars, and many more are not. With the point source catalog derived from the Spitzer observations of the South Pillars and the West region in Carina, we used the grid of young stellar object (YSO) models from Robitaille et al. (2006) and the SED fitting tool of Robitaille et al. (2007) to identify and characterize candidate YSOs.
The model grid consists of 20,000 two-dimensional Monte Carlo radiation transfer models (Whitney et al. 2003a, 2003b, 2004) spanning a complete range of stellar mass and evolutionary stage and output at 10 viewing angles (inclinations), so the fitting tool has 200,000 SEDs to choose among when applied to the broadband photometric data. An additional set of 7853 model stellar atmospheres and the mid-IR interstellar extinction law of Indebetouw et al. (2005) were included in the Robitaille et al. (2007) fitting tool to facilitate filtering of sources consistent with stellar photospheres reddened by interstellar dust only. The procedure we used to select candidate YSOs was described in detail by Povich et al. (2009; see also Shepherd et al. 2007; Indebetouw et al. 2007).
To summarize, we first fit stellar atmosphere SEDs to 44,032 sources from the highly-reliable point-source catalogs (including both the South Pillars and West fields) that met the following criteria: (1) Sources located in regions of the sky observed in all 4 IRAC bands; and (2) Sources detected in out of the 7 combined 2MASS+IRAC bands in the catalog. To avoid biasing the fits for sources where the photometric uncertainties may have been underestimated in the catalog, we conservatively reset the uncertainties to a minimum value of 10% before fitting any models. We considered a source to be well-fit by a stellar atmosphere if the (non-reduced) goodness-of-fit parameter, normalized by the number of distinct bands in which the source was detected, satisfied . The number of sources thus identified as normally reddened stellar photospheres was 42,626. The remaining 1406 sources, shown in Figure 4, could not be fit well by stellar atmospheres because either (1) they exhibit IR emission circumstellar dust that creates an excess emission above the stellar photosphere, or (2) they suffer from systematic photometric uncertainties larger than the reset uncertainties from the catalog, which can create spurious IR excess emission.
The most common case of spurious IR excess emission occurs when a star is detected in the IRAC 3.6 and 4.5 m bands and its flux density is significantly over-estimated in the IRAC 8.0 or (less commonly) 5.8 m band because a noise peak or diffuse emission is extracted at the position of the point source (Povich et al. 2009). This most often occurs for faint sources near the detection limit, especially in regions of bright diffuse emission, since stars are fainter at longer wavelengths, diffuse emission is brighter, and the IRAC 5.8 and 8.0 m bands have lower sensitivity. For this work, we have developed a series of color cuts to automatically cull out sources with probable spurious IR excess, where “spurious” is defined as:
-
1.
[8.0] excess only. IR excess occurs only at 8.0 m; all other bands consistent with a stellar photosphere.222Note that this will automatically cut out any “transition disks” that may be present in the sample. Because of the bright background in Band 4, the inclusion of data at longer wavelengths is necessary to study these sources with possible inner disk holes.
-
2.
[5.8] excess only. IR excess occurs only at 5.8 m; all other bands consistent with a stellar photosphere (in this case the source is almost never detected at 8.0 m).
-
3.
[5.8] and [8.0] displacement. IR excess at both 5.8 and 8.0 m, but the color as in a stellar photosphere. This is relatively uncommon among Catalog sources, and the explanation is not clear.
To obtain a highly-reliable sample of candidate YSOs, we begin by selecting only sources detected at both 3.6 and 4.5 m. Sources are then considered candidate YSOs if the following conditions are met:
| (1) | |||||
| (2) | |||||
| (3) |
where the denote magnitudes and the are uncertainties on the colors computed from the (minimum 10%) uncertainties on catalog flux densities. 454/1406 sources poorly-fit by stellar photospheres fail to meet the conditions of Equations 1–3; these are plotted as yellow circles in Figure 4.
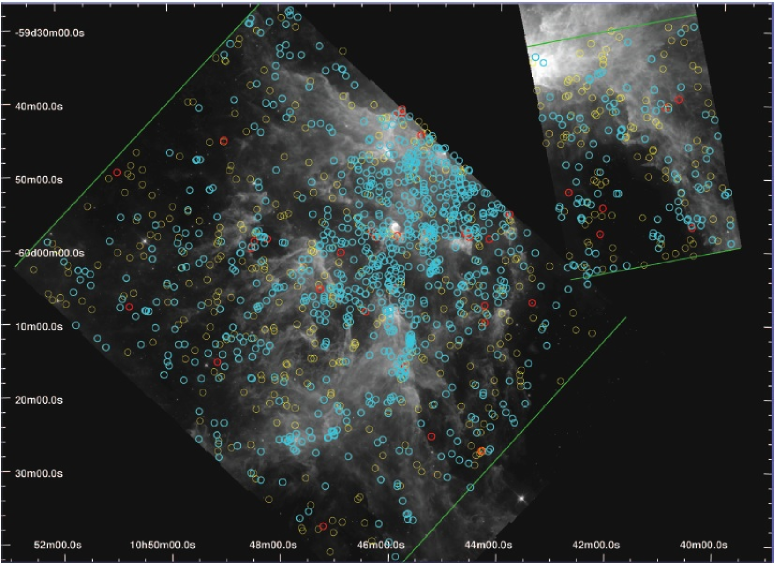
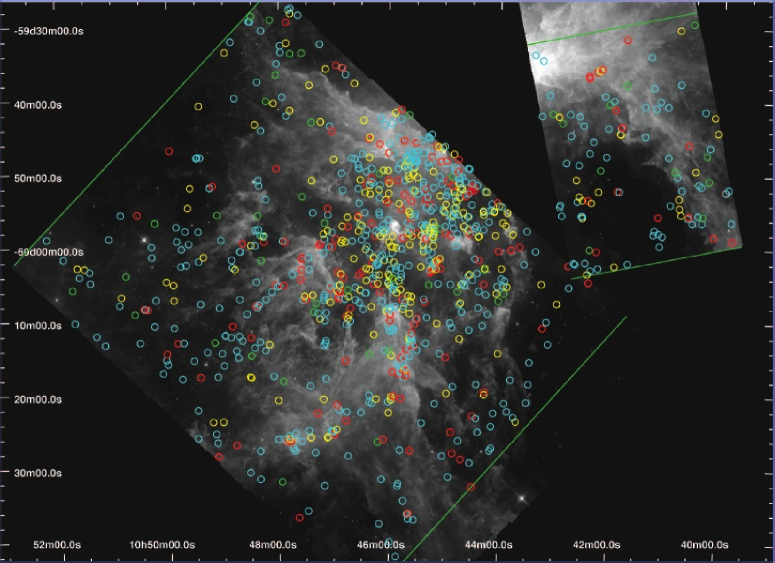
Finally, we fit the 952 sources that have passed through all the above filters with YSO models, and apply the same criterion to classify sources as well-fit by YSO SEDs. The large majority, 909/953, are well-fit by YSO models, and these are plotted as cyan circles in Figure 4; these sources are entered into our YSO catalog (Table Y1). The remaining 43 sources are plotted as red circles.
The YSO models can be divided into evolutionary stages that parallel the traditional observational “class” taxonomy, where Stage 0/I are deeply embedded protostars, Stage II are pre-main sequence (PMS) stars with optically thick circumstellar disks, and Stage III are PMS stars with optically thin disks (see section 3.1 of Robitaille et al. 2006). In general, a given source can be fit by multiple YSO models, so for each YSO in the catalog we define a set of well-fit models according to
| (4) |
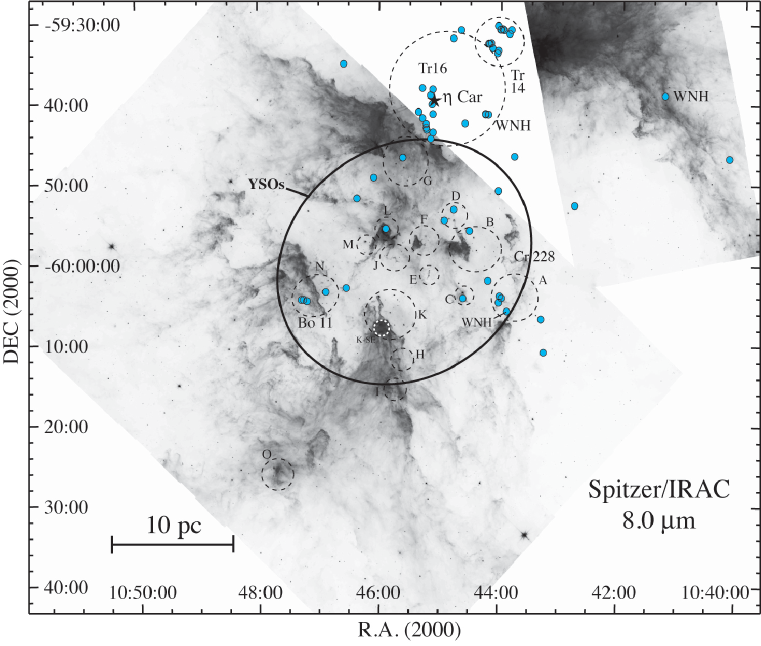
where is the goodness-of-fit parameter for the best-fit model (Povich et al. 2009). If of the models (weighted by ) fit to a given source correspond to a single evolutionary stage, then we assign that stage to that source, otherwise the stage is considered ambiguous. This is philosophically different from the approach of classifying all candidate YSOs on the basis of colors or spectral indices (e.g. Allen et al. 2004) because it acknowledges the model-dependent nature of the physical interpretation of the classifications and the blurry boundaries between the classes. It also acknowledges degeneracies in color and evolutionary stage. Locations of the 909 sources well-fit by YSO models are plotted in Figure 5, color-coded according to evolutionary stage. Note that 54% (490/909) of the candidate YSOs plotted in Figure 5 have ambiguous stage classifications, and retain their cyan colors from Figure 4. This relatively high fraction of ambiguous sources could be reduced with additional constraints on the SEDs at m; MIPS 24 m photometry, for example, has proved useful to help discriminate between disk-dominated and envelope-dominated YSOs (Indebetouw et al. 2007; Povich et al. 2009). A summary of YSO properties is provided in Table 1, although note that the numbers of sources given in Table 1 are certainly underestimates for the true number of YSOs and their subtypes (see §3.3).
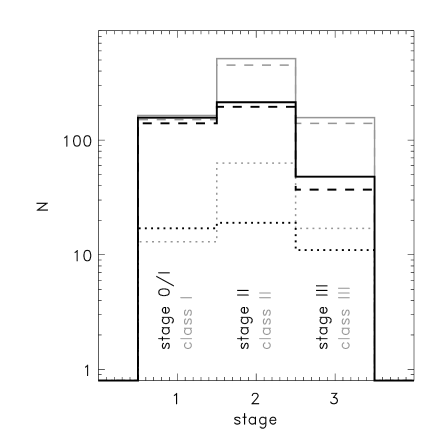
Most of the “ambiguous” stage YSOs are probably in between Stage 0/I and Stage II. Figure 6 shows a histogram of the number of YSOs classified in each stage by the SED fitter (black lines) as compared to a standard classification as Class I, II, or III (photospheric) based on color-color selection (gray lines), following the criteria of Allen et al. (2004). The dotted lines show the West region, the long dashes are for the South Pillars, and the solid lines are for both regions. While the numbers of embedded protostars (Stage 0/I and Class I) are similar in both methods, the color-color selection (which has no “ambiguous” stages) has vastly more Class II sources than Stage II sources from the SED fitter. Most of the “ambiguous” sources from the SED fitter would therefore have been classified as Class II protostars, although we cannot classify them reliably as disk-dominated or envelope-dominated without data at longer wavelengths.
Contamination of the YSO catalog by background dusty active galactic nuclei (AGN) is a concern, because they can have similar colors. Harvey et al. (2007) characterized the extragalactic contaminants in Spitzer c2d images of the Serpens star forming region and found that background star-forming galaxies and dusty AGN are generally faint, with [4.5] 13.05 mag. In our YSO catalog, 87/907 (10%) of sources fall below this [4.5] cutoff. Carina is 10 times more distant than Serpens and lies near the Galactic midplane ( 1°). We therefore expect many low-mass YSOs in Carina to be fainter than this cutoff. We also expect that the additional extinction toward extragalactic sources renders them fainter in our sample compared to the c2d sample. For these reasons, 10% is a high upper limit to the true extragalactic contamination fraction in our catalog. Applying less conservative IRAC color-mag selection criteria of Harvey et al. (2006) results in only 2 extragalactic candidates. The true fraction of extragalactic sources in the YSO catalog is likely to be well below a reasonable limit of 5%.
3.2 Spatial Distribution of YSOs
It is immediately clear from Figure 4 that the YSO population in Carina is not evenly distributed across the area observed by IRAC. The vast majority of YSOs are concentrated in a large cluster in the center of the image, occupying a 25′ (17 pc) diameter cavity encircled by PAH emission from dust pillars. These sources are a mix of Stage 0/I and Stage II, with many ambiguous classifications that are confused between these two stages. Most of the sources are Stage II, however, suggesting ages of 1 Myr (e.g., Haisch et al. 2001). One gets the impression that 1 Myr ago, this central cavity of the South Pillars was teeming with Class 0 protostars, molecular outflows, and dense cores. Now the gas has been mostly cleared from this central region, exposing the newly born stars, except for the dense gas that remains in dust pillars. The next wave of star formation may occur in the molecular cloud associated with the Giant Pillar (see Figure 2) and its extended features to the south.
Looking more closely at Figures 4 and 5, one can also see significant sub-clusters of YSOs in the South Pillars on size scales of 2-6′ (1-4 pc). Many of these sub-clusters of YSOs are associated with dust pillars, either embedded within them or residing just outside the pillar heads. These YSO sub-clusters are also coincident with small clusters of point sources (including those not identified as YSOs) seen in IRAC images, several of which contain O-type stars. The spatial relationship between these small clusters and dust pillars will be discussed more in §4.5. By contast, the Western region has no large concentration of YSOs and only a few very modest overdensities of YSOs on smaller scales.
Averaged across the entire South Pillars IRAC image, the YSO density is 832 sources deg-2, with much higher values in the central concentration of YSOs noted above. In the West mosaic, by contrast, the YSO density is 500 sources deg-2 with little sign of clustering. The lowest-density region at the East edge of the South Pillars has a YSO density of 265 sources deg-2. If this is considered an upper limit to the background density of unassociated background IR excess sources, then the vast majority of YSO sources are indeed local to Carina. We would expect the true background contaminant density in IRAC images of the South Pillars and the West region to be 100 sources deg-2.
3.3 Summary of Results for Point Sources
Of the more than 40,000 sources that we detect in 4 or more filters in the merged 2MASS+IRAC point source catalog, less than 1,000 are highly reliable YSOs based on fits to the SEDs. The vast majority of sources are foreground or (more numerous) fainter background sources. Our line-of-sight to Carina looks down the tangent point in the Carina spiral arm, providing a high column density of stars for several kpc behind Carina. The known stellar population within Carina includes about 70 O-type stars and (5–8)104 total stars (Smith 2006; Smith & Brooks 2007), and the majority of these are concentrated in the first-generation 2–3 Myr old clusters (Tr 14 and 16). (Smith & Brooks derived the total number of stars by extrapolating to low masses using a Trapezium-like initial mass function [IMF] from Meunch et al. 2002.) Considering that the YSO lifetime is a few 105 yr for the stars of 2–3 that dominate our sample, one would expect of order several 103 YSOs in Carina if star formation has been constant. We detect almost 1000 YSOs, so it would appear that star formation is less vigorous now than in the past. However, the South Pillars and West region do not cover the full nebula, and our SED-based selection of YSOs is highly incomplete (see below), so perhaps the number of YSOs in our sample is roughly consistent with continuous star formation averaged over time (see §5).
An important point to emphasize is that the number of YSOs listed in our catalog is certainly an underestimate of the true YSO population. One reason for this is because of our rigorous criteria for classifying the SEDs and because of complications with extended emission. Our sample was selected for reliability rather than completeness; the SED-based selection is conservative, making us far more likely to exclude true YSOs than to include false IR excess sources. Also, bright diffuse PAH emission from pillars can cause spurious excess 8 m emission, causing us to reject sources. Furthermore, some of the more massive YSOs are in deeply embedded clusters with bright diffuse emission, and as extended objects, they were simply not included in our point source catalog to begin with. For example, IRAS 10430 is regarded as a luminous embedded cluster and was the first sign of ongoing star formation recognized in Carina (Megeath et al. 1996), but it is a bright extended source and is not in our point source catalog, so the SED fitter identified zero YSOs there. Similarly, the SED fitter recognized zero YSOs in the Treasure Chest cluster, mostly due to diffuse background emission. However, detailed study of the photometry of this cluster revealed an extremely high disk excess fraction of 67%, with over 100 disk sources, a few moderately massive stars, and an age for the cluster of 105 yr (Smith et al. 2005). Thus, embedded clusters and massive YSOs with extended structure will be systematically excluded from the YSO catalog. Because of the difficulty introduced by extended emission, many of these sources must be dealt with on a case-by-case basis in future papers. Lastly, even without problems due to extended emission, our catalog is biased against the youngest Class I and Class 0 protostars because those are very red and are only likely to be detected at the longest wavelengths, making it difficult to meet our selection criteria of detection in at least 4 out of 7 filters.
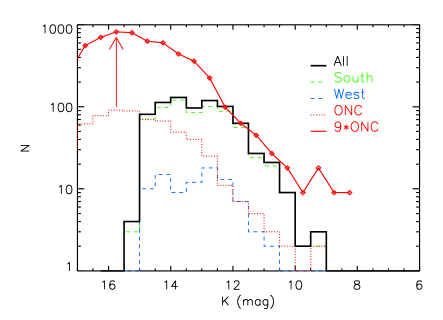
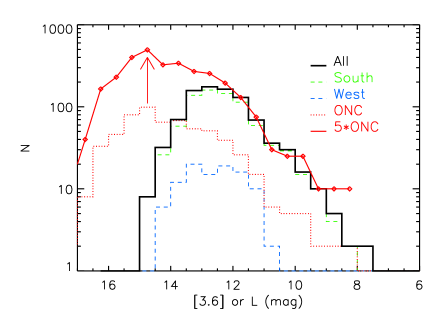
More seriously, we are also missing many faint low-mass YSOs due to sensitivity limits. Figures 7 and 8 show the -band luminosity functions (LFs) and 3.6 m LFs for the South Pillars and the West region. Both show a very steep power-law slope with turnovers at 13 mag and 12.5 mag due to completeness. This is evident when the Carina LFs are compared to scaled LFs from the Orion Nebula Cluster in Figures 7 and 8 (from Muench et al. 2002). Model SED fits suggest that we are incomplete below stellar masses of 2–3 . Correcting for the missing low-mass sources by extrapolating a scaled Trapezium-like IMF (Meunch et al. 2002; the same extrapolation used by Smith & Brooks 2007) would imply a total number of at least 5,000 YSOs in the South Pillars and West region alone, corroborating our initial expectations above. Given that this number of YSOs is roughly 10% of the total number of stars in the Carina Nebula (Smith & Brooks), and that the YSO lifetime is roughly 10% of the lifetime of the region, we find it likely that star formation may have continued at a relatively constant rate over the lifetime of the region.
Although we do not model the observed mass function directly from our data, we can glean some clues about the IMF for ongoing star formation in Carina from Figures 7 and 8. In the magnitude range where our sample is fairly complete, the slopes of the and 3.6 LFs in Carina are comparable to those in Orion, except at the brightest end where there appears to be a slight excess of sources in the scaled Orion sample. Note, however, that the top few bins in the Orion LFs are scaled from detections of only 1–2 sources each. We therefore find no compelling evidence that the IMF of sources formed recently in the South Pillars of Carina differs significantly from the IMF of the Orion Nebula Cluster. In addition, we must recall that our Carina sample is based on YSOs selected by their SEDs, whereas the Muench et al. sample refers to all stellar sources (stars with and without disks). If more massive stars shed their own disks more quickly, this may account for the slight difference between the bright ends of the Orion and Carina LFs. Recall that we find 15–20 O-type stars among the South Pillars in Carina, none of which were identified as YSOs from their SEDs. Unfortuntely, the sensitivity limits of our data do not permit us to comment on the lower end of the IMF, which is potentially the most interesting (i.e., one would like to know if the turnover mass of the IMF is skewed to higher masses in externally-heated regions like this).
The number of embedded YSOs can also be compared to the number of detected outflows in the Carina Nebula. In an H imaging survey with the Hubble Space Telescope (HST), Smith et al. (2010) detected 39 jets and jet candidates, 28 of which overlap with the south and west regions covered by the IRAC images. In the IRAC data, we find roughly 160 YSOs that are Stage 0/I or Class I, which is the YSO phase during which one expects to see ouflows. The 28/160 ratio suggests that the lifetime for the most active accretion/outflow phase during which an HH jet is detectable in a region like Carina is 10–20% of the duration of the embedded protostar phase (Stage 0/I), or a few 104 yr. This is commensurate with the observed dynamical timescale for some of the longer HH jets (Smith et al. 2010, 2004a). There are considerable uncertainties, however, because both values are underestimates. We have noted that our YSO catalog misses many YSO sources below 2 . Also, Smith et al. (2010) found evidence that HH jets with lower mass-loss rates are less easily detected and that the true number of active HH jets in Carina (correcting also for the area not surveyed by HST) may be of order 150–200.
4 Diffuse Emission
4.1 General Properties of the Extended Emission: Dust Pillars
In terms of spatially extended emission that contributes to the various IRAC filters, Band 1 (3.6 m) is dominated by diffuse emission from the 3.3 m PAH feature, Band 2 (4.5 m) includes the Br line plus CO bandhead emission and H2 lines, and Bands 3 and 4 (5.8 and 8.0 m) are dominated by strong PAH features, although a few sources show extended thermal continuum emission from warm circumstellar dust in these bands.
The most striking features in the IRAC images are the numerous dust pillars and cometary clouds scattered throughout the region, most of which harbor YSOs. Their photodissociation regions (PDRs) that mark the FUV-illuminated surfaces of molecular clouds are bright in Bands 1, 3, and 4, and so dust pillars appear magenta in typical IRAC color images (Figures 2 and 3). Similar emission from dust pillars is widely seen in IRAC images of other massive star-forming regions (e.g., Churchwell et al. 2004, 2009; Reach et al. 2004, 2009; Bowler et al. 2009).
This emission from the South Pillars in Carina gives an unprecedented view of the complex structures that arise when a clumpy molecular cloud is shredded and destroyed by stellar winds and radiation from massive stars, and acts as an excellent tracer of the overall distribution of molecular clouds in the region. The detailed structure of the many South Pillars shows corrugations and long twisted tails, most notably in the upper portions of the South Pillars close to Tr 16. The highly fragmented and filamentary structure of the tails that trail behind dense knots indicates that Rayeigh-Taylor and Kelvin-Helmholtz instabilities have efficiently disrupted their parent clouds (e.g., Spitzer 1954; Williams et al. 2001). These structures are quite reminiscent of simulations of turbulent cloud destruction by shocks (Pittard et al. 2009; Marcolini et al. 2005) or instabilities at advancing ionization fronts (Whalen & Norman 2008; Williams et al. 2001; Mizuta et al. 2006; Mackey & Lim 2009). Interestingly, the highly fragmented structures in Carina are more closely matched by simulations that do not include efficient turbulent mixing or efficient conduction, both of which tend to inhibit the heavy fragmentation (Pittard et al. 2009; Marcolini et al. 2005). These considerations are relevant to the survival times of these features, and a more detailed comparison between observations of pillars and simulations will be undertaken in a later paper.
Although the PAH emission traces the location of the cloud boundaries very well, it arises mainly from a thin skin on the surface of these clouds. Kassis et al. (2006) estimated the thickness of the layer in the Orion Bar to be of order 0.2 pc, corresponding to an unresolved thickness of 2″ in our Carina images. The intensity of the PAH emission does not necessarily trace the mass of molecular gas within the clouds because much of the molecular gas is shielded from the FUV radiation (Smith & Brooks 2007; Brooks et al. 2000; Rathborne et al. 2002). The PAH emission also traces the warm dust in the PDRs, matching maps of the 60 and 100 m emitting optical depth (Smith & Brooks 2007), suggesting that IRAS emission comes mainly from thin skins of these clouds as well, not far from the PAH emitting regions. Sufficiently high spatial resolution images at longer wavelengths are not yet available to verify the location of the far-IR-emitting dust.
The thermal continuum emission from warmer dust at 20–25 m has a different spatial distribution, located fully outside the dust pillars and more closely matching that of the ionized gas seen in radio and Br emission (Smith & Brooks 2007). Some of the green glow may also be due to hot dust intermixed with this ionized gas (Churchwell et al. 2004; Povich et al. 2008). Extended Br is seen widely throughout the region, appearing green in color images (Figures 2 and 3). Br emission arises mainly from diffuse gas in the open spaces between dust pillars, rather than the ionization fronts on their surfaces. Exceptional cases of extended Band 2 emission (green) and Band 3-4 emission (red) from individual sources are also seen, discussed below.
4.2 Extended Green Objects (EGOs) and Outflow Activity
Previous studies of star-forming regions with IRAC have revealed a population of extended objects that exhibit excess emission in the 4.5 m Band 2 filter, as compared to adjacent filters. These features appear green in the common color coding of 3.6 m (blue), 4.5 m (green), and 8.0 m (red) used to display IRAC images, and so these have been referred to as “extended green objects” (EGOs). This green emission is seen from low-mass Herbig-Haro (HH) jets when the jet burrows into a molecular cloud, as in the famous case of HH 46/47 (Noriega-Crespo et al. 2004; Velusamy et al. 2007) and numerous jets in NGC 1333 (Gutermuth et al. 2008). EGOs are also closely asociated with outflows in regions of high-mass star formation (Araya et al. 2007; Cyganowski et al. 2007; Davis et al. 2007; Hunter et al. 2006; Shepherd et al. 2007; Smith et al. 2006). The emitting species is probably either CO bandhead emission or H2 lines in the Band 2 filter, or both. Cyganowski et al. (2008) collected a large sample of EGOs seen in GLIMPSE data, and showed that they tend to be correlated with infrared dark clouds (IRDCs) and with CH3OH maser emission, and that their associated continuum sources have IRAC colors similar to the embedded accreting YSOs. Cyganowski et al. (2008) therefore suggested that most EGOs are good tracers of molecular outflows specifically from high-mass protostars.
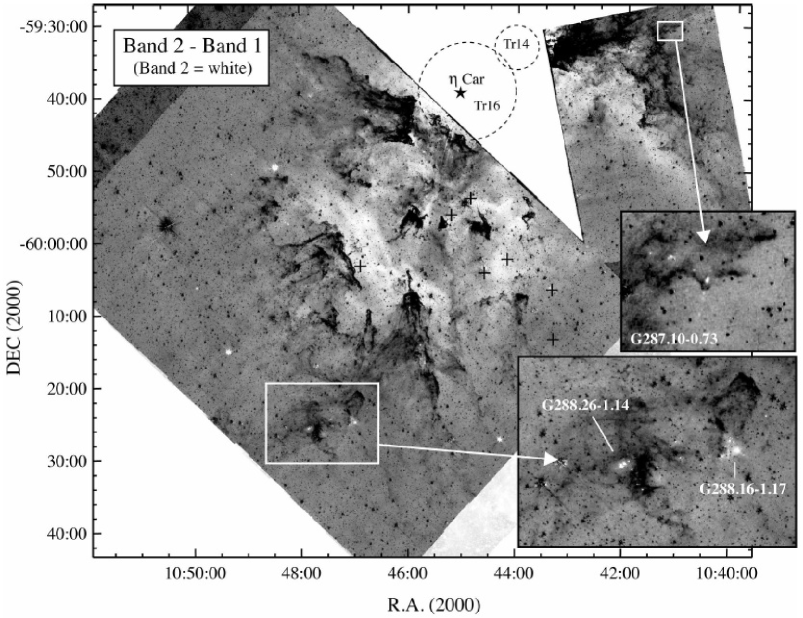
We detect few of the EGOs that are normally taken as signposts of outflow activity in Spitzer data. Figure 9 shows a subtraction image made from the difference between the Band 2 and Band 1 IRAC images. Visual inspection reveals that the 4.5 m excess emission in this map (appearing white or light gray in Figure 9) correlates well with extended features that appear green in a composite color image. Most of the diffuse green emission that one sees in a color image is in the form of large areas of diffuse emission, most likely due to Br line emission from photoionized gas in dense photoevaporative flows from the surfaces of large dust pillars, or hot dust mixed with that gas, as noted above. This appears as large white arcs draped over dark dust pillars in Figure 9, with size scales of several arcminutes. This emission is well-correlated with large-scale H and radio continuum emission, as well as warm dust seen at 20 m that is heated in situ by trapped Ly (see Smith & Brooks 2007). We detect only a few examples of the more compact diffuse sources that one would associate with outflow activity.
There is no shortage of YSO outflow activity in Carina, however. A recent H imaging survey with HST revealed 39 HH jets and HH jet candidates in Carina (Smith et al. 2010). Of the 28 HH sources from Smith et al. (2010) that reside within the boundaries of the South Pillar and western regions that we have surveyed with IRAC, zero exhibit detectable excess 4.5 m emission and so none of them appear as EGOs. This is somewhat surprising, since nearly all the HH jets in Carina are seen to emerge from dust pillars (i.e. plenty of associated molecular gas), and several of the HH jets in this sample appear to mimic the case of HH 46/47, where one side of a bipolar flow emerges into an H ii region cavity, while the other burrows into the molecular cloud. A possible explanation for this missing green emission is that — unlike the cases of HH 46/47 or the jets in NGC 1333 — the HH jets in Carina are irradiated HH jets, meaning that they are detectable primarily because the gas in the jet is photoionized as it is bathed in UV light from dozens of nearby O stars (Reipurth et al. 1998; Bally & Reipurth 2001). In that case, the molecular gas that one normally would expect to see in the coccoon surrounding an HH jet is probably dissociated by the same UV radiation that ionizes the jet body. There is also a potentially severe observational limitation: The green emission that might otherwise be seen from the portions of the jets that burrow into the dense molecular clouds may be too faint to detect amid the extremely bright PAH emission from the irradiated cloud surfaces. Most EGOs have been identified in IR dark clouds without bright PAH emission (Cyganowski et al. 2007). It therefore appears that in giant H ii regions such as Carina, where strong UV radiation fields dominate, that EGOs do not provide good tracers of the YSO outflow activity. We speculate that the same feedback-dominated conditions which lead to a shortage of EGOs may also partly explain the general lack of ultra-compact H ii (UCHII) regions in Carina (Brooks et al. 2001), since both require relatively long-lived, deeply embedded environments for massive stars. If massive stars form in the heads of pillars and are quickly uncovered by the advancng ionization front, these embedded conditions will not exist for long. WE find it quite unlikely that feedback inhibits the formation of high-mass stars altogether, since the South Pillar region contains 20 O-type stars, some of which are closely associated with YSOs and dust pillars (see §4.4).
| EGO | SB2 | IRDC? | YSO? | comment | ||
|---|---|---|---|---|---|---|
| G287.10-0.73 | 10:41:14.3 | –59:32:39 | 0.9–7.6 | no | 0 | collimated bipolar flow, optically dark pillar |
| G287.95-1.13 | 10:45:42.0 | –60:17:31 | 29 | yes | 1 | extended emission around point sources |
| G288.15-1.17 | 10:47:00.6 | –60:25:35 | 1.5 | yes | 3 | extended E of pt. source, IRAS 10451-6010 |
| G288.26-1.14 | 10:47:51.9 | –60:26:22 | 4–13 | yes | 4 | several blobs, C18O outflow (15) |
Note: is the approximate range of excess surface brightness of EGO features (MJy ster-1) in the Band 2 (4.5 m) filter, with nearby background subtracted. “IRDC?” refers to whether or not the source appers as a dark cloud at 8.0 m in the Band 4 IRAC image, and “YSO?” refers to the number of unresolved YSO sources identified by our automated fitting routine (see §3.1).
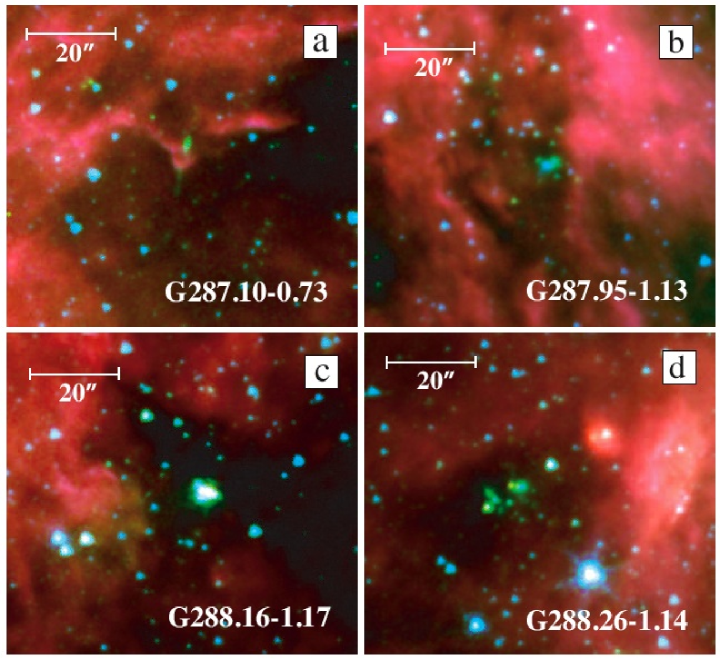
There are nevertheless a few examples of EGOs in our IRAC survey of Carina, none of which are associated with known HH jets.333EGOs seen in our IRAC survey were not targeted in the HST survey by Smith et al. (2010). We could identify no sign of outflow activity in our ground-based optical images of the region, but many of the HH jets identified in HST images also could not be seen in ground-based images. Therefore, it is possible that these outflows do in fact have associated HH objects that are undetected in ground-based wide-field images. These are shown in Figure 10 and listed in Table 2.444Many of the other compact features that appear white in Figure 9 are not true EGOs, but artifacts from subtractions of bright point sources. Point sources suffering large foreground extinction will have a relatively high 4.5/3.6 m flux ratio in Figure 9. The EGOs in Carina are found preferentially in outer parts of the nebula away from the strongest UV radiation, where their molecular outflows are presumably shielded from dissociating radiation. The four sources are described individually below.
G287.10–0.73: This object, shown in Figure 10a, has the morphology of a collimated bipolar jet oriented at P.A.350° emerging from the end of a small dust pillar. The pillar is not an IRDC, but rather, has bright PAH emission on its surface (Band 4) like most dust pillars. In H emission, the pillar is seen clearly in silhouette against the brighter nebular background to the south, so it is not a highly obscured background object. The collimated jet body is seen as thin green emission extending 5-10 (0.05–0.1 pc) north and south from the pillar head in color IRAC images, with the northern flow 7–8 times brighter in Band 2 emission. The peak background-subtracted surface brightness of the jet in Band 2 is 7.6 MJy ster-1 at Spitzer’s spatial resolution, comparable to EGOs in GLIMPSE data (Cyganowski et al. 2008). The jet emission is not seen at visual wavelengths (i.e. in H or [S ii] images), although HST images of this position are not currently available; nevertheless, the lack of bright H in ground-based images (not shown) suggests that this is not Br emission in the IRAC Band 2 images, but rather, molecular emission from the outflow. Presumably, the northern flow is brighter in Band 2 because in that direction the jet burrows into the dust pillar, creating a coccoon of molecular emission akin to that seen in HH 46/47 (Noriega-Crespo et al. 2004).
G287.95–1.13: This EGO, shown in Figure 10b, is found amid a deeply embedded star cluster on the west side of a giant dust pillar that harbors the most massive molecular cloud in the South Pillars (Yonekura et al. 2005). It appears to be within an IRDC. Some of the stars in this cluster suffer high extinction and appear somewhat green (e.g., Indebetouw et al. 2005), whereas others are blue in Figure 10b, which may imply that the dark cloud runs through the cluster. Although the central object here appears as extended green emission associated with one YSO identified by our SED fitter (see §3.1), this may be a dense cluster of highly embedded sources that is unresolved at the angular resolution of Spitzer. Ground-based 2-4 m images with higher spatial resolution could determine if this is truly an EGO or unresolved stars. If the green emission in Figure 10b is extended molecular emission in Band 2, it has a rather high peak surface brightness of 20 MJy ster-1.
G288.16–1.17: This EGO consists of extended green emission within a few arcsec around a bright point source, shown in Figure 10c. Careful inspection of the images, as well as PSF subtraction, reveal that the Band 2 emission around the source is definitely more spatially extended than in the other filters, mostly to the east, and is not simply the PSF wings from a bright source. The source is found within a very opaque IRDC that blocks most of the surrounding Band 4 emission, and contains 3 YSOs identified by our SED fitter. The G288.16–1.17 EGO is coincident with IRAS 10451–6010, which is a bright 25–60 m source in deconvolved IRAS data, and it resides at the western edge of the C18O core number 15 in the sample of Yonekura et al. (2005), although it is not coincident with the outflow in that source.
G288.26–1.14: This EGO is a complex overlap of several extended emission condensations within a 15″ area, shown in Figure 10d. The green condensations have background-subtracted peak surface brightness values of 10–13 MJy ster-1. The most interesting aspect of this EGO is that it is coincident with the bipolar molecular outflow seen in C18O and H13CO+ emission (Yonekura et al. 2005), within the 2000 C18O core number 15 that was identified as a region of massive star formation. The EGO is apparently found in an IRDC, and no IRAS source is listed for this position, although there is bright PAH and 25 m continuum 30″ to the west, at the left side of Figure 10d. Our SED fitter identified 4 (+1 uncertain) YSOs in the central few arcsec amid the EGO emission, indicating that this is a region of active ongoing star formation. The coincidence with the CO outflow identified by Yonekura et al. (2005) gives high confidence that this EGO is indeed associated with an outflow from ongoing massive star formation.
Finally, there were several sources that were revealed to have extended excess 4.5/3.6 m emission in Figure 9, but which were not true EGOs because they had increasing extended excess emission in Bands 3 and 4 as well. Examples are the ring nebula around SBW1 (see Smith et al. 2007), which is a SN 1987A-like ring nebula surrounding a B supergiant, as well as arcs or bow-shock structures around HD 305536 and HD 93222, which have late-O spectral types. In these cases, the extended Band 2 emission is likely to be a combination of circumstellar Br emission and thermal dust emission warmed by direct radiation from the massive stars. These sources are discussed next.
| ERO | SB4 | star | Sp. Type | SED Type | AV | PII | comment | ||
|---|---|---|---|---|---|---|---|---|---|
| S1 | 10:43:09.3 | –60:17:22 | 12.5 | ? | ? | B5.5 V | 2 | … | no SIMBAD object within 40″ |
| S2 | 10:43:17.9 | –60:08:03 | 26 | HD 93027 | O9.5 V | O8.5 V | 1.4 | 1.8 | Cr 228 |
| S3 | 10:43:20.3 | –60:13:01 | 17.6 | ? | ? | B2 V | 1.2 | … | 2MASS J10432028-6013014 |
| S4 | 10:44:11.1 | –60:03:21 | 183 | HD 305536 | O9 V | O8 V | 2 | 4.8 | sp./ binary, Cr 228 |
| S5 | 10:44:36.3 | –60:05:30 | 290 | HD 93222 | O7 III((f)) | O7 III | 2.3 | 8.6 | Cr 228 |
| S6 | 10:44:50.5 | –59:55:45 | 304 | CPD -59 2605 | B | YSO | 0.4 | … | Cr 228 |
| S7 | 10:45:13.5 | –59:57:53 | 229 | HD 305533 | B0.5 V | B0.5 V | 2.7 | … | Cr 228 |
| S8 | 10:46:53.8 | –60:04:41 | 52 | HD 93576 | O9 IV | O8 V | 2.5 | … | sp. binary, Bo 11-9 |
| (S9) | 10:44:05.1 | –59:33:41 | … | (in Tr 14) | B | … | … | … | Ascenso et al. |
Note: is the approximate representative surface brightness of ERO features (MJy ster-1) in the Band 4 (8.0 m) filter, with nearby background subtracted, and “star” is the name of the central star if known. “Sp. Type” is the observed spctral type, whereas “SED Type” is the stellar classification returned by the SED fitter; AV is the corresponding visual magnitude from the SED fit. PII is the ambient pressure in the H ii region in 10-9 dynes cm-2 (see text).
4.3 Extended Red Objects: Dusty Shocks
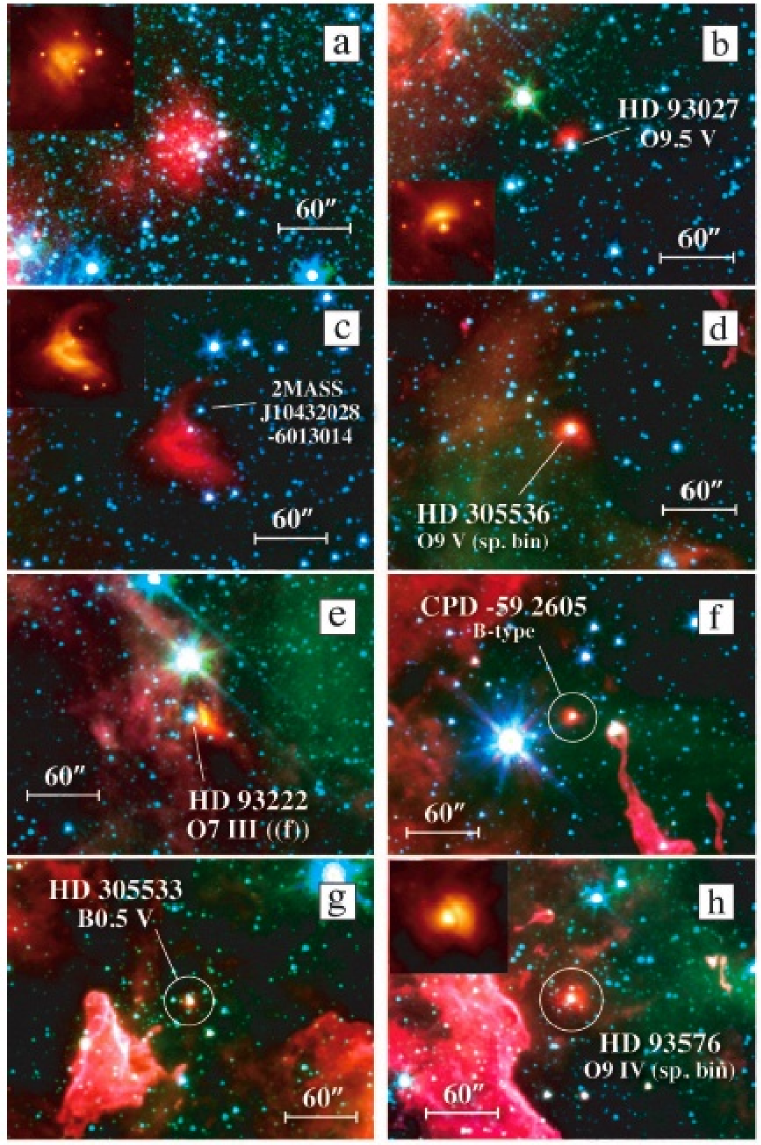
Distinct from EGOs, there is also a clear population of extended red objects (ERO) that appear very red in the same 3-color IRAC images. The deep red or reddish-orange color of these objects (indicating increasing excess in Bands 2, 3, and 4) is distinct from the magenta color that arises from the more widely seen PDR emission at the surfaces of all molecular clouds in these same images, which have bright PAH emission features contributing to the flux in Bands 1 and 4 (PAH features at 3.3, 7.7, and 8.6 m). Figure 11 shows a sample of eight EROs identified in IRAC images, also listed in Table 3. (These are the clearest cases; there are other candidates which are more dubious examples because of spatial resolution criteria rather than color criteria.) Inspection of the Band 4 images clarifies that these are not simply the result of a broader PSF at 8.0 m, because the objects are clearly spatially extended far beyond the PSF shape. The objects extend 10″ to 40″ from a bright central star seen at shorter wavelengths, and they are often one-sided and shaped like bow-shocks, usually pointing to the interior of the H ii region.555Since the arcs point to the interior of the H ii region, we consider it unlikely that these are bow shocks around runaway stars. In that case all sources would need to have been ejected from the periphery of the region and would be converging on the center.
For the two objects in Panels (a) and (c) of Figure 11, the central star is relatively faint and not identified or the spectral type is unknown. These two do, however, show morphology that is suggestive of curved stand-off shocks, especially in the 8.0 m images in the insets of these panels. Fits to their SEDs suggest stellar types of B5.5 V and B2 V.
It is quite interesting that all other objects in Figure 11 (Panels b, d, e, f, g, and h) show a consistent trend that the ERO nebulosity surrounds a moderately massive, bright star known to be an early B-type or late O-type star in the Cr 228 or Bo 11 clusters (see the list in Smith 2006, and references therein). Four of the six are O-type stars, and two of those have especially strong winds with spectral types of O7 III((f)) and O9 IV. The stellar types inferred from SED fits agree remarkably well with the observed spectral types for these stars (Table 3), adding reliability to the B types inferred from the SEDs of S1 and S3, as noted above.666Note, however, that the SED fitter identified the B star CPD -59 2605 as a YSO with low interstellar reddening, rather than a B star with reddening comparable to the other sources. This is undoubtedly an important clue to the physical origin of these shock structures, and suggests that they are similar to the bow shocks around O stars seen in IRAC images of M17 and RCW 49 (Povich et al. 2008). The fact that these stars can have substantial stellar winds has obvious bearing on the clear bow-shock morphology seen in several of the EROs in Figure 11. The EROs S2 and S4 around HD 93027 and HD 305536 (both late O-type stars) are very clear one-sided bow shocks with their apex pointing up toward Tr 16. The EROs S6–S8 around CPD -59 2605 and HD 305533 (both early B-type) and the O9 IV star HD 93576 (located within the cluster Bo 11; Fitzgerald & Mehta 1987) are less extended, more fuzzy, and only somewhat asymmetric. These could be bow shocks viewed at a low inclination (i.e. face-on). The ERO S5 around the O7 III((f)) star HD 93222 is more complex and extended, with a bright filament extending to the south-west, but with a series of curved filaments in other directions as well, forming an apparent fragmented shell around the star. This star is noteworthy because it has some of the highest velocities observed in interstellar absorption lines among the O-type stars in Carina (Walborn et al. 2002b, 2007; and references therein), and we conjecture that these absorption features probably arise in the dense post-shock gas associated with the ERO emission.
We suggest that most of these features arise from dusty shock fronts that occur at the stand-off shock between the fast outflowing stellar wind of the central star and the large-scale flow of plasma in the surrounding H ii region. The bulk flow of ambient plasma is the result of photo-evaporative flows from the surfaces of nearby molecular clouds, ablated and accelerated outward by feedback from massive stars in Carina. (S1, however, may be slightly different; perhaps a B star embedded in the PDR, since the SED of its diffuse red emission is different from the other sources.) Such flows are known to be present based on other tracers such as the many bent Herbig-Haro (HH) jets and LL Ori objects that serve as “wind-socks” in the region (Smith et al. 2010), as well as pervasive diffuse X-ray emission (Townsley et al. 2006).
The origin of the dust in these ERO shocks is uncertain, since the fast and hot winds of O and early B stars are not efficient dust producers. The dust may simply pile-up at the dense shock front after having been entrained by the photoevaporative flow off the surface of a nearby molecular cloud. Alternatively (but perhaps less likely because of the very high required densities), the dust may actually form in the post-shock cooling zone as is seen in some colliding-wind binaries (e.g., Williams et al. 1990; Usov 1991; Crowther 2003; Smith 2009) and supernovae (Smith et al. 2008). To be bright in IRAC Band 4, the dust must be heated to roughly 200–300 K. The dust could be heated by direct stellar radiation from the OB stars, it could be due to trapped Ly heating if it is mixed with dense ionized gas, or the dust may be heated by collisions in the hot post-shock gas.777Everett & Churchwell (2010) infer very efficient dust cooling under similar conditions, making it difficult to maintain such high dust temperatures from radiation alone. This may argue for a contribution of shock heating in these sources. EROs do appear to be mixed with dense ionized gas, since 6 of the 8 sources are projected amid locations with bright diffuse Br emission (see Figure 10). It would be interesting to investigate possible correlations with diffuse X-ray emission in future studies.
Two of the objects (HD 305536 and HD 93576) are known spectroscopic binaries. Although WC+O binaries are famously known to produce dust in their colliding-wind shocks, these sources are not WC binaries. Furthermore, it does not seem likely that binarity is an important or necessary condition for the circumstellar dust in an ERO, since other objects in Table 3 are not known to be binaries. The two close binaries out of six early OB stars are consistent with a random sample.
Given the large number of O and early B-type stars in Carina (see Smith 2006), it might seem surprising that only six clear examples of such dusty wind collision shocks are detected in the region we surveyed with IRAC.888The IRAC images do show many examples of bow-shaped structures around bright point sources, but many of these are consistent with limb-brightened PAH emission from the heads of dust pillars that contain a YSO, where the Band 4 emission (along with emission in Bands 1 and 3) arises in a PDR at the head of the pillar. These sources are not believed to be dusty wind collision shocks. For example, there are no such structures surrounding HD 92740 or HD 93131 (e.g., Crowther et al. 1995), which are extreme WNH stars (Smith & Conti 2008) with powerful stellar winds that are located within the region we surveyed with IRAC. Thus, these EROs in Figure 11 may arise from a combination of special conditions: The central O-type or early B-type star with a strong wind must be located in the outer periphery of the nebula near the surfaces of molecular clouds, whereas many OB stars reside in the central clusters Tr 14 and Tr 16 where much of the cooler gas has already been cleared away; relatively few reside in the South Pillars. Also, the star must not be so luminous that it vaporizes the circumstellar dust, and its wind must not be so strong that all material is cleared away beyond distances where it can be heated. Perhaps these reasons favor relatively late O-type stars rather than the most massive WNH stars or early O-type stars. In addition, the star must be embedded within a particularly dense photoevaporative flow.
It is obvious from inspection of the images that local density enhancements are strong in the gas surrounding the South Pillars, and several of the EROs do seem to be embedded in dense ionized gas as noted above. In the three cases where a bow shock or arc is separated from the star and spatially resolved, and where the star’s spectral type is known (i.e., EROs S2, S4, and S5) we can use the stellar wind parameters and observed bow shock properties to infer the pressure in the local ISM. The pressure of the photoevaporative H ii region flow, balanced with the stellar wind, is given by
| (5) |
where and are the mass-loss rate and speed of the stellar wind, and is the observed stand-off radius of the bow shock. Taking and values for HD 93027, HD 305536, and HD 93222 from the tables in Smith (2006; these values account for wind clumping), and observed radii of the shocks from the star, we list corresponding values for for these three sources in Table 3. For , we took the difference in radius between the star and the peak of the Band 3 and Band 4 emission. This is probably the largest source of uncertainty (roughly 30% in ), as the relative position of the shock front and the dust is unclear. In any case, the pressures derived for the ambient medium are of order a few 10-9 dynes cm-2, which is commensurate with the pressure inferred from ionization fronts in the H ii region by Smith et al. (2004b).
One might expect that the EROs in Figure 11 are the most extreme cases, and that there could be many more examples of such stand-off shocks that are fainter or closer to their stars. HST images of Carina reveal several very small (0.05 pc) bow-shock structures surrounding fainter stars that are embedded within dense photoevaporative flows from dust pillars (Smith et al. 2010).
In Table 3 we list one additional object that is also a likely member of the class (S9), but which was not included in the field of view of our IRAC images. Ascenso et al. (2007) discussed a bow-shaped structure around a B-type star in the Tr 14 cluster in near-IR images, and they noted that the apex of the bow points toward the massive O2 star HD 93129A. Ascenso et al. (2007) considered it likely that this was a compact H ii region associated with this star. However, its size of 10″ is comparable to the other IR shocks in Table 3, and it is seen in IR continuum images but is not detected in H images obtained with HST (Smith et al. 2010). This argues that it may be a dusty bow shock like the other objects in Table 3, and its early-type star is consistent with other members of the group.
| Cl. | O stars | YSOs | comment | ||
|---|---|---|---|---|---|
| A | 10:43:41 | –60:03:50 | 6 | 11 | Cr 228, WNH, ERO-S2, S4 |
| B | 10:44:22 | –59:57:50 | 1 | 24 | Cr 228 |
| C | 10:44:33 | –60:03:30 | 1 | 8 | ERO-S5 |
| D | 10:44:41 | –59:53:50 | 2 | 10 | ERO-S6 |
| E | 10:45:09 | –60:01:00 | 0 | 16 | … |
| F | 10:45:12 | –59:56:40 | 0 | 30 | … |
| G | 10:45:33 | –59:47:00 | 1 | 30 | Tr 16-SE, X-ray cluster |
| H | 10:45:36 | –60:11:30 | 0 | 14 | … |
| I | 10:45:42 | –60:15:20 | 0 | 17 | EGO 287.95-1.13 |
| J | 10:45:45 | –59:58:50 | 0 | 8 | … |
| K | 10:45:48 | –60:06:00 | 0 | 35 | HH 903 |
| K-SE | 10:45:55 | –60:08:00 | 0 | 6 | embedded |
| L | 10:45:54 | –59:56:50 | 1 | (104) | embedded, Treasure Chest |
| M | 10:46:12 | –59:57:10 | 0 | 7 | … |
| N | 10:47:05 | –60:03:50 | 5 | 23 | Bochum 11 |
| O | 10:47:41 | –60:26:00 | 0 | 11 | embedded, EGO 288.26-1.14 |
4.4 Orientations of Dust Pillars and Massive Stars
UV radiation drives the ionization fronts that evaporate clouds, and strong stellar winds can ablate those photoevaporative flows or destroy clouds directly by shocks. While the hydrodynamics of this interaction can be complex (Pittard et al. 2009; Klein et al. 1994; Whalen & Norman 2008), one generally expects dust pillars and the heads of cometary clouds to point toward the OB stars that have shaped them. These structures therefore identify the most influential massive stars, locally or globally (see Smith & Brooks 2007).
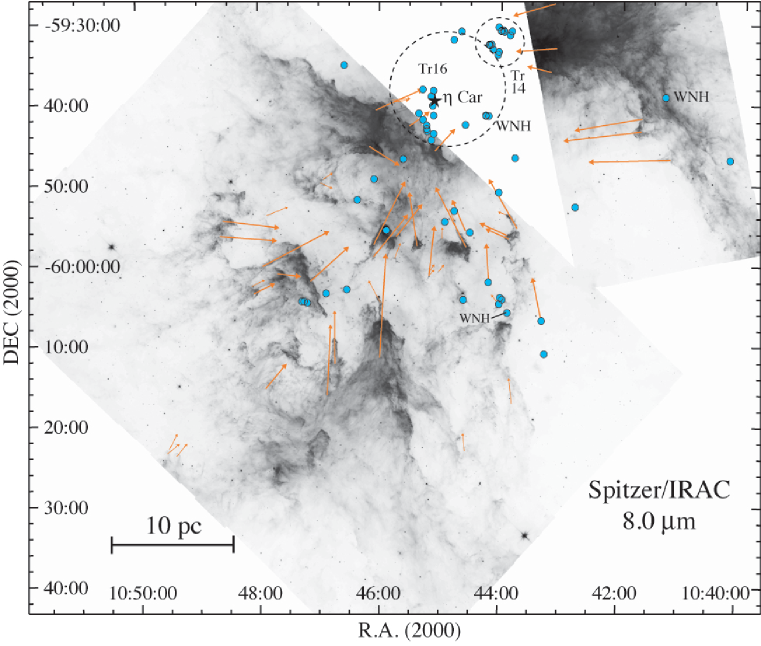
Figure 12 shows the 8.0 m Band 4 IRAC image of the South Pillars and western region in Carina. The structures in this image are dominated by PAH emission from the surfaces of the molecular gas in dust pillars and cometary clouds. Superposed on this image, we also draw arrows (orange) for well-defined elongation axes of dust pillars, and we plot the locations of known O-type stars in Carina with filled blue circles (see the list in Smith 2006). The O-type stars in the South Pillars region are dominated by members of the Cr 228 and Bo-11 clusters, but the O star population is spatially dispersed.
Although the global ionizing flux and stellar wind momentum flux is dominated by the stars in Tr 14 and Tr 16 (Smith 2006), it is clear from Figure 12 that not all pillars point exactly toward Car and its immediate neighborhood of Tr 16. While instabilities inherent to the cloud destruction process can cause some irregular structure, this cannot explain all the observed deviations. In some cases pairs of adjacent pillars which are still in-tact point in the same direction, and that direction is more than 30° from the core of the nebula. Figure 12 shows that there are 20 O-type stars scattered amid the South Pillars. These tend to be less extreme, late O-type (as well as several early B-type stars; not shown), and some of these appear to have sculpted their local environs more than the more massive O-type stars in the central clusters Tr 14 and 16. In some cases, Tr 14 and 16 are evidently too far away to compete with the local influence of the less massive O stars that are nearby.
It is interesting that the two WNH stars located far outside Tr 16 (HD 92740 far to the west and HD 93131 in Cr 228 to the south) do not appear to have had much influence on the shaping of dust pillars in their vicinity. There are no pillars that clearly point to them. Since these stars have some of the strongest winds and highest luminosities of any massive stars in Carina, their lack of influence suggests that they may be projected in the foreground or background compared to the surrounding molecular gas, or that they have only recently arrived in their present locations. Walborn (1995) notes that they could have drifted to their current locations from the core of Tr 16 in 3 Myr if they are moving at only 10 km s-1.
Close inspection of the sub-structure in several of the South Pillars reveals an interesting phenomenon. Some pillars or pillar complexes will follow an elongation axis at large scales, but on smaller scales one can find protrusions or cometary clouds that point in an altogether different direction. Some of these are marked in Figure 12 with smaller and thinner arrows. Examples are the pillars associated with the jets HH 666, HH 903, and the cluster of HH jet candidates HHc-4 to 8 (located within cluster “F” in Figure 13; see Smith et al. 2010); in general these point toward Carinae, but they also show smaller features pointing off-axis by more than 30°. This would imply the rather strange set of circumstances that the smaller sub-structure is shaped by a different UV or wind source than the larger pillar structure that it is a part of.
The dominant source of UV radiation or winds that shaped a given pillar may have changed during the lifetime of the pillar in order to cause this. This could have happened for a variety of reasons:
1. A new O-type star may have appeared in the immediate vicinity of the pillar. This may occur because the O star was just recently formed or just recently emerged from its natal cloud, so that its UV radiation and winds have just turned on.
2. It may have appeared in the vicinity because it formed elsewhere and drifted away from its birth site.
3. While Carinae was on the main sequence, it probably dominated the UV luminosity and winds in the region (Smith 2006). Late O-type stars or early B-type stars are distributed throughtout the region, and these had relativly little influence compared to Car. However, on local scales they became more influential when Car entered its post-main-sequence luminous blue variable (LBV) phase and its ionizing UV radiation effectively shut off (this occured because the star became cooler and because its present-day stellar wind is so dense that it absorbs all of the star’s ionizing radiation; the dusty Homunculus Nebula ejected in 1843 absorbs all remaining FUV radiation). The drop in UV flux at the onset of Car’s post-main sequence phase alone probably caused the total ionizing UV radiation from Carina to drop by 25% (Smith 2006).
Though the last mechanism is known to have occurred, it is difficult to rule out the first two options for any particular source. In any case, the observed structures illustrate that the South Pillars are in a dynamic environment, and both scenarios would require rather long lifetimes of 1 Myr for the pillars. The pillar lifetimes of 1 Myr agree with the approximate ages of the Stage II sources left in their wakes.
4.5 Star Clusters and Dust Pillars
Since dust pillars are thought to be prime sites for ongoing or triggered star formation, we investigate the relative spatial distribution of dust pillars as compared to YSOs and young star clusters or groups. Figure 13 compares the Band-4 (8.0 m) IRAC image of the South Pillars and West region, dominated by PAH emission on the surfaces of dust pillars, to the locations of O-type stars (blue dots) and overdensities of stars. The dashed circles in Figure 13 identify the locations of small clusters or groups of stars seen in the Band-1 (3.6 m) IRAC image, in which the point source emission is dominated by stellar photospheres. The identification procedure for these clusters is subjective, so we have only considered clear cases where there is a high over-density of stars compared to the surrounding field. The coordinates of these clusters (corresponding to the centers of the dashed circles, labeled A, B, C…) are listed in Table 4, along with their numbers of O stars and YSOs, cross identifications, and other information. There are several smaller overdensities of stars and YSOs as well, which were not as clear as those listed in Table 4. For example, there is a small cluster of YSOs at the head of the dust pillar from which the jets HH 1004 and 1005 emerge (Smith et al. 2010), located to the east of the giant pillar, but it does not show a clear overdensity of point sources in the 3.6 m image.
YSOs are not identified explicitly in Figure 13, but they can be seen in Figures 4 and 5, and compared to the locations of clusters A–O. This is discussed further below. In Figure 13 we show a large solid ellipse noting the approximate region with the highest concentration of YSOs (see Figure 4), most of which are Stage-II/Class-II. Several qualitative conclusions can be surmized from Figure 13:
1. Several of the sub-clusters in Figure 13 seem to be associated with both O-type stars and local concentrations of YSOs, but there is a range of degree to this association. For example, cluster A (part of Cr 228) has 6 O-type stars (including one WNH) and 11 YSOs, cluster N (Bochum 11) has 5 O-type stars and 23 YSOs, while clusters F and K have 30 or more YSOs and zero O-type stars. These differences point to different ages or different IMF slopes from one cluster to the next, although when the full population of the South Pillars is averaged together, we do not find compelling evidence for an altered IMF (see §3.3). This implies that small IMF differences may be statistical fluctuations that are washed out in a larger sample.
The relationship between clusters, YSOs, and O-type stars in the South Pillars has important implications for the region. Most of the O-type stars in and around Cr 228 are usually assumed to be part of the same cluster as Tr 16, just divided at visual wavelengths by a dark obscuring dust lane, and that they therefore have the same age of 3 Myr (e.g., Walborn 1995, 2009; Smith 2006). This would make Tr 16 much longer in the N-S direction than in the E-W direction. If, instead, the O stars in the South Pillars are associated with several individual sub-clusters that are 10–20 pc from Tr 16, it suggests that they were born in these sub-clusters along with the associated YSOs and that they are therefore younger than Tr 16. It also has potential implications for the IMF in regions of second-generation triggered star formation like the South Pillars, so detailed studies of the stellar content, photometric properties, kinematics, and other properties of these South Pillar clusters in Figure 13 may be quite fruitful. If the WNH star HD 93131 was formed more recently in the South Pillars, it has important implications for the nature of WNH stars and the evolution of the most massive stars (see Smith & Conti 2008).
2. While several pillars have one YSO, a few YSOs, or a small cluster at the head of the pillar (many of which appear to drive HH jets; Smith et al. 2010), it is also true that most of the star clusters in Figure 13 – as well as the sub-clusters of YSOs associated with them — are spatially offset from the heads of pillars by 1-5 pc. The clusters seem to lag behind the pillars in an outwardly propagating sense, so that “behind” means closer to the center of the H ii region. Striking examples are clusters A, D, F, G, K, and N (cluster G appears tobe associated with a small pillar to its east in Figs. 13 and 14). Both K and N seem to still be partially embedded, and these are far from Tr 16 and associated with the largest pillars or cloud fragments. One would therefore expect them to be younger than clusters A, D, F, and G, implying a north-to-south age gradient.
The main implication of this offset is that the pillars are transient structures associated with the destruction of a cloud by feedback from massive stars, and that the resulting star clusters are left behind in their wake. It is interesting to compare the structure of PAH emission observed in some of the pillars to simulations of radiative and shock destruction of clouds (e.g., Pittard et al. 2009; Marcolini et al. 2005; Mizuta et al. 2006). In those simulations, by the time the pillar achieves the highly fragmented and filamentary structure comparable to the observed structures for many pillars in Carina, the head of the pillar has been pushed backward or evaporated. As such, the current position of the pillar head is offset from the initial cloud position by an amount commensurate with the observed offset between star clusters and pillars in Carina (compared to the relative size of the pillar). The expected cloud destruction time of several 105 yr is comparable to the ages of the Stage II YSOs in the young custers. This offset between the young clusters and stars has important implications for the question of triggered star formation, and the relative kinematics of the stars and gas are paramount (see §5).
3. As we noted in §3.2, most of the YSOs are concentrated in a large grouping that fills the interior cavity encircled by the PAH emission from the South Pillars. Following the previous point about sub-clusters residing in the wakes of pillars, this large association of YSOs in the South Pillars appears to have been built up over time, as a hierarchical group contributed by many pillars and sub-clusters rather than one monolithic cluster from a single cloud core. The end product of this is a large loose association of 20 O-type stars and many lower-mass stars, although the star formation here is by no means complete yet.
4. A corallary of the previous point is that there are also several dust pillars that appear to harbor no YSOs or clusters at their tip. This is especially true in the West region, where no clusters or tight groupings of YSOs could be identified. One of the western pillars that does have a clear YSO at its head is the likely driving source of the HH 1010 jet (Smith et al. 2010; see Figure 3). Overall, the spatial distribution of stars and YSOs in the West region is more diffuse than in the South Pillars, and less correlated with the PAH emission from pillars. This implies that, again, the YSOs are left behind in the wake of a continuously propagating wave of star formation, but which is less active and less fragmented than in the South Pillars.
4.6 An Obscured Massive Star Cluster Near Tr 16
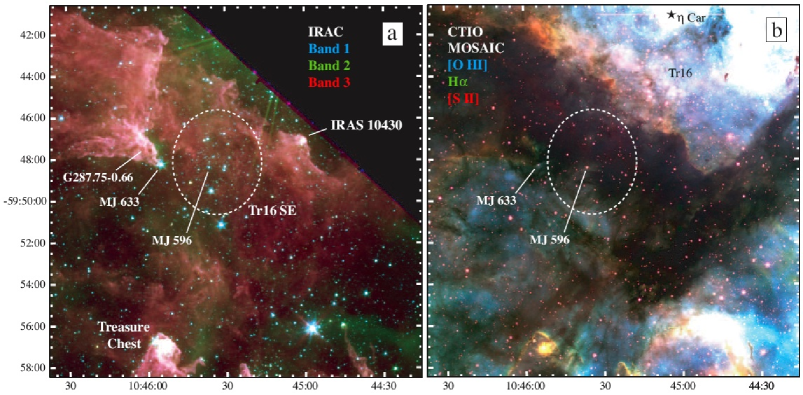
The Spitzer/IRAC images of Carina have revealed several small clusters or subclusters in the South Pillars, discussed in the previous section. One of these — cluster G in Figure 13 and Table 4 — deserves more detailed attention, because it contains an interesting collection of massive stars near Tr 16, but it is hidden behind the dark V-shaped obscuring dust lane that bisects the Carina Nebula, and so it has not been recognized until recently. Figure 14 shows Spitzer/IRAC and visual-wavelength images of the same field, centered on this cluster (the optical narrow-band images were obtained with the MOSAIC camera on the CTIO 4m telescope; Smith et al. 2003).
Sanchawala et al. (2007) first drew attention to some of these objects, noting a compact group of ten X-ray sources that had near-IR -band counterparts, which they referred to as Tr 16-SE because of their proximity to Tr 16. They noted that two of these X-ray sources were new OB star candidates, while one that was relatively less obscured was a known O4-type star (MJ 596 or IRS-43; Smith 1987; see Fig. 14). Aside from this star, the remaining members were invisible at optical wavelengths. Sanchawala et al. (2007) suggested that this group of X-ray sources may represent a deeply embedded group of very young stars, and that by virtue of their location in a dark cloud at the edge of an H ii region, this group may have formed recently via the collect-and-collapse mode of triggered star formation.
Our new Spitzer images reveal a somewhat different picture for this group of stars. The distribution of PAH emission in IRAC images suggests that the cluster resides in a local cavity that has already been cleared around it. A bright edge-on PDR is seen to the east, including a sharp dust pillar (G287.75-0.66) that points to one member of the cluster, but the diffuse emission ends abruptly before reaching Tr 16-SE (G). The stars show no enhancement of collective diffuse emission between them as seen in other embedded clusters in the region like the Treasure Chest or IRAS 10430 (see Fig. 14). Thus, IRAC images suggest that rather than being deeply embedded inside the dark cloud, Tr 16-SE is simply projected behind the foreground obscuring cloud at visual wavelengths. It appears to reside within an extension of the same cavity cleared by Tr 16. While this alters the characterization of Tr 16-SE as an embedded cluster whose formation may have been triggered recently by the interaction between Tr 16 and the dark cloud seen today, it may nevertheless be a fairly young cluster that formed sometime after Tr 16. There are 30 objects classified as YSOs in this cluster (Fig. 4). However, they are all classified as either ambiguous (cyan) or stage II (yellow) in Figure 5, which implies evolution beyond the deeply embedded phase. It suggests a more mature group of stars with an age of 1 Myr, rather than an extremely young cluster with an age of 105 yr as is seen in the Treasure Chest (Smith et al. 2005).
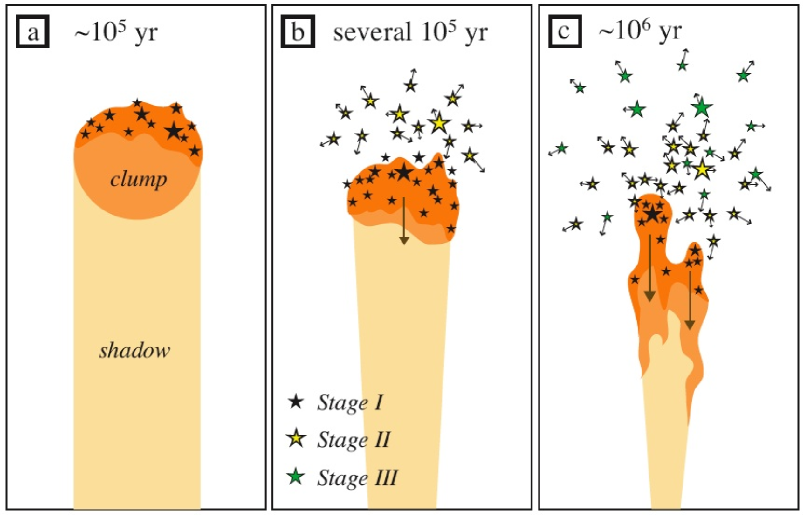
The earliest type star known in the region is MJ-596 (or IRS-43), which has a spectral type of O4 V (Smith 1967), and which Kukarkin et al. (1981) note is a possible eclipsing binary with a somewhat different spectral type O5.5 V. However, several other stars in the group, while very faint or undetected at visual wavelengths, are brighter than MJ 596 in IRAC images with colors of mildly reddened stellar photospheres. Sanchawala et al. (2007) also noted possible OB candidates based on X-ray emission and IR colors. Thus, Tr 16-SE may be a fairly substantial sub-cluster of OB stars that has not yet been recognized. It would be interesting to perform a more detailed analysis of the age and stellar content of this group, and to obtain near-IR spectra of all bright members for spectral typing (e.g., Hanson et al. 1996).
5 The Steady March of Propagating Star Formation and the Buildup of an OB Association
Together, the Spitzer/IRAC results for Carina suggest an interesting scenario where feedback from a first generation of massive OB stars drives an outwardly propagating wave of star formation, which simultaneously destroys the initial molecular cloud and continually forms new generations of stars. Our results suggest that this may be a steady and ongoing process, rather than a simple 2-stage process. As an initially clumpy cloud is sculpted into a series of dust pillars, feedback also accelerates those dust pillars outward. As such, the wave of star formation propagating out through the pillars leaves behind a wake of newly formed stars in the void between the first generation OB stars and the pillars.
Figure 15 is a cartoon depicting the process of triggered star formation within dust pillars. In the first stage represented here (Figure 15a), feedback from a first generation of massive stars (located off the top of the page) interacts with a clump in a molecular cloud. Regions of lower density outside the clump are ionized and swept back, leaving a clump with an ionization shadow below it (e.g., Williams et al. 2001). The ionization/shock front impinging on the cloud compresses its surface, and some regions in this compressed gas are unstable to self gravity and collapse to form new stars. These are the relatively rare (i.e. short-lived) Class 0/Class I YSOs that are embedded in dust pillars and are seen to drive HH jet outflows from the heads of pillars and cometary clouds in Carina (Smith et al. 2010). In optical images, the structure at this stage will likely resemble a large dark pillar such as the Giant Pillar in Carina (see Figure 2) or other features that still appear connected to their parent molecular clouds.
Figure 15b depicts a more advanced stage, when the pillar has been eroded and accelerated outward, and is now forming another generation of YSOs. The stars that formed in Figure 15a are now Stage II YSOs (yellow), and are beginning to disperse due to their own random motions (represented by small arrows in the cartoon) after gas removal. This stage may be representative of moderate-sized pillars in Carina with active star formation, such as the one that harbors the Treasure Chest cluster (Smith et al. 2005).
Finally, Figure 15c shows an even more advanced stage of the process. The pillar is now a more filamentary and fragmented remnant of the original clump that has been largely destroyed by instabilities (e.g., Pittard et al. 2009). Previous generations formed in Figures 15a (green stars) and b (yellow stars) are now dispersing further, spreading out in the wake of the accelerated dust pillar. Figure 15c portrays the interesting consequence that previous generations of YSOs formed in the pillar do not remain in the pillar and can be mixed with one another due to their own velocity dispersions after gas removal, over an area considerably larger than the observed size of the pillar head. This makes it difficult to pick out a coherent sub-cluster at a specific age or to make a conclusive association with that pillar. The degree to which newly born stars inherit the bulk velocity of accelerated gas out of which they form is an interesting goal for future work comparing numerical simulations to observations of stellar and gas kinematics. For example, we might expect successive generations to have slightly different stellar kinematics, depending on the speed of the accelerated gas. Figure 15 is of course idealized, with just a single pillar, starting at a given time in Figure 15a with no previous star formation aside from the massive stars that drive the feedback; the true picture is likely to be complicated.
Now suppose that there is an ensemble of these pillars, each of which may have originated at a different distance from the source of feedback (and hence is at a different stage of evolution) and with a different initial mass of the clump. One can imagine that coherent sub-clusters of stars could be rather difficult to attribute to any individual pillar, due to confusion caused by the dispersal of the YSOs left behind by the outwardly advancing pillar. Furthermore, an ensemble of pillars can have a range of orientations projected on the sky with some pillars behind others or overlapping, so the spatial arrangement of stars and pillars can get quite complicated. Nevertheless, we do observe the general trend that the large association of YSOs is generally outlined by dust pillars, and we do see some examples of sub-clusters of YSOs associated with nearby pillars. The YSOs have a much lower space density outside the region bounded by the dust pillars, indicating that this star formation has indeed been triggered by feedback. We propose, therefore, that this general picture can explain the observed properties of the South Pillars in Carina, and is probably the dominant mode of ongoing star formation in more distant evolving giant H ii regions such as 30 Dor and NGC 604.
The stars forming in this propagating wave are not necessarily all low mass stars. Indeed, the region of the South Pillars contains roughly 10–20 O-type stars (it is not clear if they all formed there), one of which is a very massive WNH star (HD 93131). It has generally been assumed that the O stars in Cr228 make up an extended part of Tr 16, but the results here suggest that at least some of the O-star components in Cr228 were born in the South Pillars about 1–2 Myr after Tr 16. If true, this has important implications for the IMF of this propagating star formation (i.e. it forms both massive and low-mass stars; see §3). These O-type stars may profoundly affect the subsequent shaping of the pillars because they are much closer to the gas than the original first generation O-type stars. Examining Figure 15c, for example, one can easily imagine that a newly born massive star located off the axis of the pillar (because it formed in a neighboring pillar, or because it drifted there due to its own random motion) could bend the apparent elongation axis of the pillar. This is especially true for smaller and more evolved filamentary pillars or cometary clouds. Indeed, upon examining the orientations of dust pillar axes in the South Pillars of Carina (Figure 12), one sees that most of the large pillars point toward Carinae and the Tr 14 and Tr 16 clusters, whereas many of the smaller pillars and cometary clouds point in other directions. One can even see cases where a large pillar has an axis that points toward the main clusters, whereas some of its own sub-components point elsewhere, as one might infer from Figure 15.
In §3 we identified roughly 1000 YSOs with ages of 0.1–1 Myr, but because of incompleteness due to various effects — exclusion due to our detection criteria, extended emission, background contamination, etc., regions not included in our IRAC map, and especially due to detection limits that exclude most YSOs below 2–3 — we estimated that the true number of YSOs in this age range is closer to 5103 or more. These are located within a larger region that is roughly 3 Myr old and has formed a total of roughly (5–8)104 stars (Smith 2006; Smith & Brooks 2007). Very roughly speaking, the size of the younger population seen currently seems consistent with a relatively constant rate of star formation over the 3 Myr age of the Carina Nebula.
Stars in Tr 16 are usually assumed to be 3 Myr old, whereas Tr14 is probably somewhat younger at roughly 2 Myr (Walborn 1995; Smith 2006). The various sub-clusters of YSOs in the South Pillars discussed here constitute another major component of the stellar content. It therefore seems likely that the Carina Nebula complex is an OB association that is built up steadily over time, throughout the age of the region and continuing today. This departs from the prevailing view of the region, which has generally assumed a first generation of OB stars formed in an isolated event (Tr 14 and 16), followed by relatively low-level “percolating” star formation induced by feedback (see review by Smith & Brooks 2007). This implies that the current mode of star formation within the pillars of Carina is an important mechanism for the continual buildup of OB associations.
The region contains a total mass in stars of (4–6)104 (Smith 2006; Smith & Brooks 2007), and is currently spread across a region of 30 pc in size, so the escape velocity from the region is only 4 km s-1. After the gas has been evacuated, the stars are therefore likely to be unbound due to their own random motions, eventually constituting a loose OB association rather than a bound cluster. (Subcomponents such as Tr 14, however, may remain bound as open clusters for a significant time.) It therefore seems clear that in Carina we are witnessing the birth and continual buildup of an OB association over an extended period of several Myr. Smith (2006) noted, for example, that the stellar content of the Carina Nebula is comparable to that of the cluster in NGC 3603, although in Carina it is spread among several sub-clusters across 10–30 pc.
We conjecture that the process of propagating star formation across a cloud may be an important key in forming an unbound OB association rather than a bound cluster, since stars are forming in gas that is in the process of being accelerated outward by feedback. If this is common, one would therefore expect significant age spreads in OB associations, of order a few Myr. If massive stars form in the dispersed population and they inherit the outward motion of the accelerated pillars, then some substantial fraction of the massive stars in an OB association may migrate quite far from their birth site. Expanding outward at 10 km s-1, a massive star can move 100 pc in 10 Myr. Viewed after several Myr near the end of their main-sequence lifetime, this may produce a population of late O-type stars that will appear to be in relative isolation, even though they formed at the periphery of a giant H ii region. When they finally explode as a SN, they will not be associated with an obvious H ii region or star cluster. In Carina, this may apply to 20 of the 70 O-type stars in the whole region.
In future observations, it will be interesting to directly measure the kinematics of Carina’s stars and gas independently, to confirm the scenario of star formation being triggered as gas in the pillars is accelerated by feedback, as we depict in Figure 15, and to test the degree to which the association is gravitationally bound. Comparison to numerical simulations of feedback effects on clouds that include self gravity will be key to this effort. Also, a comparison of our YSO sample to the sample of young stars traced by their X-ray emission is an important next step to investigate the population of stars that are losing their disks.
6 Conclusions
We have analyzed multiwavelength images of two regions in the Carina Nebula obtained with the IRAC camera onboard Spitzer, including both point sources and the diffuse emission from dust and PAHs. We have conducted photometry and produced a point source catalog merged with data from the 2MASS point source catalog, and we have used this to produce a list of highly reliable YSOs selected on the basis of fits to their SEDs. Here we provide a brief list of several conclusions from this work.
1. We provide a merged IRAC+2MASS catalog of over 44,000 point sources detected in at least 4 of 7 filters. Most of these are foreground and background sources. We identify 909 YSOs, selected based on fits to their SEDs. We note that this is a severe underestimate of the true number of YSOs for several reasons, including our rigorous selection criteria for point sources.
2. Our YSO sample is also an underestimate of the true number of YSOs because it misses faint sources due to sensitivity at stellar masses below 2–3 . Correcting for these missing sources using an Orion-like IMF (Muench et al. 2002), we find that there should be more than 5,000 YSOs in the South Pillar region of Carina. Considering that even this is an underestimate, we find it likely that star formation has continued at a relatively constant level over the 3 Myr lifetime of the region. The current star formation occurring in dust pillars may therefore represent an important mode for the continual buildup of large OB associations.
3. Comparing the -band and 3.6 m luminosity functions (LFs) of our YSO sample to the LFs from Orion, we find no compelling evidence that the IMF is different among the collective generation of stars currently forming in Carina. There are slight deficits in Carina at the bright end of the LFs, which are subject to low number statistics from the Orion sample, but we speculate that the apparent deficit of more luminous YSO sources in Carina compared to Orion may result if more massive stars shed their own disks more quickly than lower mass stars. The 10–20 O-type stars that are spatially associated with the YSOs in the South Pillars probably formed along with them, and none of these have dusty disks.
4. A corollary to the previous point is that while the aggregate population shows no convincing deviations from a standard IMF, there do appear to be possible fluctuations in the IMF from one sub-cluster to the next. This is indicated by the apparent ratio of the numbers of O-type stars to associated YSOs, although this may also be an age effect.
5. We detect surprisingly few of the so-called extended green objects (EGOs; thought to be molecular outflows), given the large number of YSOs and the known outflow activity traced by optical HH jets (Smith et al. 2010). We attribute this lack of EGO sources to photodissociation of the molecular outflows by the UV radiation field in Carina and to the added difficulty of detecting excess Band 2 flux amid the bright background emission in Carina.
6. A population of extended red objects (EROs) exhibit diffuse emission that is not consistent with the colors expected for PAH emission. The EROs are found to be associated with late O-type or early B-type stars, and several show a bow-shock morphology with the apex of the shock pointing inward to the first generation massive stars. We suggest that these EROs represent thermal dust emission in shocks at the interface between stellar winds and dense photoevaporative flows in the South Pillars, akin to the similar structures seen in M 17 (Povich et al. 2008).
7. Judging by qualitative aspects of the observed structures of pillars seen in PAH emission, their filamentary structure is consistent with shocked or photoablated clouds in advanced stages of destruction. The smaller pillars have probably been accelerated outward from their initial positions.
8. We have analyzed the directions of the pillar axes for the ensemble of pillars in Carina. While large pillars generally point inward to the first generation O-type stars in Tr 14 and Tr 16, many of the smaller pillars and cometary clouds point in other directions. We suggest that as a cloud is sculpted into the shape of a pillar by the first generation stars, it may also succumb to the influence of local O-type stars that were born in the second generation or that moved into its vicinity, effectively bending the pillar to a different orientation. Local O-type stars may also be more influential when the most massive stars like Car reach the ends of their lives and their ionizing flux drops.
9. The relative spatial distribution of YSOs and dust pillars reveals that while several Stage I YSOs are indeed located within the heads of dust pillars, many more Stage I, II and III YSOs are scattered outside of pillars. The YSOs show some small-scale clumping, but in general they form a large association of YSOs occupying a cavity that is bounded by pillars. In several cases, smaller sub-clusters of YSOs are found just interior to the current locations of the heads of dust pillars.
10. We draw attention to one subcluster of stars, which was shown previously to have several X-ray sources (Sanchawala et al. 2007). We argue that this cluster (Tr 16 SE) is not an embedded cluster, but is instead a young cluster that is obscured behind (not within) the dark dust lane that bisects the Carina nebula, with a likely age of 1–2 Myr.
11. We propose a scenario where pillars are transient features in a continually outwardly propagating wave of star formation. As the dust pillars are accelerated outward and destroyed by feedback from first-generation massive stars, they also form new stars in the process and leave behind a wake of YSOs. The YSOs formed over time by an ensemble of pillars are subsumed into a young OB association formed over a span of 106 yr, but the youngest ones still show some hierarchical sub-clustering and spatial association near the heads of pillars.
12. The current star formation rate compared to the existing population of massive stars in the Carina Nebula is roughly consistent with a relatively constant rate of star formation averaged over 3 Myr. Roughly 10–20 of the region’s 70 O stars are closely associated with gas and dust pillars in the South Pillar region, and appear to have formed there recently (in the last 1 Myr, rather than 3 Myr ago like Tr16), based on the Stage II and III YSOs that they are associated with). This is consistent with our finding above that there is no compelling evidence for a substantially altered IMF. Thus, the current star formation in the Pillars of Carina is likely to represent an important mode of star formation for the gradual buildup of an OB association.
13. We find that the fledgling OB association is likely to be unbound. When all star formation in the region has ceased and the gas is removed, we will likely be left with a dispersing OB association where the massive stars have an age spread of 3–4 Myr. There will be a “halo” of stars spread across 100 pc, surrounding a pair of central clusters (Tr 14 and 16) that will be marginally bound; altogether it may appear much like h and Persei (Currie et al. 2009). The imminent onset of the supernova driven phase may impact this picture, however, as discussed by Smith & Brooks (2007). We suggest that the nature as an unbound association is likely related to its formation mechanism in an outwardly propagating wave distrubuted over space rather than in a single compact cluster.
14. Feedback-driven star formation may result in a substantial fraction of the massive-star content being spatially dispersed, spread across 100 pc after several Myr. Migrating from their birth site, these massive stars may falsely appear to have formed in isolation, and their SNe will not necessarily be coincident with an obvious H ii region or star cluster. More detailed consideration of these points will be discussed in a future paper.
ACKNOWLEDGMENTS
This work was based on observations made with the Spitzer Space Telescope, which is operated by the Jet Propulsion Laboratory, California Institute of Technology under a contract with NASA. Support for this work was provided by NASA through awards issued by JPL/Caltech as part of GO programs 3420 and 20452.M.S.P. is supported by an NSF Astronomy & Astrophysics Fellowship under award AST-0901646. B.A.W. was supported by NASA through the Spitzer Space Telescope Theoretical Research Programs, through a contract issued by the JPL/Caltech under a contract with NASA. R.D.G. was supported by NASA through contracts No. 1256406 and 1215746 issued by JPL/Caltech to the University of Minnesota.
References
- [] Allen, L., et al. 2004, ApJS, 154, 363
- [] Araya, E., et al. 2007, ApJ, 669, 1050
- [] Ascenso, J., Alves, J., Vicente, S., & Lago, M.T.V.T. 2007, A&A, 476, 199
- [] Bally, J., & Reipurth, B. 2001, ApJ, 546, 299
- [] Bally, J., & Reipurth, B. 2003, AJ, 126, 893
- [] Benjamin, R.A., et al. 2003, PASP, 115, 953
- [] Bertoldi, F. 1989, ApJ, 346, 735
- [] Bertoldi, F., & McKee, C.F. 1990, ApJ, 354, 529
- [] Bowler, B.P., Waller, W.H., Megeath, S.T., Patten, B.M., & Tamura, M. 2009, AJ, 137, 3685
- [] Brooks, K.J., Burton, M.G., Rathborne, J.M., Ashley, M.C.B., & Storey, J.W.V. 2000, MNRAS, 319, 95
- [] Churchwell, E., et al. 2004, ApJS, 154, 322
- [] Churchwell, E., et al. 2009, PASP, 121, 213
- [] Currie, T., et al. 2009, arXiv:0911.5514
- [] Crowther, P.A. 2003, Ap&SS, 285, 677
- [] Crowther, P.A., & Dessart, L. 1998, MNRAS, 296, 692
- [] Crowther, P.A., Smith, L.J., Hillier, D.J., & Schmutz, W. 1995, A&A, 293, 427
- [] Cyganowski, C.J., Brogan, C.L., & Hunter, T.R. 2007, AJ, 134, 346
- [] Cyganowski, C.J., et al. 2008, AJ, 136, 2391
- [] Davis, C.J., Kumar, M.S.N., Sandell, G., Froebrich, D., Smith, M.D., & Currie, M.J. 2007, MNRAS, 374, 29
- [] Dyson, J.E. 1973, A&A, 27, 459
- [] Elmegreen, B.G. 1976, ApJ, 205, 405
- [] Elmegreen, B.G. 1992, in Star Formation in Stellar Systems, ed. G. Tenorio-Tagle et al. (Cambridge: Cambridge University Press), 381
- [] Elmegreen, B.G., & Lada, C.J. 1977, ApJ, 214, 725
- [] Elmegreen, B.G., & Scalo, J. 2004, ARA&A, 42, 211
- [] Everett, J.E., & Churchwell, E. 2010, ApJ, in press (arXiv:1003.0838)
- [] Fazio, G., et al. 2004, ApJS, 154, 10
- [] Fitzgerald, M.P., & Mehta, S. 1987, MNRAS, 228, 545
- [] Gehrz, R.D., et al. 2007, Rev. Sci. Instrum., 78, 011302
- [] Gorti, U., & Hollenbach, D. 2002, ApJ, 573, 215
- [] Gutermuth, R.A., Megeath, S.T., Myers, P.C., Allen, L.E., Pipher, J.L., & Fazio, G. 2008, ApJ, 674, 336
- [] Haisch, K.E., Lada, E.A., & Lada, C.J. 2001, ApJ, 553 L153
- [] Hägele, G.F., Albacete Colombo, J.F., Barbá, R.H., & Bosch, G.L. 2004, MNRAS, 355, 1237
- [] Hanson, M.M., Conti, P.S., & Reike, M.J. 1996, ApJS, 107, 281
- [] Harvey, et al. 2006, ApJ, 644, 307
- [] Harvey, et al. 2007, ApJ, 663, 1149
- [] Hunter, T.R., Brogan, C.L., Megeath, S.T., Menten, K.M., Beuther, H., & Thorwirth, S. 2006, ApJ, 649, 888
- [] Indebetouw, R., et al. 2005, ApJ, 619, 931
- [] Indebetouw, R., Robitaille, T.P., Whitney, B.A., Churchwell, E., Babler, B., Meade, M., Watson, C., & Wolfire, M. 2007, ApJ, 666, 321
- [] Jiang, Z., et al. 2002, ApJ, 577, 245
- [] Kahn, F.D. 1969, Physica, 41, 172
- [] Kassis, M., et al. 2006, ApJ, 637, 823
- [] Klein, R.I., McKee, C.F., & Colella, P. 1994, ApJ, 420, 213
- [] Kukarkin, B.V., et al. 1981, Catalog of Suspected Variabl Stars (Moscow: Acad. Sciences USSR)
- [] Mackey, J., & Lim, A.J. 2010, MNRAS, 403, 714
- [] Marcolini, A., Strickland, D.K., D’Ercole, A.D., Heckman, T.M., & Hoopes, C.G. 2005, MNRAS, 362, 626
- [] Massey & Johnson 1993
- [] McCaughrean, M.J., & Andersen, M. 2002, A&A, 389, 513
- [] Megeath, S.T., Cox, P., Bronfman, L., & Roelfsema, P.R. 1996, A&A, 305, 296
- [] Mizuta, A., et al. 2006, ApJ, 647, 1151
- [] Muench, A.A., Lada, E., Lada, C.J., Alves, J. 2002, ApJ, 573, 366
- [] Noriega-Crespo, A., et al. 2004, ApJS, 154, 352
- [] Oort, J.H., & Spitzer, L. 1955, ApJ, 121, 6
- [] Pittard, J.M., Falle, S.A.E.G., Hartquist, T.W., & Dyson, J.E. 2009, MNRAS, 394, 1351
- [] Povich, M.S., et al. 2008, ApJ, 689, 242
- [] Povich, M.S., et al. 2009, ApJ, 696, 1978
- [] Rathborne, J.M., Burton, M.G., Brooks, K.J., Cohen, M., Ashley, M.C.B., & Storey, J.W.V. 2002, MNRAS, 331, 85
- [] Rathborne, J.M., Brooks, K.J., Burton, M.G., Cohen, M.,& Bontemps, S. 2004, A&A, 418, 563
- [] Reach, W.T., et al. 2004, ApJS, 154, 385
- [] Reach, W.T., et al. 2009, ApJ, 690, 683
- [] Reipurth, B., Bally, J., Fesen, R.A., & Devine, D. 1998, Nature, 396, 343
- [] Robitaille, T.P., Whitney, B.A., Indebetouw, R., Wood, K., & Denzmore, P. 2006, ApJS, 167, 256
- [] Robitaille, T.P., Whitney, B.A., Indebetouw, R., & Wood, K. 2007, ApJs, 169, 328
- [] Sanchawala, K., Chen, W.P., Lee, H.T., Chu, Y.H., Nakajima, Y., Tamura, M., Baba, D., & Sato, S. 2007, ApJ, 656, 462
- [] Shepherd, D.S., et al. 2007, ApJ, 669, 464
- [] Skrutskie, M.F., et al. 2006, AJ, 131, 1163
- [] Smith, H.A., Hora, J.L., Marengo, M., & Pipher, J.L. 2006, ApJ, 645, 1264
- [] Smith, N. 2006, MNRAS, 367, 763
- [] Smith, N. 2009, MNRAS, in press
- [] Smith, N., & Brooks, K.J. 2007, MNRAS, 379, 1279
- [] Smith, N., & Conti, P.S. 2008, ApJ, 697, 1467
- [] Smith, N., Bally, J., & Morse, J.A. 2003, 587, L105
- [] Smith, N., Bally, J., & Brooks, K.J. 2004a, AJ, 127, 2793
- [] Smith, N., Barbá, R.H., & Walborn, N.R. 2004b, MNRAS, 351, 1457
- [] Smith, N., Stassun, K.G., & Bally, J. 2005, AJ, 129, 888
- [] Smith, N., Bally, J., & Walawender, J. 2007, AJ, 134, 846
- [] Smith, N., Egan, M., Carey, S., Price, S.D., Morse, J.A., Price, P.A. 2000, ApJ, 532, L145
- [] Smith, N., Foley, R.J., & Filippenko, A.V. 2008, ApJ, 680, 568
- [] Smith, N., Bally, J., & Walborn, N.R. 2010, MNRAS, in press (arXiv:1002.4898)
- [] Smith, R.G. 1987, MNRAS, 227, 943
- [] Spitzer, L. 1954, ApJ, 120, 1
- [] Stanke, T., et al. 2002, A&A, 393, 251
- [] Townsley, L. 2006, in “Massive Stars: From Pop III and GRBs to the Milky Way”, ed. M. Livio, in press (astro-ph/0608173)
- [] Usov, V.V. 1991, MNRAS, 252, 49
- [] Velusamy, T., Langer, W.D., & Marsh, K.A. 2007, ApJ, 668, L159
- [] Walborn, N.R. 1973, ApJ, 179, 517
- [] Walborn, N.R. 1995, RevMexAA, Ser. Conf., 2, 51
- [] Walborn, N.R. 2009, in Eta Car and the Supernova Impostors, ed. K. Davidson & R.M. Humphreys (Springer), in press
- [] Walborn, N.R., et al. 2002a, AJ, 123, 2754
- [] Walborn, N.R., Danks, A.C., Vieira, G., & Landsman, W.B. 2002b, ApJS, 140, 407
- [] Walborn, N.R., Smith, N., Howarth, I.D., Vieira-Kober, G., Gull, T.R., & Morse, J.A. 2007, PASP, 119, 156
- [] Werner, M., et al. 2004, ApJS, 154, 1
- [] Whalen, D.J., & Norman, M.L. 2008, ApJ, 672, 287
- [] Whitney, B.A., Wood, K., Bjorkman, J.E., & Wolff, M.J. 2003a, ApJ, 591, 1049
- [] Whitney, B.A., Wood, K., Bjorkman, J.E., & Cohen, M. 2003b, ApJ, 598, 1079
- [] Whitney, B.A., Indebetouw, R., Bjorkman, J.E., & Wood, K. 2004, ApJ, 617, 1177
- [] Williams, J.R., Ward-Thompson, D., & Whitworth, A.P. 2001, MNRAS, 327, 788
- [] Williams, P.M., et al. 1990, MNRAS, 243, 662
- [] Yonekura Y., Asayama S., Kimura K., Ogawa, H., Kanai, Y., Yamaguchi, N., Barnes, P.J., & Fukui, Y. 2005, ApJ, 634, 476