FROM THE CONVERGENCE OF FILAMENTS TO DISK-OUTFLOW ACCRETION: MASSIVE-STAR FORMATION IN W33A
Abstract
Interferometric observations of the W33A massive star-formation region, performed with the Submillimeter Array (SMA) and the Very Large Array (VLA) at resolutions from 5″ (0.1 pc) to 0.5″ (0.01 pc) are presented. Our three main findings are: (1) parsec-scale, filamentary structures of cold molecular gas are detected. Two filaments at different velocities intersect in the zone where the star formation is occurring. This is consistent with triggering of the star-formation activity by the convergence of such filaments, as predicted by numerical simulations of star formation initiated by converging flows. (2) The two dusty cores (MM1 and MM2) at the intersection of the filaments are found to be at different evolutionary stages, and each of them is resolved into multiple condensations. MM1 and MM2 have markedly different temperatures, continuum spectral indices, molecular-line spectra, and masses of both stars and gas. (3) The dynamics of the “hot-core” MM1 indicates the presence of a rotating disk in its center (MM1-Main) around a faint free–free source. The stellar mass is estimated to be . A massive molecular outflow is observed along the rotation axis of the disk.
1 Introduction
Stars form by accretion of gas in dense molecular-cloud cores. However, the differences, if any, in the details of the formation process of massive stars (those with roughly ) compared to low-mass stars are not well understood. Recent reviews on the topic are those by Beuther et al. (2007), and Zinnecker & Yorke (2007).
We are carrying out a program aimed at studying how the formation of massive stars in clusters proceeds in the presence of different levels of ionization, from the onset of detectable free–free emission to the presence of several bright ultracompact (UC) H II regions. In this paper we present our first results on the massive star-formation region W33A (also known as G12.91-0.26), at a kinematic distance of 3.8 kpc (Jaffe et al., 1982). W33A is part of the W33 giant H II region complex (Westerhout, 1958). It was recognized as a region with very high far infrared luminosity ( ), but very faint radio-continuum emission by Stier et al. (1984). van der Tak et al. (2000) modeled the large-scale (arcminute) cloud as a spherical envelope with a power-law density gradient, based on single-dish mm/submm observations. Those authors also presented mm interferometric observations at several-arcsecond resolution that resolved the central region into two dusty cores separated by AU. The brightest mm core contains faint ( mJy at cm wavelengths) radio-continuum emission (Rengarajan & Ho, 1996) resolved at 7 mm into possibly three sources separated by less than ( AU) from each other (van der Tak & Menten, 2005). These radio sources were interpreted by van der Tak & Menten (2005) as the gravitationally trapped H II regions set forth by Keto (2003). However, the earlier detection by Bunn et al. (1995) of near-infrared recombination line (Br) emission with FWHM suggests that at least some of the radio free–free emission is produced by a fast ionized outflow. More recently, Davies et al. (2010) reported spectroastrometry observations of Br emission toward W33A. The Br emission appears to be produced by at least two physical components: broad line wings extending to a few hundreds of kilometers per second from the systemic velocity appear to trace a bipolar jet on scales of a few AU, while the narrow-line emission may be attributed to a dense H II region (Davies et al., 2010). Being a bright mid- and far-infrared source, W33A has also been target of interferometry experiments at these wavelengths, which reveal density gradients and non-spherical geometry in the warm dust within the inner few hundred AU (de Wit et al., 2007, 2010).
Here we report on millimeter and centimeter interferometric observations performed with the Submillimeter Array (SMA) and the Very Large Array (VLA) at angular resolutions from to . We find a massive star-forming cluster embedded in a parsec-scale filamentary structure of cold molecular gas. The dense gas is hierarchically fragmented into two main dusty cores, each of them resolved into more peaks at our highest angular resolution. The main cores appear to be at different evolutionary stages, as evidenced from their differing spectra, masses, temperatures, and continuum spectral indices. The warmer core harbors faint free–free emission centered on a rotating disk traced by warm molecular gas. The disk powers a massive molecular outflow, indicating active accretion. In Section 2 of this paper, we describe the observational setup. In Section 3 we list our results, in Section 4 we present a discussion of our findings, and in Section 5 we give our conclusions.
2 Observations
2.1 SMA
We observed the W33A region with the Submillimeter Array111The Submillimeter Array is a joint project between the Smithsonian Astrophysical Observatory and the Academia Sinica Institute of Astronomy and Astrophysics and is funded by the Smithsonian Institution and the Academia Sinica. (Ho et al., 2004) in the 1.3-mm (230 GHz) band using two different array configurations. Compact-array observations were taken on 2007 July 17, and covered baselines with lengths between 7 and 100 K (detecting spatial structures in the range of to ). Very Extended (VEX) configuration data were taken on 2008 August 2, with baseline lengths from 23 to 391 K ( to ). For both observations, the two sidebands covered the frequency ranges of and GHz with a uniform spectral resolution of .
We also report on the continuum emission from archival observations taken in the 0.9-mm (336 GHz) band on 2006 May 22. The array was in its Extended configuration, with baseline lengths from 18 to 232 K ( to ). These data were used to constrain the spectral index of the continuum sources.
The visibilities of each data set were separately calibrated using the SMA’s data calibration program, MIR. We used Callisto to obtain the absolute amplitude and quasars to derive the time-dependent phase corrections and frequency-dependent bandpass corrections. Table 1 lists relevant information on the calibrators. We estimate our flux-scale uncertainty to be better than . Further imaging and processing was done in MIRIAD and AIPS.
The continuum was constructed in the domain from the line-free channels. The line-free continuum in the 1.3-mm Compact-configuration data was bright enough to perform phase self-calibration. The derived gain corrections were applied to the respective line data. No self-calibration was done for the higher angular resolution data sets.
2.2 VLA
We observed the and inversion transitions of NH3 with the Very Large Array222 The National Radio Astronomy Observatory is operated by Associated Universities, Inc., under cooperative agreement with the National Science Foundation.. Observations were carried out on 2004 June 14 and 15 (project AC733). The array was in its D configuration, with baseline lengths in the range of 3 to 79 (detecting scales from 68.7″to 2.6″). The correlator was set to the 4-IF mode. Each of the IF pairs was tuned to the (1,1) and (2,2) lines, respectively, covering a bandwidth of 3.1 MHz (39 ) at a spectral resolution of 0.6 .
The data were calibrated and imaged using standard procedures in the AIPS software. Table 1 lists the quasars used to derive the absolute flux scale, the time-dependent gain corrections, and the frequency-dependent passband calibration. The absolute flux scale is accurate within a few percent. No self-calibration was performed.
3 Results
3.1 Continuum Emission
3.1.1 Morphology
Our observations at 1.3 mm resolve each of the two mm cores reported by van der Tak et al. (2000) into multiple continuum sources. The concatenation of Compact- and VEX-configuration data permits us to simultaneously resolve the structures at resolution and to be sensitive to relatively extended structures. Figure 1 (left) shows the 1.3-mm continuum map. It is seen that MM1 and MM2 are resolved into at least three and two smaller mm peaks respectively (marked by crosses in Fig. 1). Only MM1 is associated with the cm emission detected by Rengarajan & Ho (1996). Two of the three faint 7-mm sources ( mJy) reported by van der Tak & Menten (2005) toward MM1 at a resolution of (marked by triangles in Fig. 1) are counterparts of the 1.3-mm peaks. The faintest 7-mm source has no association in our continuum or line data. In addition to the clearly identified 1.3-mm peaks, the northeast-southwest large-scale continuum ridge appears to have more fainter sources. Another possible source is well separated from the ridge, at to the southwest of MM1. More sensitive observations are necessary to investigate their nature.
We label the identified mm peaks as MM1-Main (the brightest source of MM1), MM1-NW (for northwest), MM1-SE (for southeast), MM2-Main, and MM2-NE. Table 2 lists the peak positions and peak intensities measured in the mm map of Fig. 1 left. The sums of the 1.3-mm fluxes of the components that we obtain from multi-component Gaussian fits to the sources comprising MM1 and MM2 are robust, and consistent with the fluxes measured by integrating the intensity over the areas of interest. However, the sizes and fluxes of the individual components in the fits are not accurate, mainly because of insufficient angular resolution. Table 2 lists the added flux of the subcomponents of MM1 and MM2. The ratio of the 1.3-mm flux of MM1 to that of MM2 in our data is 1.2, very close to that reported by van der Tak et al. (2000): 1.3. The fluxes that we report are to larger than those in van der Tak et al. (2000), probably due to differences in coverage and flux-scale uncertainties.
Only the bright, compact sources are detected in the 0.9-mm continuum image (Fig. 1 right). This single-configuration data set has a more modest coverage than the concatenated 1.3-mm data and is less sensitive to extended structures.
3.1.2 Nature of the Continuum
To set an upper limit to the free–free contribution at 1.3-mm we extrapolate the 8.4 to 43.3-GHz free–free spectral index (where the flux goes as ), calculated from the fluxes reported by van der Tak & Menten (2005) and Rengarajan & Ho (1996). This is a reasonable assumption since for free–free sources with moderate optical depths, either jets (e.g., Brooks et al., 2007; Hofner et al., 2007; Gibb & Hoare, 2007) or H II regions (e.g., Franco et al., 2000; Keto et al., 2008; Galván-Madrid et al., 2009), is approximately in the range from 0.5 to 1.
For MM1 with a 7-mm flux of mJy, the maximum free–free flux at 1.3-mm is 28 mJy. The 1.3-mm flux integrated over MM1 is mJy (Table 2). Therefore, the free–free contribution to the 1.3-mm flux is at most %. No cm continuum has been detected toward MM2 or in the rest of the field, thus, the 1.3-mm emission outside MM1 is most probably produced entirely by dust. Using the same considerations, the free–free flux of MM1 at 0.9 mm is less than mJy. The integrated flux of MM1 at this wavelength is mJy, then the free–free emission is at most %. Because the data are taken at different epochs, the possibility of radio variability (see Franco-Hernández & Rodríguez, 2004; van der Tak et al., 2005; Galván-Madrid et al., 2008, for reports on other targets) adds to the uncertainty. The 0.9-mm data may suffer from missing flux, making the fractional free–free contribution at this wavelength even smaller. In the rest of the paper, we consider the (sub)mm free–free emission to be negligible.
To compare the 0.9-mm and 1.3-mm fluxes in a consistent way, we produced images with a uniform coverage (using only baselines with lengths from 30 to 230 ), without self-calibration (using only the VEX data at 1.3 mm and the Extended data at 0.9 mm), and a common circular synthesized beam (HPBW ). The average spectral indices of the two main mm cores are and . In the Rayleigh–Jeans (R-J) approximation (), the spectral index of thermal dust emission is , where is the exponent of the dust absorption coefficient. The fiducial interstellar–medium (ISM) value of is 2, while for hot cores in massive star-forming regions (MSFRs) typical values are (e.g., Cesaroni et al. 1999, Zhang et al. 2007). Therefore, MM1 has typical of a hot core, but MM2 has . In Section 3.2 we show that the kinetic temperature of MM2 is K, then the R-J limit is not a good approximation at 0.9 mm for MM2.
Without using the assumption of being in the R-J limit, the gas mass derived from optically–thin dust emission at 1.3-mm can be obtained from Kirchhoff’s law:
| (1) |
where is the dust temperature, is the 1.3-mm flux density, is the distance to the object, and is the dust absorption coefficient. Assuming coupling between gas and dust, the dust temperature in MM1 is K in the inner arcsecond (obtained from fits to CH3CN lines, see Section 3.2.2) and K at larger scales (obtained from NH3 lines, see Section 3.2.1). For this range of temperature, using an opacity cm2 g-1 (Ossenkopf & Henning, 1994), Equation (1) gives a mass for MM1 in the range . For MM2 with a temperature of 46 K (Section 3.2.1), the mass is . MM2 then appears to be much colder and more massive (in gas) than MM1. The uncertainties in opacity make the mass estimation accurate to only within a factor of a few.
3.2 Molecular Line Emission
3.2.1 The Parsec-scale Gas
The large-scale gas within an area of (or pc) can be divided into quiescent gas and high-velocity gas. The quiescent gas is best traced by the VLA NH3 data. The high-velocity gas is seen in the SMA CO (2–1) maps.
Morphology and Velocity Structure
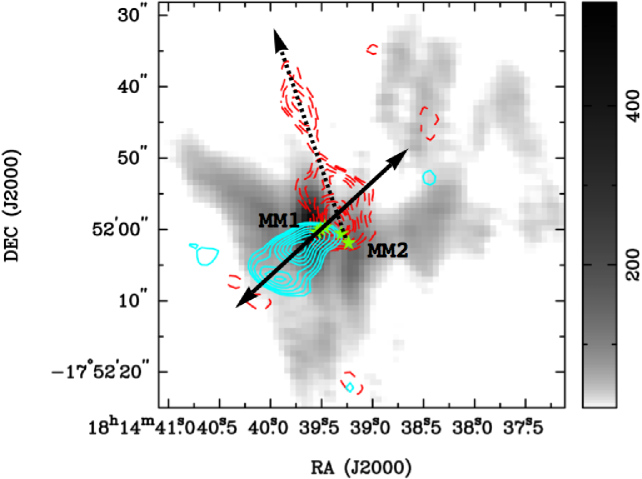
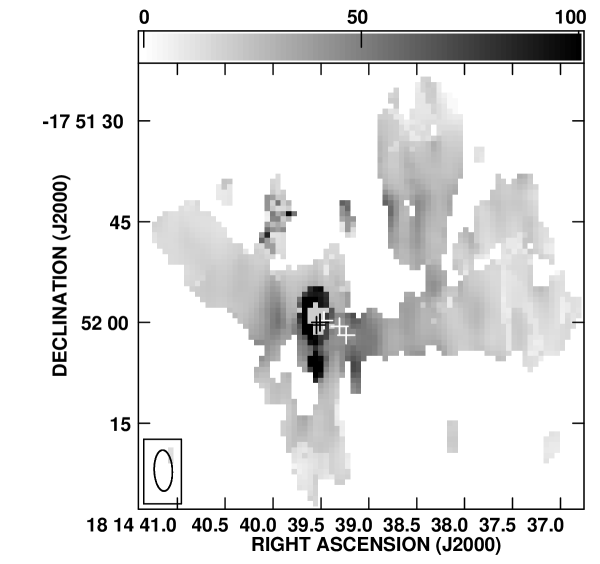
There is a clear morphological difference between the quiescent and the high-velocity gas. Figure 2a shows moment maps of the NH3 (2,2) line overlaid with the high-velocity CO gas. The NH3 moment maps were integrated in the LSR velocity range. The blueshifted CO gas was integrated in the range , and the redshifted CO was integrated in . The systemic velocity of the gas closer to MM1 is (Section 3.2.2). The quiescent NH3 emission is composed of one prominent filamentary structure in the east-west direction that peaks toward the MM1 region (Fig. 2a), plus another filamentary structure that extends to the south of MM1 and MM2, and some fainter clumps toward the northwest of MM2. The high-velocity CO traces at least two molecular outflows that expand outward off the quiescent filaments. The lobes of the most prominent outflow are centered in MM1, and extend toward the northwest (redshifted gas) and southeast (blueshifted) at a position angle P.A. . The observed size of this outflow is about 0.4 pc. The redshifted lobe of a second high-velocity outflow extends pc to the north-northeast of the cores at P.A. , and appears to be originated in MM2. The blueshifted side of this outflow does not appear at high velocities. The P.A. that we find for the main outflow agrees very well with the P.A. of the outflow as seen at 2.2 m reported by (Davies et al., 2010, see their Figure 1), which matches an elongated m structure in images (Figure 12 of Cyganowski et al., 2008). However, the infrared emission is three to four times larger. Also, using single-dish observations, de Wit et al. (2010) reported a CO outflow whose orientation matches those of both the SMA and the near IR outflows. The low-velocity CO (2–1) gas could not be properly imaged because of the lack of short spacings333Single-dish data were taken for this purpose but these were corrupted due to a bad off position and could not be used..
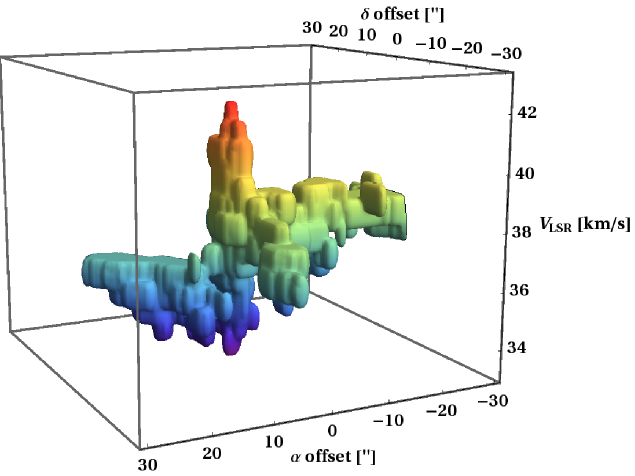
The large-scale quiescent gas has two velocity components, which appear to be two different structures of gas at different velocities, as can be seen in Fig. 2b. The gas associated with MM1 and MM2 (center of the main filament), as well as the western part of the main filament and the north–south extensions appears to be at , with a typical mean-velocity dispersion of . The eastern part of the main filament appears blueshifted, with a mean centroid velocity of and a dispersion of the centroid velocity of . The two gas structures overlap in space toward the MM1/MM2 region, which suggests that the star formation activity in these mm cores was triggered by the convergence of the filaments of molecular gas. Fig. 3 shows a three-dimensional rendering of the same data that better illustrates this result. At the position of the mm cores, the filamentary structures do not merely superpose in position-position-velocity space, but merge into a region that suddenly extends to higher velocities. The larger velocity range at the center (see also Fig. 2c) is found to be due to coherent velocity structures (disk and outflows in the dense gas) with the SMA data (Section 3.2.2).
Physical Parameters
Now we derive the temperature structure of the parsec-scale filaments and lower limits to the outflow parameters.
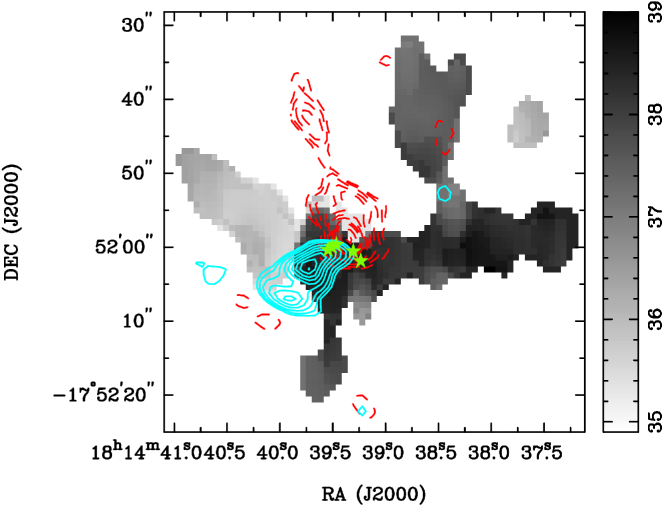
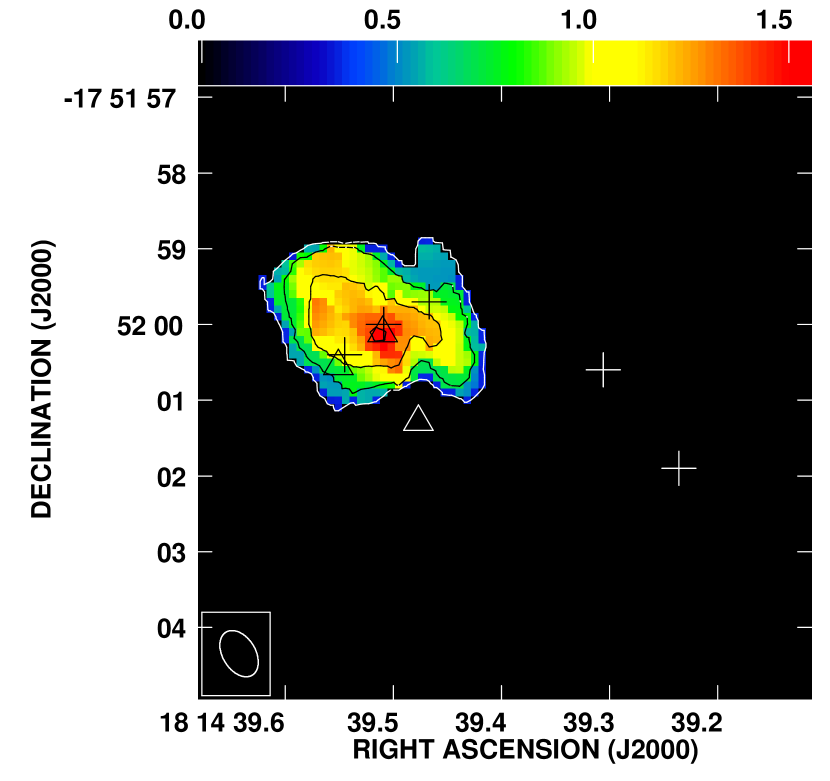
Most of the gas in the pc-scale filaments, including the gas associated with MM2, is cold, with a kinetic temperature K. rises significantly only toward MM1. A temperature map at the resolution of the NH3 data (Fig. 4) was obtained by fitting the (1,1) and (2,2) line profiles as described in Rosolowsky et al. (2008). The errors in the temperature determination are in general K, but get too large toward MM1444The (2,2) to (1,1) ratio is not sensitive to temperatures much larger than 50 K, but we confirm the large temperatures in MM1 at smaller scales using the CH3CN lines, see Section 3.2.2. The errors in the fits also increase toward MM1 due to its wider velocity structure.. We determine the temperature of MM2 to be K. The temperature of MM1 is constrained to K.
For the CO (2–1) line, the interferometric data suffer from missing flux for the more extended emission close to . We set the following limits to the outflow parameters: mass , momentum , and kinetic energy erg s-1, where we corrected for the optical depth at each velocity bin using the 13CO (2–1) line. We refer the reader to Qiu et al. (2009) for a description of the procedure to calculate the aforementioned quantities. The momentum and especially the energy estimations are less affected by missing flux since they depend more on the high-velocity channels. de Wit et al. (2010) estimated the inclination angle of the inner-cavity walls of the outflow to be , by radiative-transfer modeling of the mid-IR emission. Correcting by inclination, the lower limits to the momentum and energy of the outflow are and erg s-1.
3.2.2 The Inner 0.1 pc
Morphology and Velocity Structure
The SMA data permit us to study the molecular gas at a resolution of AU (). Some molecular lines trace relatively cold gas, while some other lines trace the warmer gas closer to the heating sources. Figure 5 shows the spectra over the entire sidebands from the pixels at the positions of the mm peaks MM1-Main and MM2-Main. The prominent lines are labeled, and listed along with their upper-level energy in Table 3. Lines with a peak intensity below 20 K are not listed. A complete inventory of the molecular lines in W33A will be presented in the future. It is immediately seen that MM1 has a “hot-core” spectrum, while MM2 is almost devoid of molecular emission, if not for the CO, 13CO and C18O , and faint SO emission. We interpret this difference as a signature of the evolutionary stage of the cores, MM1 being more evolved than MM2.
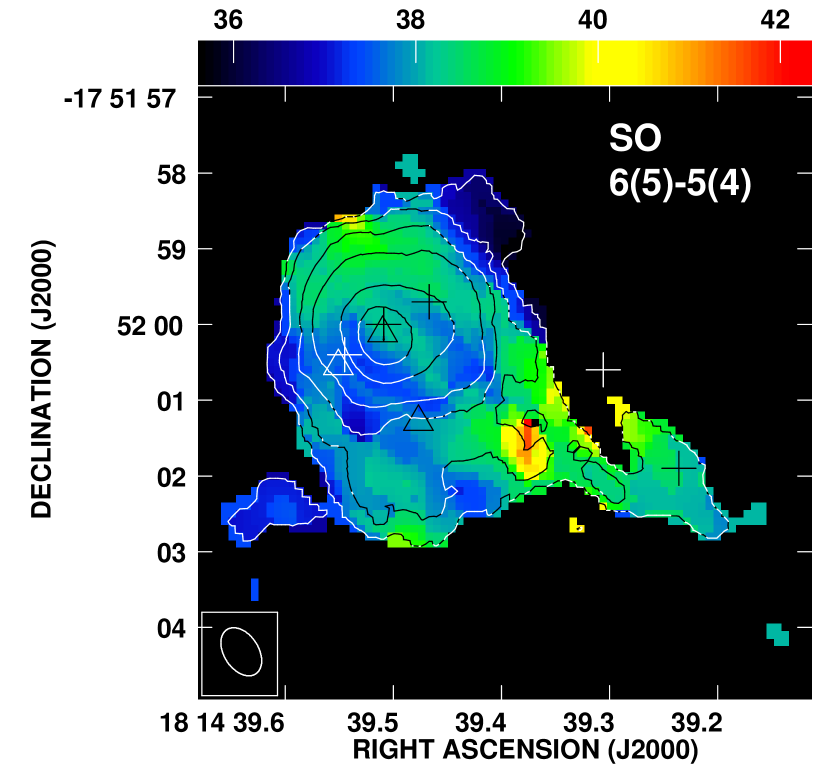
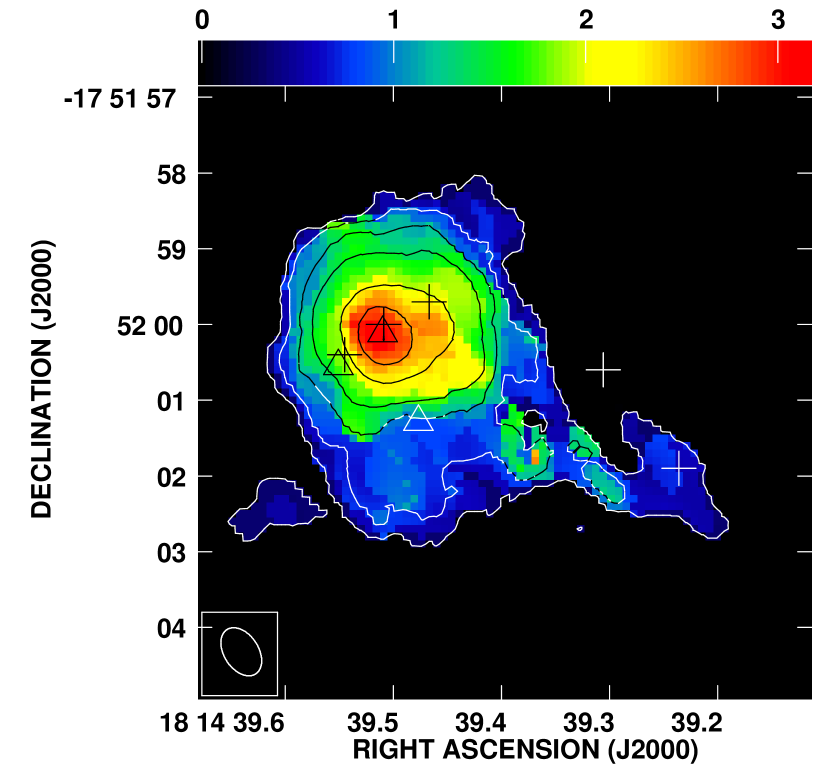
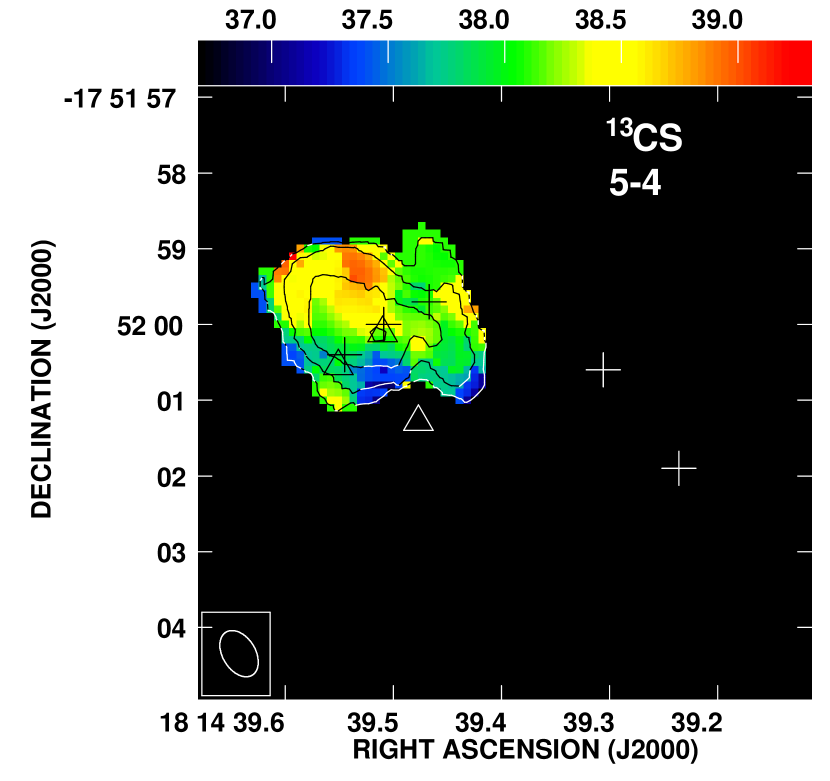
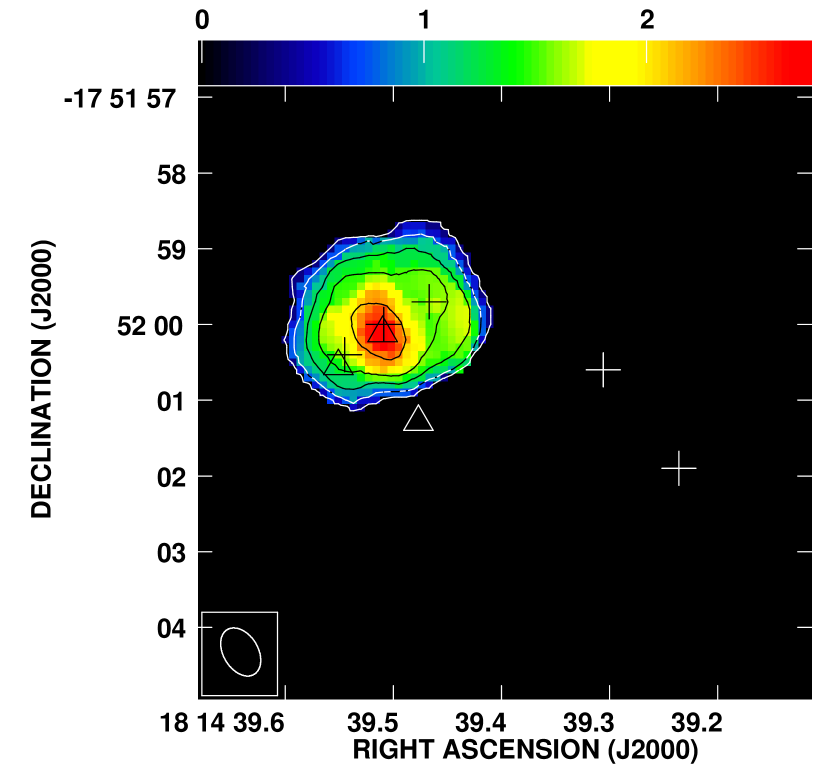
Figure 6 shows the moment maps for three lines that exemplify what was mentioned above. The SO 6(5)–5(4) line (top row) extends in a ridge of pc long in the northeast–southwest direction, from MM1 to MM2. The emission is stronger toward MM1 and peaks in MM1-Main. Part of the emission toward MM2 is redshifted by with respect to the emission in the MM1 side, but there is no clear velocity pattern. Lines such as SO likely have large optical depths and trace only the surface of the emitting region, where clear velocity gradients, especially of rotation, may not be expected. From the SO data we constrain any velocity difference between the MM1 and MM2 cores to .
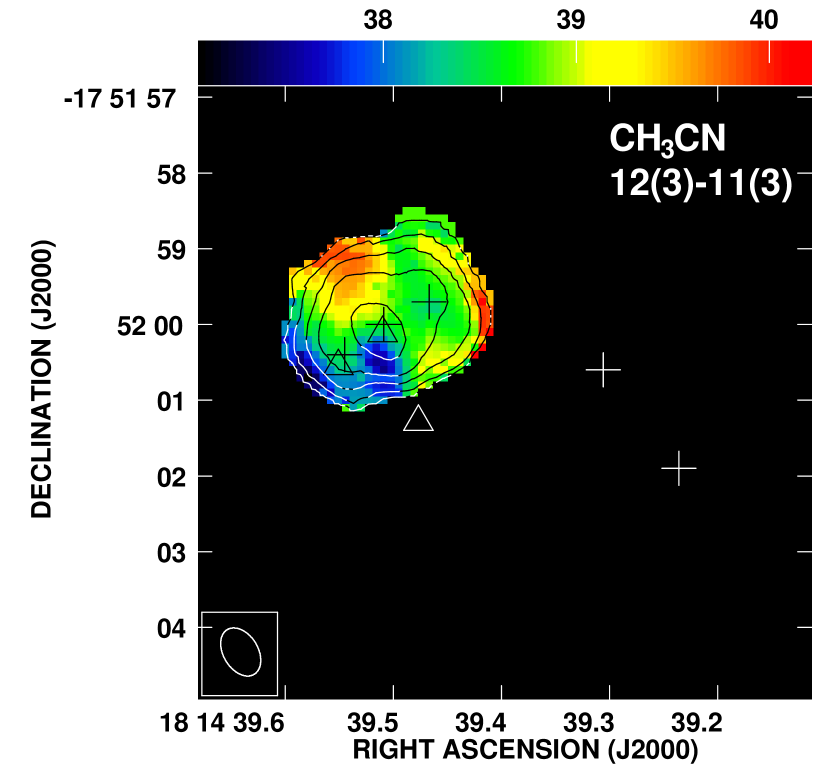
For a given molecule, the isotopologue lines and the lines with upper energy levels well above 100 K trace the more compact gas, closer to the heating sources. Figure 6 shows the examples of 13CS (middle panel) and CH3CN (bottom). Both of them are only visible toward MM1, and peak in MM1-Main. These lines trace a clear velocity gradient centered on MM1-Main, the blueshifted emission is toward the southwest, and the redshifted emission toward the northeast, perpendicular to the main bipolar CO outflow. We interpret this as rotation. The emission tracing this velocity gradient is not isolated, there is also emission coming from MM1-NW and MM1-SE. Especially in the CH3CN lines, this extra emission appears to trace redshifted and blueshifted emission respectively. One possibility is that MM1-NW and MM2-SE are separate protostars from MM1-Main. However, the orientation of the lobes in the high-velocity outflow is the same. Therefore, we prefer the interpretation that MM1-NW and MM2-SE are not of protostellar nature, but emission enhancements (both in continuum and line emission) from the hot base of the powerful molecular outflow driven by the disk-like structure surrounding MM1-Main. In this scenario, the other 7-mm sources reported by van der Tak & Menten (2005) (or at least the counterpart of MM1-NW) can be interpreted as shocked free–free enhancements in a protostellar jet, similar to those observed in the high-mass star formation region IRAS (Rodríguez et al., 2008; Franco-Hernández et al., 2009).
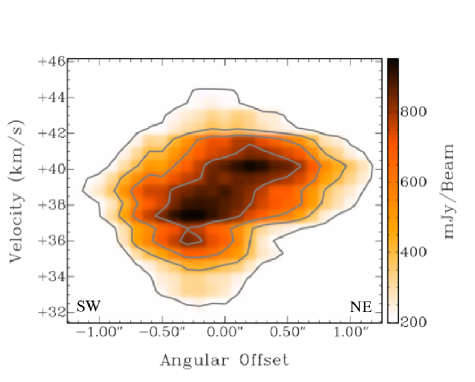
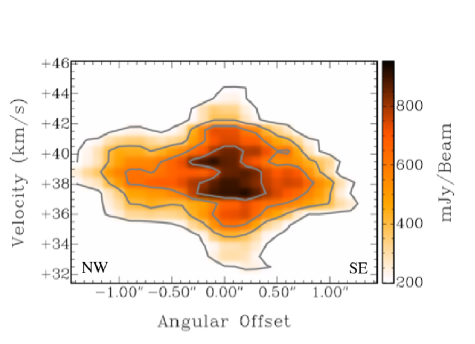
Figure 7 shows the position–velocity (PV) diagrams of the CH3CN line shown in Fig. 6, centered at the position of MM1-Main perpendicular to the rotation axis (top frame) and along it (bottom frame). The rotation pattern is similar to those observed in objects that have been claimed to be Keplerian disks, i.e., structures where the mass of the central object is large compared to the mass of the gas, rotating with a velocity (Zhang et al., 1998; Cesaroni et al., 2005; Jiménez-Serra et al., 2009). The large velocity dispersion closest to MM1-Main (Figs. 6 and 7) ought to be caused by unresolved motions in the inner disk, since velocity dispersions well above 1 cannot be due to the gas temperature.
Recently, Davies et al. (2010) reported a possible disk-jet system centered in W33A MM1-Main. The jet, observed in the Br line, extends up to in velocity at scales 1 AU, with a similar orientation and direction to the molecular outflow reported in this paper. However, the velocity structure of what Davies et al. (2010) interpret as a rotating disk has a similar orientation but opposite sense of rotation as the disk that we report. They used CO absorption lines with upper energy levels K, while we use emission lines like those of CH3CN, with K (Table 3). If an extended screen of cold gas with a negligible velocity gradient is between the observer and the inner warm gas with a velocity gradient, it is possible that the absorption lines are partially filled with emission, mimicking a velocity gradient with the opposite sense than that seen in the emission lines.
Physical Parameters
Now we derive the temperature and column density of the hot-core emission, and constrain the stellar mass, gas mass, and CH3CN abundance in MM1.
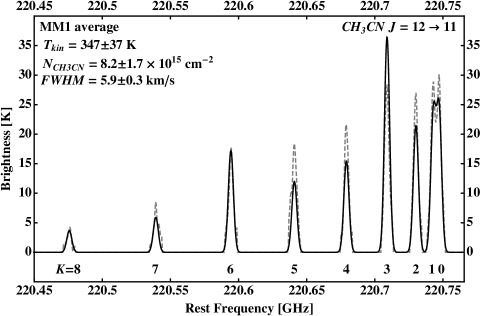
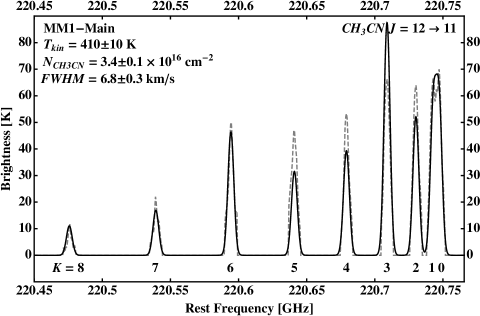
The kinetic temperature of the innermost gas can be obtained from the lines of CH3CN . To avoid the simplification of considering optically-thin emission assumed in a population-diagram analysis, we fit all the lines assuming LTE, while simultaneously solving for the temperature , column density of CH3CN molecules , and line width at half-power FWHM. The procedure to obtain the level populations can be found in Araya et al. (2005).
Figure 8 shows the results of our fits to the CH3CN spectra. The systemic velocity was found to be optimal. The data outside the lines of interest have been suppressed for clarity, and the fit was done in the frequency windows where only the lines of interest are present. The gas is warmer (by ) and denser (by in column) toward the peak MM1-Main (bottom frame) than in the average of the sources composing MM1 (top frame). This makes the case for the internal heating and a centrally-peaked density gradient in MM1-Main, as well as for its protostellar nature. Some lines are not completely well fit under the assumption of a single value for the parameters. On the one hand, the bright and 8 lines indicate the presence of some column of very warm gas; on the other hand, the is not brighter than the lines within the uncertainties, indicating that some column of gas is below 200 K. Two-component fits do not give better results. The reported values should be interpreted as an average along the line of sight. Detailed radiative transfer in the context of a physical model is currently under way.
Under the interpretation of edge-on rotation as the cause of the velocity gradient observed in Figs. 6 and 7, the dynamical mass in MM1-Main (stars plus gas) is about , where a mean-velocity offset of 2.0 with respect to was taken at a radius of . Assuming that the disk is perpendicular to the outflow, and correcting for the outflow inclination angle estimated by de Wit et al. (2010), the enclosed dynamical mass is .
Given that W33A is fragmented into multiple sources, a strict upper limit to the stellar mass in MM1-Main is , the mass necessary to account for the total luminosity () of W33A. Also, the total gas mass in the MM1 sources inferred from dust emission is , therefore the gas mass in the rotating structure around MM1-Main should be a fraction of it. For a gas mass in the rotating structure , the mass of the protostar(s) in MM1-Main amounts to . MM1-Main appears to be B-type protostar still accreting from a rotating disk-like structure.
From the of gas mass in MM1 we derive an average column density of molecular gas of about cm. For an average CH3CN column of cm, a CH3CN abundance with respect to H2 of (CH3CN) is derived, similar estimates in other regions of high-mass star formation (Wilner et al., 1994; Remijan et al., 2004; Galván-Madrid et al., 2009).
4 Discussion
4.1 Star Formation from Converging Filaments
In W33A, two localized regions of star formation (MM1 and MM2) separated by 0.1 pc are surrounded by a common filamentary structure of pc in length (Section 3.2.1). The two velocity components of this filamentary structure are separated by in line-of-sight velocity and intersect in projection right at the position of the star formation activity (Fig. 2). The velocity components are not a mere superposition in position–position–velocity space, but they merge into a structure with larger motions (Fig. 3, Section 3.2.1), resolved into a disk/outflow system by subarcsecond resolution observations (Figs. 6 and 7, Section 3.2.2). This suggests that star formation in W33A was triggered by the convergence of molecular filaments. Such a scenario has been suggested for the region W3 IRS 5 by Rodón et al. (2008). More recently, the merging of filaments has also been claimed by Jiménez-Serra et al. (2010) in the infrared dark cloud G35.39–0.33 and by Carrasco-González et al. (2010) in the MSFR W75.
This mode of star formation is predicted by numerical simulations of star formation triggered by converging flows (Ballesteros-Paredes et al., 1999; Heitsch et al., 2008; Vázquez-Semadeni et al., 2007). In those simulations, the formation of molecular clouds itself is a product of the convergence of streams of neutral gas. Later in the evolution of the molecular clouds, filaments of molecular gas can converge (merge) with each other, leading to the formation of cores and stars.
We present here a simple comparison with a region found in the numerical simulation recently reported by Vázquez-Semadeni et al. (2009). This simulation represents the formation of a giant molecular complex from the convergence of two streams of warm neutral gas, at the scale of tens of parsecs. Specifically, the simulation was performed using the smoothed particle hydrodynamics (SPH) code GADGET (Springel et al., 2001), including sink-particle and radiative cooling prescriptions (Jappsen et al., 2005; Vázquez-Semadeni et al., 2007). The convergence of the warm diffuse-gas streams triggers a thermal instability in the gas, which causes it to undergo a transition to the cold atomic phase, forming a cloud. The latter soon becomes gravitationally unstable, begins contracting, and undergoes hierarchical fragmentation. During the contraction, the density of isolated clumps increases and they can reach physical conditions corresponding to those of molecular clumps. Finally, the global collapse reaches the center of mass of the cloud, at which point a region with physical conditions corresponding to those of MSFRs forms. The simulation box has 256 pc per side, and the converging flows have a length of 112 pc, and a radius of 32 pc. However, after the gravitational contraction, the clumps are only a few parsecs across. Since SPH is essentially a Lagrangian method, it allows sufficient resolution in these dense regions. We refer the reader to Vázquez-Semadeni et al. (2007, 2009) for details of the simulation. Here we focus on the region called “Cloud 1” in Vázquez-Semadeni et al. (2009), albeit roughly 1.5 Myr later than the time examined in that paper.
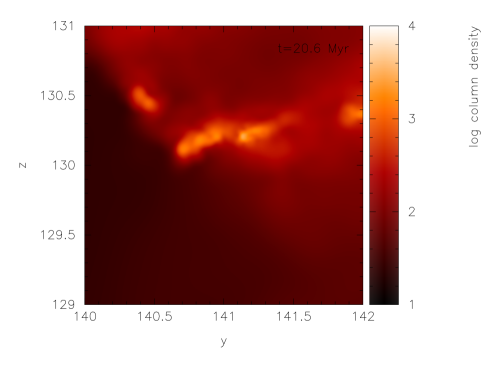
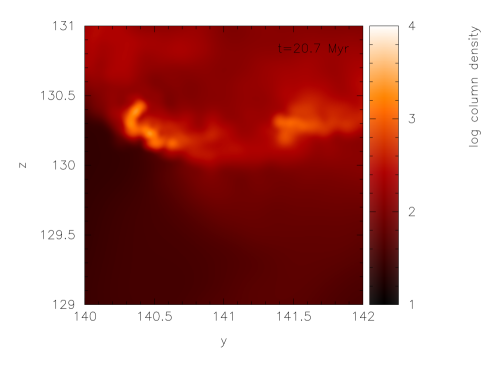
Figure 9 shows two snapshots of column density separated by 0.133 Myr (the time interval between successive data dumps of the simulation). The column density is computed by integrating the density along the -direction over the 10 pc path pc, which is centered at the midplane of the simulation, where the (sheet-like) cloud is located. In this region and epoch of the simulation, the two leftmost filaments in the top panel of Fig. 9 converge to form the boomerang-shaped filament seen in the bottom panel. Note that the simulation was not designed to simulate the observed filaments. The comparison is only intended to show that some of observed properties of W33A can arise naturally in the context of a simulation of the formation of a large molecular complex that contains a filament system.
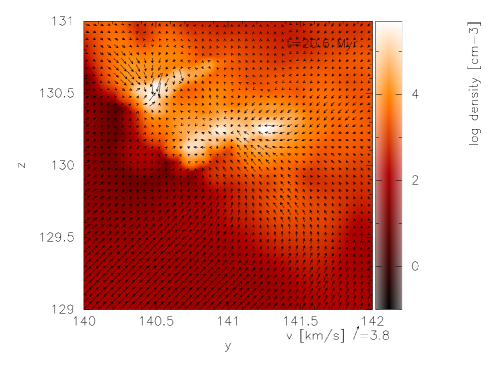
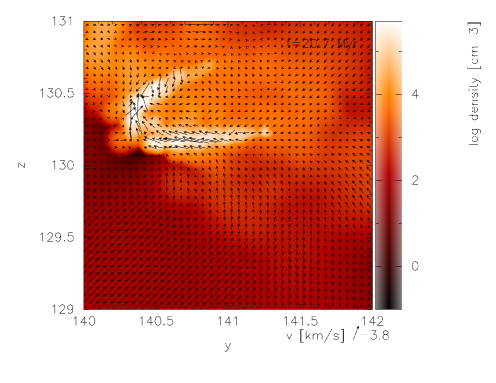
The peaks of two filaments of gas are initially separated by 0.4 pc (top frame of Fig. 9) and then merge at a projected velocity of , measured directly from the displacement observed between the two panels. The column density of the filaments is in the range [] code units (Fig. 9), or ] cm-2. For an NH3 abundance with respect to H2 in the range (e.g., Galván-Madrid et al., 2009), the column density of the cold filaments in our observations is ] cm-2. Figure 10 shows the volume density (color scale) and – plane velocity (arrows) in a slice trough the filaments. It is seen that the filaments reach densities typical of MSFRs (peak cm-3) and that their velocity field presents fast jumps of a few in the interaction zones, comparable to our observations. We conclude that some of the properties of the observed filaments such as sizes, column densities, and velocities agree within a factor of 2 with those from the simulation. This rough comparison illustrates that our interpretation of convergence between the observed filaments is feasible.
4.2 Cores at Different Evolutionary Stages
The star-forming cores in W33A appear to be at markedly different evolutionary stages (Section 3.2.2). The first piece of evidence for this is the clear difference in the richness of the molecular-line emission from MM1 to MM2 (see Fig. 5). MM1 has molecular emission typical of a “hot-core” (Kurtz et al., 2000), with a prominent CH3CN “-forest” that can be detected up to the line, with upper-level energy K (see Table 3). The average gas temperature of MM1 is K. In contrast, MM2 is almost devoid of “hot-core” emission, and is only detected in a few molecules. MM2 is much colder than MM1, with a temperature K. The second piece of evidence is the mass content of the cores. MM1 has only of gas, while MM2 has . This could naively be interpreted as MM2 having a much larger gas reservoir than MM1, but it should be kept in mind that both cores are part of a common parsec-scale structure. Clump infall at pc scales has been reported from single-dish (Wu & Evans, 2003) and interferometric (Galván-Madrid et al., 2009) observations. Also, numerical simulations of parsec-sized clumps show that the star-forming cores that give birth to massive stars are continuously fed from gas in the environment at the clump scales (e.g., Bonnell et al., 2003; Smith et al., 2009; Vázquez-Semadeni et al., 2009; Peters et al., 2010).
There are two possibilities that we briefly discuss here: (1) the prestellar cores that were the precursors to MM1 and MM2 appeared at the same time and then MM1 evolved faster to produce a star (Section 3.2.2), while MM2 only produced at most an intermediate mass star (MM2 is not prestellar, since it has some internal heating and appears to power an outflow, see Section 3.2.1), or (2) the prestellar core precursor to MM2 formed later and has yet to form at least one massive star. Our observations cannot tell these options apart. A measurement of the accretion rate in both cores would be helpful. Sources at different evolutionary stages within a single star-forming cluster have also been reported recently for AFGL 5142 (Zhang et al., 2007), G28.34+0.06 (Zhang et al., 2009), and AFGL 961 (Williams et al., 2009).
4.3 A Rotating Disk/Outflow System in MM1-Main
In the past decade, the question of whether massive stars form by disk-outflow mediated accretion similar to low-mass stars has been the subject of intensive research. The answer is positive: they definitely do. Some of the massive protostars that have been shown to harbor disk/outflow systems are G192.16-3.82 (Shepherd et al., 2001), Cepheus A HW2 (Patel et al., 2005), IRAS 20126+4104 (Cesaroni et al., 2005), and IRAS 16547-4247 (Franco-Hernández et al., 2009). All these relatively clean disk examples, however, do not have stars more massive than 15 to . More massive (O-type) stars have also been shown to form via disk-mediated accretion. However, the innermost part of the accretion flow is often (at least partially) ionized and is observed as a hypercompact (HC) H II region. Also, the gas in these more massive regions is warmed up to farther distances, and very massive rotating structures of size up to 0.1 pc are typically observed. Examples are G10.6-0.4 (Keto & Wood, 2006), G24.78+0.08 (Beltrán et al., 2006), W51e2 (Klaassen et al., 2009), and G20.08-0.14 N (Galván-Madrid et al., 2009), all of which have stellar masses above . A possible exception to this scenario is W51 North, where Zapata et al. (2008, 2009) claims to have found a protostar with and without a “bright” (with flux above tens of mJy at wavelengths cm) H II region. This apparent discrepancy is solved if multiple, lower-mass stars account for the mass in W51 North or if the H II region in this source is gravitationally trapped as currently observed. Indeed, detailed simulations of the evolution of HC H II regions within accretion flows show that their radio-continuum emission flickers significantly in timescales from 10 to yr (Peters et al., 2010).
In this paper we report on the existence of a rotating disk centered on MM1-Main in W33A (Section 3.2.2). To our sensitivity, the radius of the disk is AU. The warm-gas emission does not come only from the disk, but also from an structure elongated perpendicular to it, coincident with the other mm peaks (MM1-NW and MM1-SE) along the direction of the outflow (see Figs. 6 and 7). We propose that the secondary mm peaks in MM1 are not of protostellar nature, but regions where the emission is enhanced due to the interaction of the outflow with the disk and its inner envelope. Indeed, the two brightest 7-mm detections of van der Tak & Menten (2005) are counterparts of MM1-Main (Q1, mJy at 7 mm) and MM1-SE (Q2, mJy at 7 mm).
The free–free emission from the 7 mm source Q1 should be a combination of photoionization by the central protostar and shock-induced ionization of material due to the jet observed by Davies et al. (2010), likely dominated by the latter. The origin of the free–free emission from Q2 could also be shocks, although deeper 7 mm observations are needed to confirm this source. Q3 does not have a mm/submm counterpart and may not be a real source. The radio continuum sources of W33A could then be analogs of those in IRAS 16547–4247 (Rodríguez et al., 2005, 2008), which have fluxes a factor of a few larger at 0.75 times the distance to W33A. Indeed, we find that the radio-continuum emission from Q1 (MM1-Main) agrees with the correlation found for low-mass jets between the radio-continuum luminosity of the jet and the momentum rate of the associated molecular outflow: (Anglada et al., 1998), where the radio luminosity has units of mJy kpc2 and the momentum rate has units of yr-1 km s-1. For W33A with a radio flux mJy (Rengarajan & Ho, 1996), and a distance kpc (Jaffe et al., 1982), the expected momentum rate is yr, while the observed momentum rate (lower limit) is yr (obtained dividing the momentum of the molecular outflow by its length, including the inclination correction). This correlation was found to hold for three well-studied massive protostars (IRAS 16547–4247, HH 80–81, and Cep A HW2) by Rodríguez et al. (2008). In this paper we report that it also holds for W33A, which constitutes further evidence for a common accretion mechanism between low- and high-mass protostars, at least to the stage prior to the development of a brighter H II region.
Comparing the ratio of the radio luminosity to the IR luminosity (8 GHz)/(IR) with the recombination-line line width may be a useful criterion to distinguish between a source ionized by shocks (jet or stellar wind) or by photoionization (what usually is called an H II region). In Fig. 6 of the review by Hoare et al. (2007), it is seen that UC H II regions have the largest (8 GHz)/(IR) and the smallest line width, jet sources have the smallest (8 GHz)/(IR) and the largest line width, and HC H II regions fall in between the previous two. For W33A, (8 GHz)/(IR)) , and the FWHM of the IR recombination lines is of several hundreds , again consistent with a jet source.
The star(s) at the center of MM1-Main (with ) appears to dominate the dynamics of the disk, but we cannot rule out the existence of additional, less massive objects within it. Indeed, models of massive protostellar disks predict their fragmentation and the formation of a few lower mass companions within it (Kratter & Matzner, 2009; Krumholz et al., 2009; Peters et al., 2010).
5 Summary and Conclusions
We present for the first time resolved observations in both mm continuum and molecular-line emission for the massive star formation region W33A, characterized by a very high luminosity () and very low radio-continuum emission ( mJy). Both of the previously known mm cores (MM1 and MM2) are resolved into multiple peaks, and appear to be at very different evolutionary stages, as indicated by their molecular spectra, masses, temperatures, and continuum spectral indices. The brightest core (MM1-Main at the center of MM1) is centered on a very faint free–free source and the gas dynamics up to a few thousand AU of it indicates the presence of a circumstellar disk rotating around a stellar mass of . MM1-Main also drives a powerful, high-velocity molecular outflow perpendicular to the disk. MM2, the coldest and most massive core, is not detected in hot-core lines but appears to drive a more modest outflow. Both MM1 and MM2 are located at the intersection of parsec-scale filamentary structures with line-of-sight velocity offset by . Analysis of the position–position–velocity structure of these filaments and a comparison with recent numerical simulations suggests that star formation in W33A was triggered by the convergence of filaments of cold molecular gas.
References
- Anglada et al. (1998) Anglada, G., Villuendas, E., Estalella, R., Beltrán, M. T., Rodríguez, L. F., Torrelles, J. M., & Curiel, S. 1998, AJ, 116, 2953
- Araya et al. (2005) Araya, E., Hofner, P., Kurtz, S., Bronfman, L., & DeDeo, S. 2005, ApJS, 157, 279
- Ballesteros-Paredes et al. (1999) Ballesteros-Paredes, J., Hartmann, L., & Vázquez-Semadeni, E. 1999, ApJ, 527, 285
- Beltrán et al. (2006) Beltrán, M. T., Cesaroni, R., Codella, C., Testi, L., Furuya, R. S., & Olmi, L. 2006, Nature, 443, 427
- Beuther et al. (2007) Beuther, H., Churchwell, E. B., McKee, C. F., & Tan, J. C. 2007, in Protostars and Planets V, ed. B. Reipurth, D. Jewitt, & K. Keil (Tucson, AZ: Univ. Arizona Press), 165
- Bonnell et al. (2003) Bonnell, I. A., Bate, M. R., & Vine, S. G. 2003, MNRAS, 343, 413
- Brooks et al. (2007) Brooks, K. J., Garay, G., Voronkov, M., & Rodríguez, L. F. 2007, ApJ, 669, 459
- Bunn et al. (1995) Bunn, J. C., Hoare, M. G., & Drew, J. E. 1995, MNRAS, 272, 346
- Carrasco-González et al. (2010) Carrasco-González, C., Rodríguez, L. F., Torrelles, J. M., Anglada, G., & González-Martín, O. 2010, AJ, 139, 2433
- Cesaroni et al. (1999) Cesaroni, R., Felli, M., Jenness, T., Neri, R., Olmi, L., Robberto, M., Testi, L., & Walmsley, C. M. 1999, A&A, 345, 949
- Cesaroni et al. (2005) Cesaroni, R., Neri, R., Olmi, L., Testi, L., Walmsley, C. M., & Hofner, P. 2005, A&A, 434, 1039
- Cyganowski et al. (2008) Cyganowski, C. J. et al. 2008, AJ, 136, 2391
- Davies et al. (2010) Davies, B., Lumsden, S. L., Hoare, M. G., Oudmaijer, R. D., & de Wit, W. 2010, MNRAS, 402, 1504
- de Wit et al. (2007) de Wit, W. J., Hoare, M. G., Oudmaijer, R. D., & Mottram, J. C. 2007, ApJ, 671, L169
- de Wit et al. (2010) de Wit, W. J., Hoare, M. G., Oudmaijer, R. D., & Lumsden, S. L. 2010, A&A, 515, 45
- Franco-Hernández et al. (2009) Franco-Hernández, R., Moran, J. M., Rodríguez, L. F., & Garay, G. 2009, ApJ, 701, 974
- Franco-Hernández & Rodríguez (2004) Franco-Hernández, R., & Rodríguez, L. F. 2004, ApJ, 604, L105
- Franco et al. (2000) Franco, J., Kurtz, S., Hofner, P., Testi, L., García-Segura, G., & Martos, M. 2000, ApJ, 542, L143
- Galván-Madrid et al. (2009) Galván-Madrid, R., Keto, E., Zhang, Q., Kurtz, S., Rodríguez, L. F., & Ho, P. T. P. 2009, ApJ, 706, 1036
- Galván-Madrid et al. (2008) Galván-Madrid, R., Rodríguez, L. F., Ho, P. T. P., & Keto, E. 2008, ApJ, 674, L33
- Gibb & Hoare (2007) Gibb, A. G., & Hoare, M. G. 2007, MNRAS, 380, 246
- Heitsch et al. (2008) Heitsch, F., Hartmann, L. W., Slyz, A. D., Devriendt, J. E. G., & Burkert, A. 2008, ApJ, 674, 316
- Ho et al. (2004) Ho, P. T. P., Moran, J. M., & Lo, K. Y. 2004, ApJ, 616, L1
- Hoare et al. (2007) Hoare, M. G., Kurtz, S. E., Lizano, S., Keto, E., & Hofner, P. 2007, in Protostars and Planets V, ed. B. Reipurth, D. Jewitt, & K. Keil (Tucson, AZ: Univ. Arizona Press), 181
- Hofner et al. (2007) Hofner, P., Cesaroni, R., Olmi, L., Rodríguez, L. F., Martí, J., & Araya, E. 2007, A&A, 465, 197
- Jaffe et al. (1982) Jaffe, D. T., Stier, M. T., & Fazio, G. G. 1982, ApJ, 252, 601
- Jappsen et al. (2005) Jappsen, A.-K., Klessen, R. S., Larson, R. B., Li, Y., & Mac Low, M.-M. 2005, A&A, 435, 611
- Jiménez-Serra et al. (2010) Jiménez-Serra, I., Caselli, P., Tan, J. C., Hernandez, A. K., Fontani, F., Butler, M. J., & van Loo, S. 2010, MNRAS, 406, 187
- Jiménez-Serra et al. (2009) Jiménez-Serra, I., Martín-Pintado, J., Caselli, P., Martín, S., Rodríguez-Franco, A., Chandler, C., & Winters, J. M. 2009, ApJ, 703, L157
- Keto (2003) Keto, E. 2003, ApJ, 599, 1196
- Keto & Wood (2006) Keto, E., & Wood, K. 2006, ApJ, 637, 850
- Keto et al. (2008) Keto, E., Zhang, Q., & Kurtz, S. 2008, ApJ, 672, 423
- Klaassen et al. (2009) Klaassen, P. D., Wilson, C. D., Keto, E. R., & Zhang, Q. 2009, ApJ, 703, 1308
- Kratter & Matzner (2009) Kratter, K. M., & Matzner, C. D. 2006, MNRAS, 373, 1563
- Krumholz et al. (2009) Krumholz, M. R., Klein, R. I., McKee, C. F., Offner, S. S. R., Cunningham, A. J. 2009, Science, 323, 754
- Kurtz et al. (2000) Kurtz, S., Cesaroni, R., Churchwell, E., Hofner, P., & Walmsley, C. M. 2000, Protostars and Planets IV, ed. V. Mannings, A. P. Boss, & S. S. Russell (Tucson, AZ: Univ. Arizona Press), 299
- Lovas (2004) Lovas, F.J., 2004, J. Phys. Chem. Ref. Data, 33, 177
- Müller et al. (2005) Müller, H. S. P., Schlöder, F., Stutzki, J., & Winnewisser, G. 2005, J. Mol. Struct., 742, 215
- Ossenkopf & Henning (1994) Ossenkopf, V., & Henning, T. 1994, A&A, 291, 943
- Patel et al. (2005) Patel, N., et al. 2005, Nature, 437, 109
- Peters et al. (2010) Peters, T., Banerjee, R., Klessen, R. S., Mac Low, M.-M., Galván-Madrid, R., & Keto, E. 2010, ApJ, 711, 101
- Qiu et al. (2009) Qiu, K., Zhang, Q., Wu, J., & Chen, H.-R. 2009, ApJ, 696, 66
- Remijan et al. (2004) Remijan, A., Sutton, E. C., Snyder, L. E., Friedel, D. N., Liu, S.-Y., & Pei, C.-C. 2004, ApJ, 606, 917
- Rengarajan & Ho (1996) Rengarajan, T. N., & Ho, P. T. P. 1996, ApJ, 465, 363
- Rodón et al. (2008) Rodón, J. A., Beuther, H., Megeath, S. T., & van der Tak, F. F. S. 2008, A&A, 490, 213
- Rodríguez et al. (2005) Rodríguez, L. F., Garay, G., Brooks, K. J., & Mardones, D. 2005, ApJ, 626, 953
- Rodríguez et al. (2008) Rodríguez, L. F., Moran, J. M., Franco-Hernández, R., Garay, G., Brooks, K. J., & Mardones, D. 2008, AJ, 135, 2370
- Rosolowsky et al. (2008) Rosolowsky, E. W., Pineda, J. E., Foster, J. B., Borkin, M. A., Kauffmann, J., Caselli, P., Myers, P. C., & Goodman, A. A. 2008, ApJS, 175, 509
- Shepherd et al. (2001) Shepherd, D. S., Claussen, M. J., & Kurtz, S. 2001, Science, 292, 1513
- Smith et al. (2009) Smith, R. J., Longmore, S., & Bonnell, I. 2009, MNRAS, 400, 1775
- Springel et al. (2001) Springel, V., Yoshida, N., & White, S. D. M. 2001, New Astronomy, 6, 79
- Stier et al. (1984) Stier, M. T., Jaffe, D. T., Rengarajan, T. N., Fazio, G. G., Maxson, C. W., McBreen, B., Loughran, L., Serio, S., & Sciortino, S. 1984, ApJ, 283, 573
- Vázquez-Semadeni et al. (2007) Vázquez-Semadeni, E., Gómez, G. C., Jappsen, A. K., Ballesteros-Paredes, J., González, R. F., & Klessen, R. S. 2007, ApJ, 657, 870
- Vázquez-Semadeni et al. (2009) Vázquez-Semadeni, E., Gómez, G. C., Jappsen, A. K., Ballesteros-Paredes, J., & Klessen, R. S. 2009, ApJ, 707, 1023
- van der Tak & Menten (2005) van der Tak, F. F. S., & Menten, K. M. 2005, A&A, 437, 947
- van der Tak et al. (2005) van der Tak, F. F. S., Tuthill, P. G., & Danchi, W. C. 2005, A&A, 431, 993
- van der Tak et al. (2000) van der Tak, F. F. S., van Dishoeck, E. F., Evans, N. J. II, & Blake, G. A. 2000, ApJ, 537, 283
- Westerhout (1958) Westerhout, G. 1958, Bulletin of the Astronomical Institutes of the Netherlands, 14, 215
- Williams et al. (2009) Williams, J. P., Mann, R. K., Beaumont, C. N., Swift, J. J., Adams, J. D., Hora, J., Kassis, M., Lada, E. A., & Román-Zúñiga, C. G. 2009, ApJ, 699, 1300
- Wilner et al. (1994) Wilner, D. J., Wright, M. C. H., & Plambeck, R. L. 1994, ApJ, 422, 642
- Wu & Evans (2003) Wu, J., & Evans, N. J., II 2003, ApJ, 592, L79
- Zapata et al. (2009) Zapata, L. A., Ho, P. T. P., Schilke, P., Rodríguez, L. F., Menten, K., Palau, A., Garrod, R. T. 2009, ApJ, 698, 1422
- Zapata et al. (2008) Zapata, L. A., Palau, A., Ho, P. T. P., Schilke, P., Garrod, R. T., Rodríguez, L. F., & Menten, K. 2008, A&A, 479 L25
- Zhang et al. (2007) Zhang, Q., Hunter, T. R., Beuther, H., Sridharan, T. K., Liu, S.-Y., Su, Y.-N., Chen, H.-R., & Chen, Y. 2007, ApJ, 658, 1152
- Zhang et al. (1998) Zhang, Q., Hunter, T. R., & Sridharan, T. K. 1998, ApJ, 505, L151
- Zhang et al. (2009) Zhang, Q., Wang, Y., Pillai, T., & Rathborne, J. 2009, ApJ, 696, 268
- Zinnecker & Yorke (2007) Zinnecker, H., & Yorke, H. W. 2007, ARA&A, 45, 481
| Epoch | Array | Phase CenteraaUnits of R.A. are hours, minutes, and seconds. Units of decl. are degrees, arcminutes, and arcseconds. | Bandpass | Flux | Phase | |
|---|---|---|---|---|---|---|
| (J2000) | (J2000) | Calibrator | Calibrator | Calibrator | ||
| 2004 06 14+15 | VLA-D | 18 14 39.500 | 51 59.800 | 3C273 | 3C286 | |
| 2006 05 22 | SMA-Extended | 18 14 39.509 | 51 59.999 | 3C273 | Callisto | |
| 2007 07 17 | SMA-Compact | 18 14 39.495 | 51 59.800 | 3C454.3 | Callisto | |
| 2008 08 02 | SMA-VEX | 18 14 39.495 | 51 59.800 | 3C454.3 | Callisto | |
| CoreaaMain core as labeled in Fig. 1, left panel. | ComponentbbClearly distinct subcomponents of the main cores as marked in Fig. 1. | (J2000)ccPosition of peak. | (J2000)ccPosition of peak. | (1.3 mm)ddPeak intensity . HPBW . | (1.3 mm)eeAdded flux of the subcomponents of each core. The uncertainties in the fluxes of MM1 and MM2 are mJy and mJy respectively. |
|---|---|---|---|---|---|
| (hrs,min,sec) | (deg,arcmin,arcsec) | () | (mJy) | ||
| MM1-NW | 18 14 39.47 | 51 59.7 | 31 | 357 | |
| MM1 | MM1-Main | 18 14 39.51 | 52 00.0 | 65 | 357 |
| MM1-SE | 18 14 39.55 | 52 00.4 | 25 | 357 | |
| MM2 | MM2-Main | 18 14 39.24 | 52 01.9 | 43 | 289 |
| MM2-NE | 18 14 39.31 | 52 00.6 | 22 | 289 |
| Species | Transition | ||
|---|---|---|---|
| (GHz) | (K) | ||
| C18O | 2–1 | 219.5603 | 15.8 |
| HNCO | 10(2,9)–9(2,8) | 219.7338 | 228.4 |
| – | 10(2,8)–9(2,7) | 219.7371 | 228.2 |
| – | 10(0,10)–9(0,9) | 219.7982 | 58.0 |
| H213CO | 3(1,2)–2(1,1) | 219.9084 | 32.9 |
| SO | 6(5)–5(4) | 219.9494 | 34.9 |
| CH3OH | 8(0,8)–7(1,6) | 220.0784 | 96.6 |
| 13CO | 2–1 | 220.3986 | 15.86 |
| CH3CN | 12(8)-11(8) | 220.4758 | 525.5 |
| – | 12(7)-11(7) | 220.5393 | 418.6 |
| HNCO | 10(1,9)–9(1,8) | 220.5847 | 101.5 |
| CH3CN | 12(6)-11(6) | 220.5944 | 325.8 |
| – | 12(5)-11(5) | 230.6410 | 247.3 |
| – | 12(4)-11(4) | 220.6792 | 183.1 |
| – | 12(3)-11(3) | 220.7090 | 133.1 |
| – | 12(2)-11(2) | 220.7302 | 97.4 |
| – | 12(1)-11(1) | 220.7430 | 76.0 |
| – | 12(0)-11(0) | 220.7472 | 68.8 |
| CH3OH | 15(4,11)–16(3,13) | 229.5890 | 374.4 |
| – | 8(-1,8)–7(0,7) | 229.7588 | 89.1 |
| – | 3(-2,2)–4(-1,4) | 230.0270 | 39.8 |
| 12CO | 2–1 | 230.5380 | 16.5 |
| OCS | 19–18 | 231.0609 | 110.8 |
| 13CS | 5–4 | 231.2207 | 26.6 |
| CH3OH | 10(2,9)–9(3,6) | 231.2811 | 165.3 |
.