Deep GALEX Observations of the Coma Cluster: Source Catalog and Galaxy Counts
Abstract
We present a source catalog from deep 26 ks GALEX observations of the Coma cluster in the far-UV (FUV; 1530 Å) and near-UV (NUV; 2310 Å) wavebands. The observed field is centered 0.9∘ (1.6 Mpc) south-west of the Coma core, and has full optical photometric coverage by SDSS and spectroscopic coverage to 21. The catalog consists of 9700 galaxies with GALEX and SDSS photometry, including 242 spectroscopically-confirmed Coma member galaxies that range from giant spirals and elliptical galaxies to dwarf irregular and early-type galaxies. The full multi-wavelength catalog (cluster plus background galaxies) is 80% complete to NUV=23 and FUV=23.5, and has a limiting depth at NUV=24.5 and FUV=25.0 which corresponds to a star formation rate of 10-3 yr-1 at the distance of Coma. The GALEX images presented here are very deep and include detections of many resolved cluster members superposed on a dense field of unresolved background galaxies. This required a two-fold approach to generating a source catalog: we used a Bayesian deblending algorithm to measure faint and compact sources (using SDSS coordinates as a position prior), and used the GALEX pipeline catalog for bright and/or extended objects. We performed simulations to assess the importance of systematic effects (e.g. object blends, source confusion, Eddington Bias) that influence source detection and photometry when using both methods. The Bayesian deblending method roughly doubles the number of source detections and provides reliable photometry to a few magnitudes deeper than the GALEX pipeline catalog. This method is also free from source confusion over the UV magnitude range studied here; conversely, we estimate that the GALEX pipeline catalogs are confusion limited at 23 and 24. We have measured the total UV galaxy counts using our catalog and report a 50% excess of counts across =22-23.5 and =21.5-23 relative to previous GALEX measurements, which is not attributed to cluster member galaxies. Our galaxy counts are a better match to deeper UV counts measured with HST.
Subject headings:
galaxies: clusters: individual (Coma) - galaxies: statistics - catalogs - techniques: photometric - ultraviolet: galaxies1. Introduction
The broadband ultraviolet (UV; 1000-3000 Å) emission from galaxies is a unique age-dating tool because it traces stellar populations at both very early and very late phases of evolution for different galaxy types. The far-UV (FUV; 1000-2000 Å) and near-UV (NUV; 2000-3000 Å) emission from normal star-forming galaxies is typically produced by short-lived intermediate-mass stars on the main sequence (t1 Gyr; 25 ), which provides a direct measure of the star formation rate (Kennicutt, 1998). In contrast, the FUV emission from quiescent galaxies is associated with low-mass He-burning stars that evolve through the horizontal branch (0.5 ; Greggio & Renzini, 1990; Dorman et al., 1995; Park & Lee, 1997); these stars produce an upturn in the galaxy spectrum shortward of 2000 Å (e.g. UV-excess (UVX) or UV-upturn galaxies; Code, 1969; Brown et al., 1995; O’Connell, 1999). The NUV emission from quiescent galaxies is typically dominated by the hottest main-sequence turnoff stars and subgiants (e.g. Dorman et al., 2003).
The Coma cluster, Abell 1656, is one of the nearest (0.023) examples of a rich galaxy cluster (Abell Class 2 - Bautz & Morgan Type II cluster; Abell et al., 1989; Bautz & Morgan, 1970) and is among the best studied local galaxy clusters due to its accessibility at high Galactic latitude (88∘). UV observations of the Coma cluster have been relatively rare as compared to optical wavelengths owing to the need for space-based facilities to avoid atmospheric absorption, the inability of early UV instruments to obtain both deep and wide-field coverage of nearby clusters, and unfortunate instrument failures during previous observing campaigns (e.g. FAUST during the Astro-1 shuttle mission, and the UIT NUV camera during Astro-2). The balloon-borne FOCA instrument (2000 Å) performed the best previous UV imaging surveys with sufficient sensitivity, angular resolution (20), and field of view (circular FOV of 2∘ diameter) to detect a statistically significant sample of galaxies in local clusters (Milliard et al., 1991). FOCA performed a 3 ks observation at the center of the Coma cluster (Donas et al., 1991) that detected optically-bright early-type galaxies in the cluster (-19), and fainter star forming galaxies (-16; SFR 0.05 yr-1 following Kennicutt, 1998). This observation resulted in the first ever UV luminosity function (LF) measured for a galaxy cluster (Andreon, 1999; Cortese et al., 2003a, b).
Launched in 2003, the Galaxy Evolution Explorer (GALEX; Martin et al., 2005) significantly improved the capability for performing UV surveys due to its relatively high sensitivity, good spatial resolution (5 FWHM), and large circular FOV (1.25∘ diameter). GALEX has observed several local galaxy clusters thus far, from both its Guest Investigator program (e.g. NFPS clusters; Rawle et al., 2008) and also via its imaging survey mode. For example, GALEX All-Sky Imaging Survey observations with 0.1 ks exposures detected a large sample of dwarf early-type galaxies in the nearby (20 Mpc) Virgo cluster (Boselli et al., 2005). GALEX has also performed moderate-depth (1.3-3.5 ks) observations of the Abell 1367 and Coma clusters both located at 100 Mpc. Specifically, GALEX observed a single field just north of center for A1367, while Coma has extensive wide-field coverage that consists of 11 GALEX fields that span from the periphery of the core to the cluster virial radius and cover 27 Mpc2. Both sets of observations allowed for the detection of dwarf star forming galaxies (SFR0.02 yr-1) and intermediate-mass early-type galaxies (M∗1010 ), and resulted in the deepest UV LFs that have been measured for local galaxy clusters thus far (MUV-14; Cortese et al., 2005, 2008).
We have obtained a deep 30 ks GALEX observation of an off-center region of the Coma cluster (‘Coma-3’), which compliments the existing wide-field coverage with GALEX. These data are 95% complete to mUV24.5 in the GALEX FUV and NUV filters (3 magnitudes deeper than the wide-field GALEX coverage), which corresponds to a star formation rate of SFR10-3 yr-1 for galaxies at the distance of Coma. The depth of our observation also allows for the detection of quiescent dwarf early-type (dE) galaxies that were too faint to be detected in previous UV surveys of the Coma cluster.
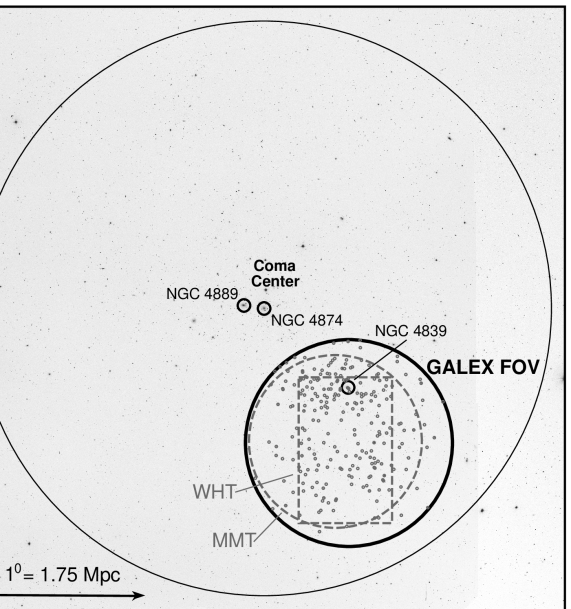
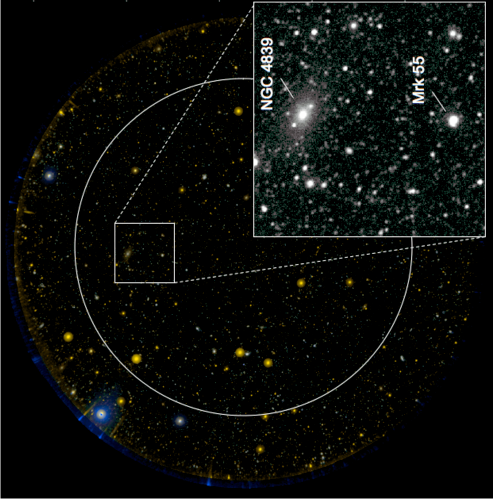
The ‘Coma-3’ field (Komiyama et al., 2002) is located 1∘ (1.75 Mpc) south-west of the cluster center. This location has been the subject of several studies since the discovery of a secondary peak in the cluster X-ray emission located at the northern edge of the Coma-3 field (White et al., 1993). The X-ray emission is associated with the infalling NGC 4839 galaxy group (e.g. Colless & Dunn, 1996; Neumann et al., 2001; Briel et al., 2001), and has been linked to a population of young/post-starburst galaxies that may trace the X-ray substructure (e.g. Caldwell et al., 1993; Caldwell & Rose, 1998; Poggianti et al., 2004; Smith et al., 2009). This field has extensive panchromatic coverage from X-ray to radio wavelengths (a complete review is presented in Miller et al., 2009), including broadband optical and spectroscopic coverage by the Sloan Digital Sky Survey (SDSS; Adelman-McCarthy et al., 2008), and deeper optical spectroscopic observations with the William Herschel Telescope and MMT Hectospec that provide redshift coverage to 21 (R. Marzke et al. 2010, in prep; Mobasher et al., 2001).
This paper describes our deep GALEX observation in the Coma cluster with full optical coverage by the SDSS (§2). A galaxy catalog is constructed by taking UV measurements from both the GALEX pipeline catalog and also using a Bayesian deblending technique to measure the UV-faint population, and we use simulations to determine the detection and photometry limits for both methods (§3). The catalog is used to measure the UV galaxy counts and to estimate the GALEX source confusion limits (§4). The source catalog will be used in a companion paper to measure a deep UV LF for the Coma cluster and to study the stellar populations of Coma members. We assume Coma is located at a distance of 100 Mpc, which corresponds to a distance modulus of DM35.0 () for H0 km s-1Mpc-1, =0.73, and =0.27.
2. Data
2.1. GALEX Data
GALEX images the sky simultaneously in two broadband filters centered at 1539Å (FUV) and 2316Å (NUV). The GALEX pipeline produces images with a circular field of view of 1.25∘ diameter. However, we only consider sources located within the inner 0.6∘ GALEX FOV to avoid artifacts (bright star glints) that affect the NUV band at locations further from the image center. The GALEX plate scale is 1.5 pixel-1 which adequately samples the 4.5-7 PSF (FWHM). We refer the reader to Martin et al. (2005) and Morrissey et al. (2005, 2007) for a more detailed description of the GALEX instrumentation and calibration.
We were awarded a deep 30 ks GALEX observation of the Coma cluster as part of the Cycle-II Guest Investigator program (P.I. Hornschemeier). This field has an integrated exposure time similar to the Deep Imaging Survey (DIS), which are some of the deepest observations taken by the GALEX mission. The observing sequence for our GALEX field consists of 35 individual exposures with durations that range between 100-1700 seconds. The analysis presented in this study was performed on 26 ks images in both GALEX bands, which were the deepest images available when this study was initiated. The GALEX field is centered at R.A.=194∘.34167 and Dec.=27∘.17722 (J2000), which is located 0.9∘ (1.6 Mpc) south-west of the Coma center in a region of the cluster known as ‘Coma-3’ (Komiyama et al., 2002). The entire GALEX field is located inside the virial radius of the Coma cluster as shown in Figure 1 (rvir=2.9 Mpc; Łokas & Mamon, 2003).
Object detection and photometry is not trivial for deep GALEX images. The GALEX pipeline provides source catalogs using the SExtractor software (Bertin & Arnouts, 1996). However, the high source density in deep images and the relatively large GALEX PSF result in a non-negligible fraction of object blends in the pipeline catalogs, i.e. two or more objects in close proximity on the sky are considered a single source. The GALEX pipeline catalogs are also limited at faint magnitudes by source confusion. Xu et al. (2005) estimated that source confusion leads to systematic detection and photometric biases for objects fainter than 24 and 25.3. In fact, we will argue in §4.2 that the GALEX pipeline catalogs are confusion limited at brighter magnitudes than reported in Xu et al. (2005).
Morrissey et al. (2007) suggest that alternative methods of object detection and photometry are required to separate sources in deep GALEX images and to avoid the effects of source confusion. For instance, Zamojski et al. (2007) applied a Bayesian deblending method to GALEX DIS images of the COSMOS field (z0.7). The authors measured the UV flux by fitting a PSF profile to sources that were identified in high-resolution optical images (the optical coordinates are used as a position prior). Although a point source approximation is reasonable for the faint field galaxy population observed by GALEX, it does not describe the foreground cluster members that are resolved (or at least marginally resolved) in the Coma field studied here. We adopt a hybrid of these methods, using SExtractor to measure bright extended sources and Bayesian deblending for the unresolved population (using SDSS coordinates as a position prior). A description of these two methods and a demonstration of their reliable limits are presented in §3.
We measured a systematic offset in the GALEX image coordinates relative to SDSS after comparing the positions of 200 stars detected in both imaging datasets. The GALEX coordinates are offset to the north-east of SDSS (on average) by 0.4 and 0.6 in R.A. and Dec., respectively. We use the corrected GALEX coordinates (i.e. shifted to match the SDSS system) in this study. The GALEX magnitudes presented hereafter have been corrected for foreground Galactic extinction using the Schlegel et al. (1998) reddening maps and the ratio of extinction to reddening reported in Wyder et al. (2007, fuv/E(BV)=8.24, nuv/E(BV)8.20). Coma is located at high Galactic latitude (), resulting in typical Galactic extinction values of only 0.08 mag in both GALEX filters.
2.2. Optical Data
The Sloan Digital Sky Survey (SDSS; York et al., 2000) has observed the entire Coma cluster in the broadband ugriz filters with a median seeing condition of 1.4 in the -band. The data we use are taken from the SDSS DR6666SDSS photometry for the Coma cluster have been reprocessed as part of DR7. A comparison of DR6 and DR7 sources in the same Coma field studied here reveal only a negligible difference in their magnitudes and source positions. which is 95% complete to =22.2 (Adelman-McCarthy et al., 2008). We use PETROMAG photometry to estimate the total flux of galaxies, and MODELMAG measurements for optical color analysis. Magnitudes were corrected for Galactic reddening using the extinction values available in the SDSS PhotoObj tables. We also applied a small magnitude correction to match the AB system (-0.036, 0.012, 0.010, 0.028, and 0.040 for the ugriz filters, respectively), and imposed a minimum photometry error for all SDSS magnitudes (m=0.05,0.02,0.02,0.02,0.03 for the filters, respectively; Blanton & Roweis, 2007). We do not include SDSS sources fainter than =24 as we found 40% of these objects are spurious detections. This was determined by comparing SDSS detections to optical data with much higher spatial resolution and greater depth from HST-ACS imaging of the Coma cluster (see Appendix A for details; Carter et al., 2008).
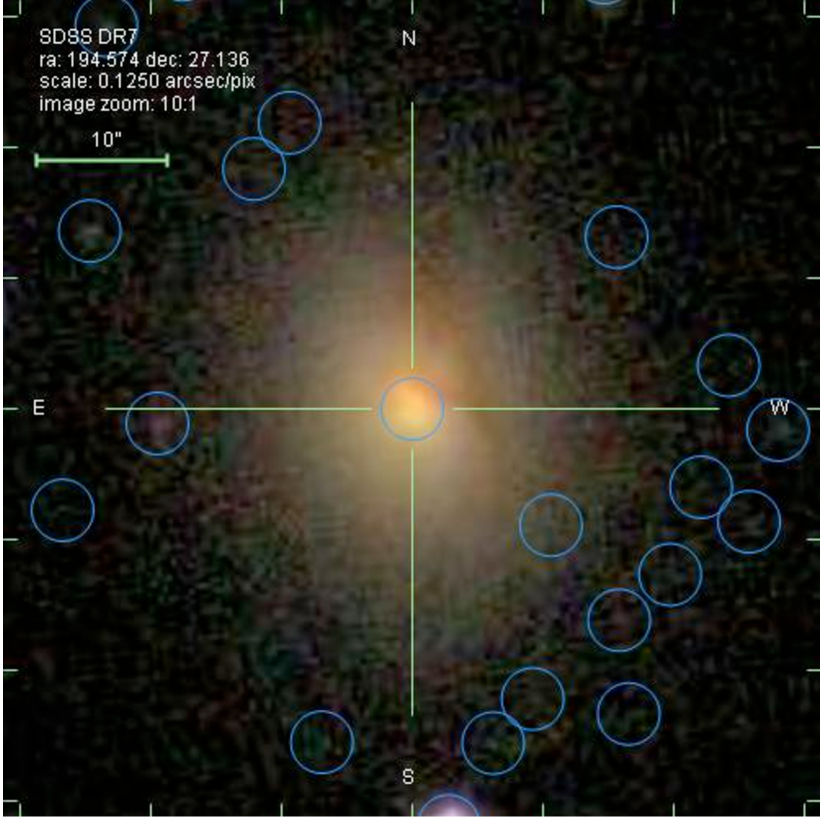
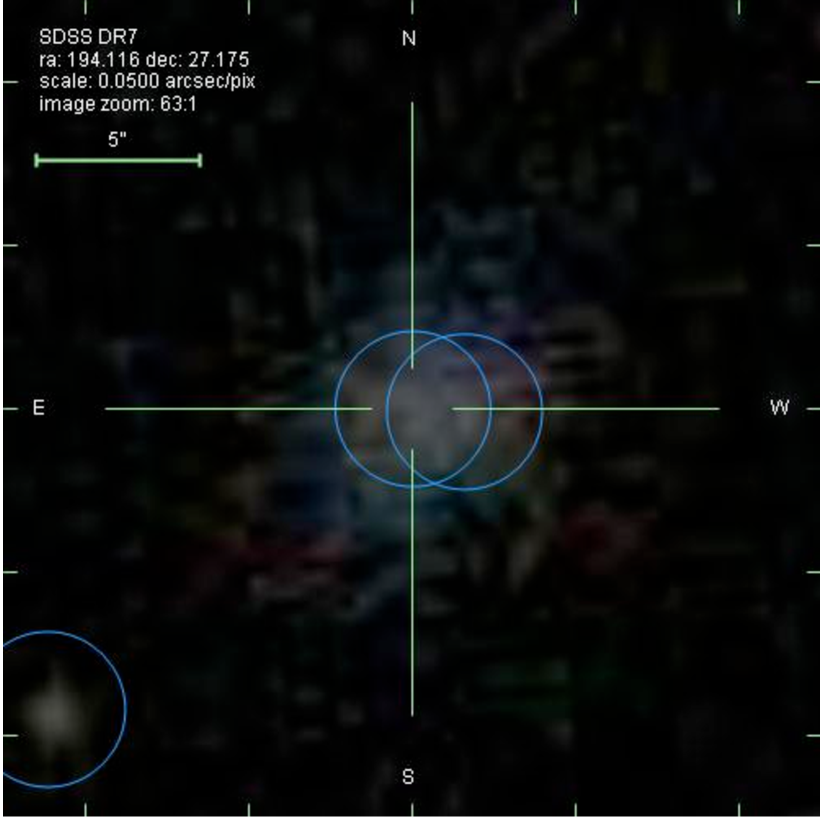
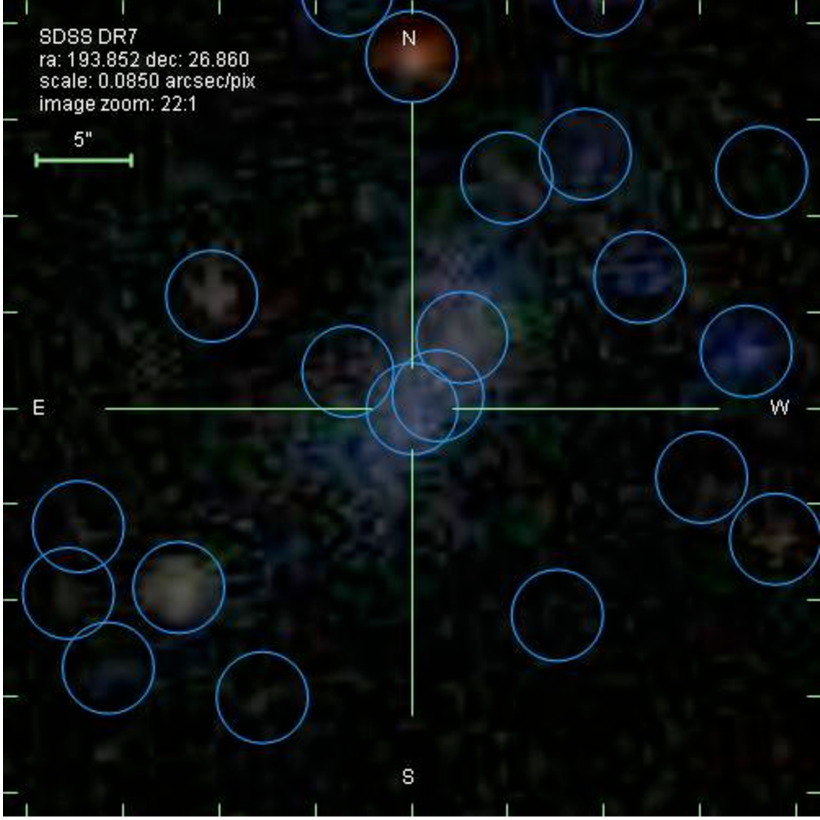
We rely on the SDSS DR6 to identify objects in the GALEX pipeline catalog and for producing accurate position priors for the Bayesian deblending analysis. Therefore it is essential to limit the number of false sources in the SDSS catalog. False sources in the SDSS catalog typically result from ‘shredding’ of bright galaxies, i.e. a single galaxy is detected as two or more separate objects (Abazajian et al., 2004). In order to identify false sources, we have visually inspected SDSS detections brighter than =22.5 that are matched to the GALEX pipeline catalog (4000 galaxies); there are 27000 SDSS sources in our field thus we limited our inspection to galaxies that are likely to have a UV counterpart. We removed 181 sources from the DR6 catalog that have characteristics typical of shredding (e.g. no clear separation from the parent galaxy, unphysical colors, magnitudes that are significantly brighter than expected based on visual inspection), and added the flux to the parent galaxy in the SDSS DR6 catalog. Note that a relatively high fraction of shredded sources are associated with Coma member galaxies, particularly for low surface brightness (LSB) galaxies and also within the halos of bright early-type galaxies. In Figure 2 we provide typical examples of Coma member galaxies that were shredded into several sources. We have also removed 19 SDSS objects that were classified as galaxies but we identified as diffraction spikes due to bright stars.
We must rely on the star/galaxy (S/G) classification from SDSS DR6 (i.e. the ‘type’ parameter) to identify galaxies as GALEX lacks the spatial resolution to perform this task. The HST-ACS data in the Coma cluster allows us to test the accuracy of the SDSS S/G classification (Appendix B). We found that objects classified as galaxies by SDSS are 90% accurate at magnitudes brighter than =24.0. However, over one-half of all objects classified as stars by SDSS with 21 are actually galaxies. Therefore, we use a SDSS catalog that consists of objects with 21 that are identified as galaxies in SDSS DR6, and all objects fainter than =21 (regardless of their SDSS S/G classification) to avoid excluding many real galaxies at faint magnitudes. The final SDSS catalog consists of 26558 (18431) objects with 24.0 that are located within 0.6∘ (0.5∘) from the center of the GALEX field.
3. Properties of the UV Catalogs
In this section we describe the UV source catalogs used in this study, and use simulations to establish their source detection and photometry limits. We use two separate methods of UV source detection and photometry. We take UV flux measurements from the GALEX pipeline catalogs for bright and/or extended sources that are located within the inner 0.6∘ GALEX FOV. We use a Bayesian deblending method (e.g. Guillaume et al., 2006) to measure faint, unresolved objects located within 0.5∘ from the center of the GALEX field.
3.1. Bayesian Deblending Catalog
In their GALEX calibration paper, Morrissey et al. (2007) suggested that source detection and photometry for deep GALEX images may be significantly improved by PSF-fitting the UV flux for objects detected in higher-resolution optical imaging. We have applied this technique (referred to as ‘Bayesian deblending’ throughout this paper) to our deep GALEX image. Performing source detection in the high-resolution optical image allows us to: (a) separate objects in close proximity on the sky that would otherwise be blended into a single source, and (b) avoid systematic effects that influence source detection and photometry at faint magnitudes (e.g. source confusion; Hogg, 2001). This method is somewhat akin to performing SExtractor dual-image color photometry (i.e. UV flux is measured inside apertures defined in the optical image), however, SExtractor was not designed to separate objects in crowded images. Bayesian deblending allows for crowded-field photometry by exploiting the known location of objects from higher resolution optical images, the measured GALEX PSF, and the fact that most sources are unresolved in GALEX images.
We have created a UV source catalog using custom software (developed by GALEX team members and led by co-authors S.A. and B.M.) that is based on the Bayesian deblending technique described in Guillaume et al. (2006), which was designed specifically to measure faint compact objects in crowded GALEX images. This software has been used in several studies with deep GALEX imaging (e.g. Zamojski et al., 2007; Salim et al., 2009; Ilbert et al., 2009), and a brief description and demonstration is also provided at the GALEX GI website777www.galex.caltech.edu/researcher/techdoc-ch5a.html. To summarize, the method constructs a parametric model for the UV image that consists of both a source flux and background component. The source flux is modeled by taking the optical coordinates and flux values from our SDSS catalog as a starting reference (i.e. a prior), and then assumes the corresponding UV light distribution follows the GALEX PSF. The background is measured following the same technique used for the GALEX pipeline (Morrissey et al., 2007). The UV flux for each object is fit by solving the likelihood of the parametric equation using an expectation-maximisation (EM) technique. Photometry is reliable for galaxies with apparent sizes smaller than 10 (i.e. 2FWHM). For more extended galaxies, the flux will be underestimated due to a UV light profile that is much broader than the PSF. We therefore rely on the GALEX pipeline catalog (§3.2) for extended galaxies.
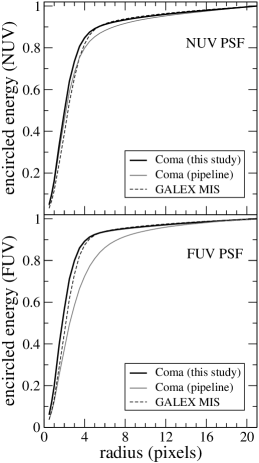
Bayesian deblending requires an accurate PSF model for both GALEX filters. As such, we have restricted the our analysis to the inner 0.5∘ GALEX FOV to avoid regions where the PSF is difficult to model owing to its asymmetry (Morrissey et al., 2007). This is a conservative cutoff since the GALEX PSF tends to be more symmetric for images that are constructed by stacking observations taken at many roll angles (which is the case for our GALEX image). We have measured the PSF for both GALEX filters by stacking isolated stars that are brighter than ==18 and located within 0.5∘ of the image center. We measured a 4.8 and 5.3 FWHM for the FUV and NUV filters, respectively. The encircled energy curves of the GALEX PSFs are shown in Figure 3. The full width at half-energy is 5.5 for the FUV filter and 6.0 for the NUV filter, which are similar to the average PSFs measured for fields in the GALEX Medium Imaging Survey (MIS)888Available from the GALEX Guest Investigator website http://www.galex.caltech.edu/researcher/techdoc-ch5.html#2..
We have modeled the UV flux for all objects in our SDSS catalog that are located within the inner 0.5∘ GALEX FOV. UV fluxes were measured for 92% of the SDSS objects (16874/18431), of which approximately one-half are brighter than our chosen magnitude limits of =24.5 and =25.0 (magnitude limits are described in §3.3-3.4). We visually confirmed that the majority of the unmeasured SDSS objects are too UV-faint to be detected in our GALEX images. The EM algorithm, however, failed to converge on a flux solution for 381 objects with identifiable UV emission for which we have taken the measurements from the GALEX pipeline catalog; the failure occurred for several reasons, such as close proximity to a bright object or local gradients in the background level. Note that the Bayesian deblending method is prone to assigning non-zero flux to optical priors that lack UV emission, particularly for priors located within the light distribution of bright extended galaxies or saturated stars. We have estimated the fraction of such ‘spurious’ detections by adding to the SDSS object list 4000 false priors that were randomly distributed across the inner 0.5∘ GALEX FOV. Only 1% (2%) of the false priors were assigned fluxes that are brighter than our magnitude limit of =25.0 (=24.5). Spurious UV detections are thus only a negligible fraction of the sources in the Bayesian deblending catalog.
We have also tested the sensitivity of the Bayesian deblending analysis to slight changes in the PSF profile, and also for small offsets between the GALEX and SDSS coordinates, i.e. we re-measured sources using the PSF given for the GALEX MIS survey, and also after shifting the GALEX and SDSS coordinates by in each coordinate. We conclude that the Bayesian deblending algorithm is not critically sensitive to these parameters after finding only a negligible change to the number of source detections and their flux measurements.
3.2. GALEX Pipeline Catalog
The GALEX pipeline generates source catalogs using a slightly modified version of the SExtractor software, which is adjusted to provide a more accurate estimate of the UV background (Morrissey et al., 2007). The advantages of the GALEX pipeline catalog, as compared to the Bayesian deblending catalog, are that (a) it provides coverage across a larger area of the GALEX image (the inner 0.6∘ GALEX FOV versus the inner 0.5∘), and (b) its photometry is relatively insensitive to the apparent sizes of galaxies, whereas the Bayesian deblending catalog underestimates the flux for extended galaxies. We use the term ‘extended’ throughout this paper to refer to galaxies with an optical 90% light diameter larger than 10 in the SDSS -band. The primary drawback of the GALEX pipeline catalog is that it is relatively incomplete at magnitudes fainter than ()=21.0 (described in §3.3).
As such, we rely on the GALEX pipeline catalog for galaxies that are brighter than ()=21.0 and/or are extended galaxies. We use the SExtractor MAG_AUTO magnitudes which are measured using elliptical Kron apertures (Kron, 1980) and reported in the AB system. FUV and NUV Kron magnitudes were taken from the ‘merged’ GALEX pipeline catalog in which source detection and aperture definition are determined separately for each filter. Note that we have visually inspected sources that meet our extended size criteria but were flagged in the SDSS DR6 as having unreliable measurements of the Petrosian light diameter (NOPETRO); we identified 125 objects that are obviously smaller than 10 for which we have taken measurements from the Bayesian deblending catalog.
Our bright/extended sample was assembled by matching the GALEX pipeline and SDSS catalogs using a standard 4 matching radius (Budavári et al., 2009), and selecting 479 galaxies that match our criteria. We have added another eight galaxies that were missed by the pipeline due to object blends. Coma member galaxies are the majority population (57%) for the subset of these galaxies with spectroscopic redshifts (365/487). We also include photometry from the pipeline catalog for the 381 galaxies that were missed by the Bayesian deblending analysis. We performed a visual inspection of these objects to verify the accuracy of the GALEX pipeline apertures. Custom photometry was required for 15% of this sample owing primarily to object blends in the pipeline apertures. The final bright/extended sample consists of 868 galaxies located within the inner 0.6∘ GALEX FOV.
3.3. Completeness Limits of the UV Catalogs
Simulations were performed to assess the completeness of the Bayesian deblending and GALEX pipeline catalogs. Point sources are a good approximation for the majority of galaxies in our GALEX image as 82% of galaxies in the SDSS catalog have optical half-light radii that are smaller than a GALEX pixel (1.5). A total of 4000 artificial point sources were randomly distributed across the GALEX NUV and FUV pipeline images, divided into six smaller simulations to maintain a source density that is representative of the original image. Point sources were convolved with the GALEX PSF and random (Poisson) photon noise was added to simulate real objects.
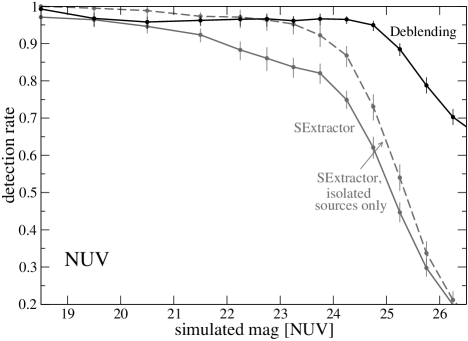
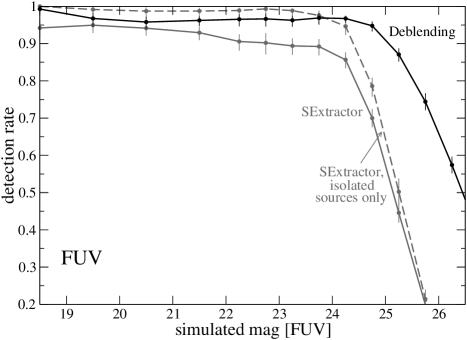
The source detection rates for the simulated point sources are presented in Figure 4. The Bayesian deblending algorithm recovered 95% of the simulated sources to muv24.5 in each waveband. The detection rates using SExtractor are also shown in Figure 4, which was run in the same configuration as the GALEX pipeline. SExtractor detection rates are similar to Bayesian deblending for sources brighter than muv=21 in both GALEX bands. At fainter magnitudes, SExtractor gives relatively lower detection rates due to object blends and source confusion (discussed in §3.4). We note that previous studies with deep GALEX imaging have used alternative SExtractor parameters in order to improve source detection for faint objects (e.g. Arnouts et al., 2005; Xu et al., 2005). We have tested the SExtractor detection rates for the configuration used in Xu et al. (2005, available from the online version of their Table 1), and found only a marginal difference with the detection rates for the GALEX pipeline shown in Figure 4. Thus we conclude that the Bayesian deblending method presents advantages over SExtractor even with these proposed improvements to the SExtractor parameters.
As such, we rely on the Bayesian deblending catalog for sources fainter than muv=21 in both bands, and use the GALEX pipeline catalog for brighter galaxies. The UV detection efficiency for our final source catalog is higher than the rates shown in Figure 4, as we have manually added objects that were missed by both detection methods (8 and 381 galaxies were added to the bright pipeline sample and the faint Bayesian deblending sample, respectively). The added detections are roughly one-half of the expected missing sources. We therefore assume the UV detection efficiency is midway between 100% completeness and the rates shown in Figure 4, with upper/lower error limits that span this range.
3.4. Photometry Limits of the UV Catalogs
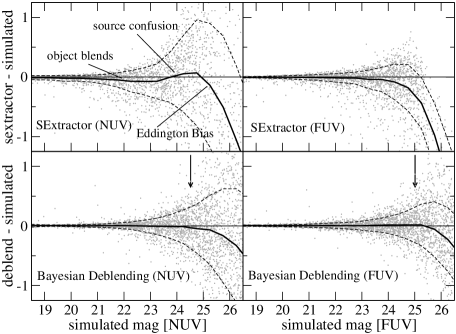
Next we evaluated the photometric accuracy of both the GALEX pipeline and Bayesian deblending catalogs. In Figure 5 we compare the artificial magnitudes of the simulated point sources to the magnitudes that were measured using both photometry methods. In each panel we show the average offset and the 1 rms scatter between the simulated and measured magnitudes. For simulated objects brighter than 21 (=23), both methods of photometry recover the simulated magnitudes to within 0.1 mag. At fainter magnitudes, Bayesian deblending is less affected by systematic errors as compared to SExtractor, and recovers the simulated magnitudes with good accuracy to =24.5 and =25.0 (i.e. the average offset is nearly zero at these limits with a 1 rms error = 0.3 mag). Interestingly, the average magnitude offset for the pipeline does not deviate far from zero at similar faint magnitude limits, thus it is still useful for statistical studies (provided incompleteness is properly addressed) but unreliable for studies of individual galaxies. We have identified four systematic errors that influence flux measurements in GALEX images whose importance varies among both methods of photometry and the two GALEX filters:
-
Object Blends
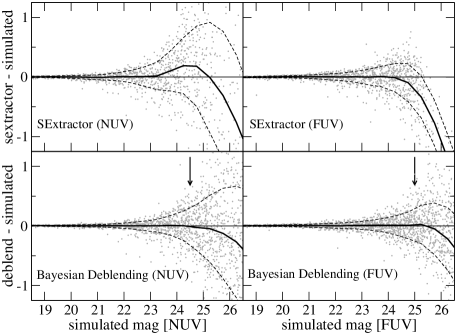
Object blends result from the inability to separate two or more objects that are in chance alignment on the sky. Based on the average offset line shown in the top-left panel of Figure 5, SExtractor NUV magnitudes are 0.05-0.15 mag too bright for sources between 21.023.0, respectively, due to object blends. The average magnitude offset will likely grow at fainter magnitudes but another systematic effect (source confusion) is dominant at 23.0. The influence that object blends have on SExtractor photometry is clear by comparing the average offsets for Figures 5 and 6, as the latter diagram shows the same magnitude comparison but for isolated sources. The SExtractor FUV photometry is less affected by object blends owing to fewer galaxy detections as compared to the NUV band (resulting from a lower survey volume due to FUV dropouts), and a smaller PSF for the FUV filter. The Bayesian deblending method is relatively less affected by object blends in either band owing to prior knowledge of the source coordinates.
-
Source Confusion
Objects fainter than the confusion limit typically have underestimated flux measurements and large scatter due to the ‘sea of unresolved sources’ at fainter magnitudes that modulate the background level (Hogg, 2001). The confusion limit is a function of the number density of sources and the instrumental resolution, such that images with a relatively steep Log N/Log S source distribution and/or poor resolution have a brighter confusion limit. Our simulations indicate that source confusion affects only the SExtractor NUV photometry for our GALEX image. This is visible in the top-left panel of Figure 5 (also in Figure 6), where the magnitudes are underestimated across a bump feature on the average offset line between 2324.5. The average offset will likely increase at fainter magnitudes but another systematic effect (the Eddington Bias) affects the SExtractor photometry at 24.0. At FUV wavelengths, the SExtractor photometry is not affected by source confusion (at least to =24) owing to fewer galaxy detections and a relatively smaller PSF as compared to the NUV band. The Bayesian deblending catalog is not affected by source confusion in either GALEX band over the magnitude range studied here. This is expected since the confusion limit depends on the resolution of the detection image (i.e. the SDSS image), which has 4x higher resolution than GALEX.
-
Eddington Bias
The Eddington Bias (Eddington, 1913) describes a source population with flux measurements that are systematically higher than their true flux values owing to Poisson noise. It arises across any magnitude interval that samples a rising Log N/Log S source distribution, although its effect is greatest near the detection limit where a relatively high fraction of sources have overestimated flux measurements. Every magnitude comparison shown in Figure 5 (or Figure 6) is affected at faint magnitudes by the Eddington Bias, which is responsible for the downturn of the average offset line at faint magnitudes. The Eddington Bias affects the Bayesian deblending catalog at slightly fainter magnitudes than the SExtractor catalog (and with a more gradual downturn), which is expected when source detection is performed in the higher signal-to-noise SDSS images (Hogg & Turner, 1998). We choose a faint-end magnitude limit of =24.5 and =25.0 for the Bayesian deblending catalog in order to avoid the Eddington Bias.
-
Aperture Correction
The GALEX PSF extends appreciably beyond the SExtractor Kron apertures, such that SExtractor measurements are underestimated by 0.1 dex in the NUV band and 0.07 dex in FUV across all simulated magnitudes. We have corrected the SExtractor magnitudes in Figures 5 and 6 for this nearly constant offset in order to isolate the effects discussed above. Bayesian deblending is not affected by light loss since the light distribution is fit across the entire GALEX PSF profile.
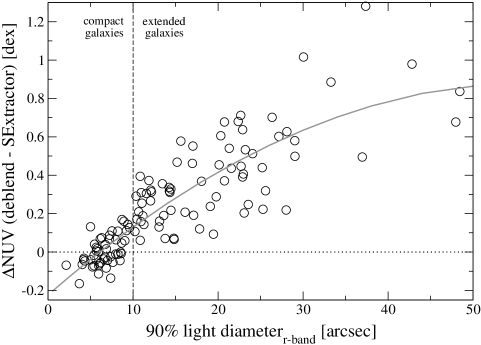
Although Bayesian deblending provides reliable photometry for unresolved objects, we expect that its flux measurements are underestimated for galaxies with apparent sizes that are much larger than the GALEX PSF. In Figure 7 we compare the magnitude difference for galaxies in the Bayesian deblending and GALEX pipeline catalogs versus the size of the galaxy (taken as the diameter that encloses 90% of the SDSS -band flux). The diagram confirms that the magnitudes diverge at a galaxy size of 10. As such, we adopt the photometry in the GALEX pipeline catalog for more extended galaxies as it provides a better estimate of the total galaxy flux.
It is well known that the SExtractor Kron photometry has a missing light problem, as no finite aperture can capture 100% of the light distribution for a galaxy that follows a Sérsic profile (even for the case of infinite S/N; Graham & Driver, 2005). In addition, the fraction of missing light is larger for detections with relatively low S/N (e.g. low surface brightness (LSB) galaxies) as the Kron aperture is scaled only from pixels that satisfy the detection threshold. We estimate that this effect is relatively small for galaxies in the Coma cluster based on the procedure for estimating the missing SExtractor flux described in Graham & Driver (2005). For example, the majority of Coma member galaxies are only marginally resolved in the GALEX images, for which SExtractor adopted its minimum Kron radius value of 3.5 pixels (which corresponds to 2.5 kpc at the distance of Coma). Assuming a Sérsic index of n=1 for dwarf galaxies and normal spirals (i.e. the majority of our confirmed Coma members) and effective radii between 1-2.5 kpc (e.g. Graham & Guzmán, 2003), we estimate that the SExtractor Kron apertures are missing 5-10% of the source flux (0.05-0.1 mag). This is the same amount of missing flux we estimated for the SExtractor photometry of point sources based on our simulations. As such, we have applied a small correction to the SExtractor Kron magnitudes (=0.1 0.05 mag) in both GALEX bands in order to better recover the total galaxy magnitude. Note that the same analysis suggests that the SExtractor photometry for giant early-type galaxies in the Coma cluster with a Sérsic index n=4 (i.e. a de Vaucouleur profile) may be missing 25% of the light distribution, thus are still too faint by 0.2 dex in magnitude after performing corrections.
3.5. Summary of the Final GALEX/SDSS Catalog
We have assembled a final source catalog that consists of 9700 objects with GALEX and SDSS photometry. UV photometry is taken from the GALEX pipeline catalog for bright or extended galaxies, i.e. objects brighter than =21 or =21, or with an optical 90% light diameter larger than 10 in the SDSS -band. We rely on a Bayesian deblending method for faint compact objects with magnitudes between 2124.5 and 2125. The catalog includes all such objects located within the inner 0.5 deg GALEX FOV (0.8 deg2), and provides slightly wider coverage (the inner 0.6 deg GALEX FOV or 1.1 deg2) for galaxies brighter than ()21. The optical counterparts to the UV sources are either (a) brighter than =24 and classified as galaxies by SDSS (8704 sources), or (b) have magnitudes between 2124 and are classified as stars by SDSS (996 sources). For the latter case, we expect that over one-half of these objects are actually galaxies based on a comparison to HST-ACS data. A subset of our GALEX/SDSS catalog is presented in Table 1 (the full table is available in the electronic version of this paper). For each source we list the SDSS coordinates [1-2], SDSS ‘type’ (galaxy=3, star=6) [3], SDSS Petrosian magnitudes [4-8], and the GALEX NUV and FUV magnitudes including uncertainties [9-12].
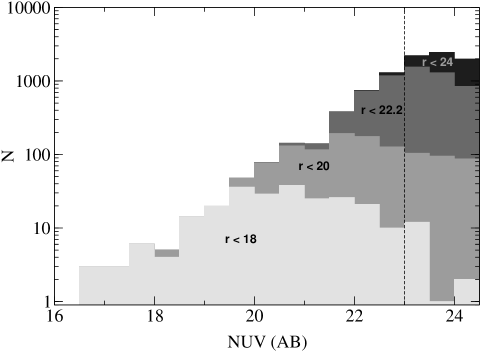
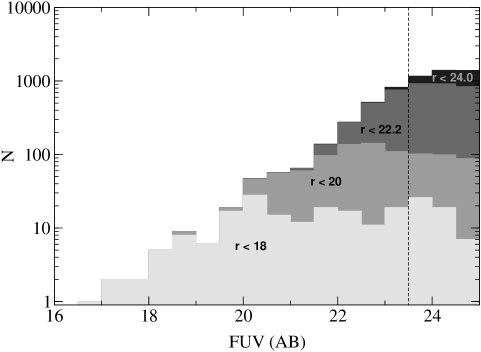
The UV completeness limit of our GALEX/SDSS catalog is a function of both the GALEX and SDSS detection limits. Magnitude histograms provide a straightforward diagnostic of the completeness limits for multi-wavelength catalogs. In Figure 8 we present the UV magnitude histograms for all sources in our catalog separated by -band magnitude. The diagram indicates that our catalog includes the majority of galaxies at the adopted limits of =23.0 and =23.5, which were chosen at 0.5 mag brighter than the observed flattening and then decline in the number of UV/optical detections. At fainter UV magnitudes, the number of detections is limited by the SDSS incompleteness.
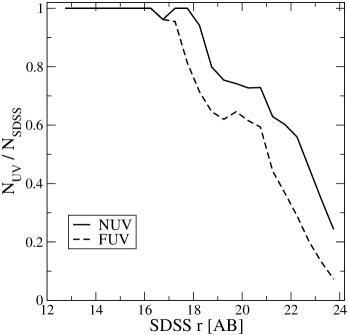
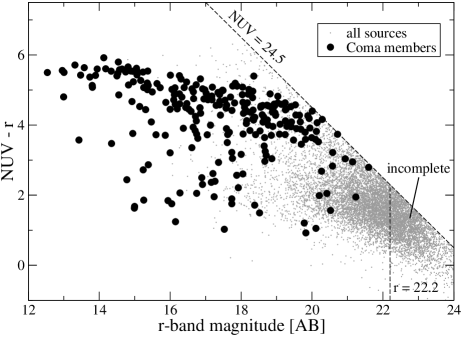
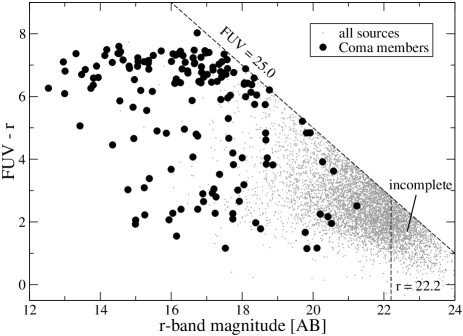
It is also useful to describe the completeness of our GALEX/SDSS catalog relative to optical magnitudes. In Figure 9 we show the fraction of sources in the SDSS DR6 that are members of the our catalog. The diagram shows that our catalog includes 95% of all SDSS DR6 galaxies brighter than =18.5 (=17.5) for the NUV (FUV) filters, respectively. The SDSS fraction drops at fainter optical magnitudes as we lose coverage of red quiescent galaxies (e.g. -=6.0 and -=7.5), which are fainter than the detection/photometry limit of our GALEX image (lim=24.5 and lim=25.0). The dependence of our completeness limits on UV-optical color is more obvious from the color magnitude diagrams presented in Figure 10 (- and - vs ). Galaxies with UV-optical colors bluer than -=2.3 and -=2.8 are limited by the SDSS completeness limit (=22.2) as opposed to the depth of our GALEX image.
Galaxies that are spectroscopically-confirmed members of the Coma cluster are also shown in Figure 10. The redshifts were taken from several spectroscopic surveys (e.g. R. Marzke et al. 2010, in prep; Adelman-McCarthy et al., 2008; Mobasher et al., 2001; Colless & Dunn, 1996), which are described in our companion paper (Paper II; D. Hammer et al. 2010, submitted). The cluster red sequence is the dense band of Coma members that stretches horizontally across the top of each diagram. From the NUV CMD, the red sequence traces bluer colors at faint optical magnitudes until we lose coverage at 20, i.e. NUV detections are available for all Coma members brighter than Mr=-15. The red sequence has a relatively flat slope in the FUV CMD, thus we lose coverage of red sequence galaxies at a brighter optical magnitude as compared to the NUV band (17.5 or Mr=-17.5). The red sequence detection limits for both GALEX bands are in the optical magnitude range expected for dwarf early-type (dE) galaxies.
4. Comparison to Previous UV Surveys
Although our GALEX image covers part of the Coma cluster (0.023), its depth allows us to constrain the background galaxy population as cluster member galaxies account for only a few percent of all UV-detected galaxies at the limiting depth of our GALEX/SDSS catalog. This allows for a comparison of the UV galaxy counts measured using our catalog as compared to early GALEX measurements that relied on the GALEX pipeline catalog (i.e. before improved source detection and photometry techniques, such as Bayesian deblending, were introduced). In the following sections we re-measure the number counts of galaxies to faint UV magnitudes, and use these values to estimate the source confusion limits for both the Bayesian deblending catalog and the GALEX pipeline catalogs.
4.1. Galaxy Number Counts
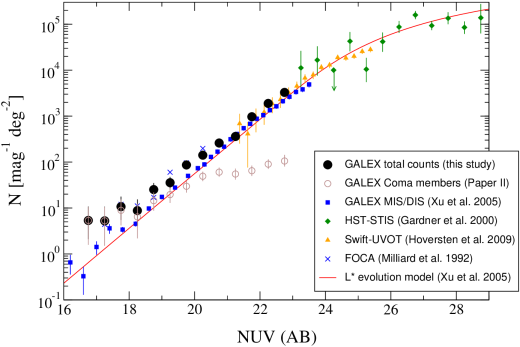
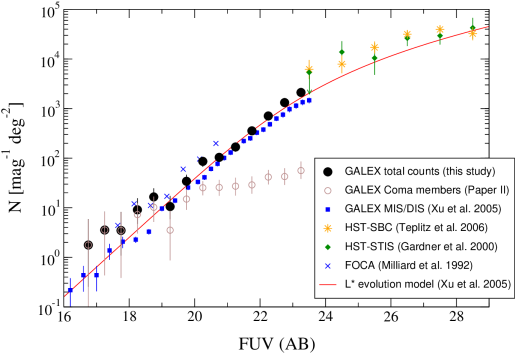
Measurements of the UV number counts of galaxies are important for constraining models of galaxy formation and evolution (e.g. semi-analytic CDM models; Nagashima et al., 2002; Gilmore et al., 2009). The differential number counts for our GALEX survey are shown in Figure 11, which covers the magnitude range 17.0-23.5 for the FUV filter and 16.5-23.0 for the NUV filter. We derived the galaxy counts by counting objects in our catalog that are considered galaxies by SDSS, and then performing statistical corrections to account for (a) misclassified stars in the SDSS catalog (see Appendix A), (b) the Eddington Bias, which was estimated following the formalism in Eddington (1913), and (c) UV incompleteness based on our simulations. The statistical corrections account for 10% (5%) of the galaxy counts across the magnitude range covered by the FUV (NUV) bands, respectively. The error bars include Poisson counting errors (Gehrels, 1986), uncertainties for the SDSS star/galaxy classification (see Appendix A), errors for the Eddington Bias correction (conservatively taken as 50% of the correction), and the uncertainty of our UV detection efficiency from simulations. The error bars also include cosmic variance, which we estimated following the formalism in Glazebrook et al. (1994) using typical parameters for the galaxy correlation function at UV wavelengths (=1.6; r0=3.0/4.0 Mpc h-1 for galaxies brighter/fainter than FUV(NUV)=21, respectively; Milliard et al., 2007; Heinis et al., 2009). In Table 2 we list our differential number counts and the upper/lower limits [2-4], the raw number of galaxies in each magnitude bin [5], and the survey area [6].
Galaxy counts from previous UV surveys are shown in Figure 11 for comparison, such as a relatively shallow survey performed with the balloon-borne FOCA instrument at 2000 Å (Milliard et al., 1992), a GALEX study of multiple MIS and DIS fields (Xu et al., 2005), a Swift-UVOT (uvm2) NUV survey of the CDF-S (Hoversten et al., 2009), a deep HST-STIS (F25QTZ) FUV and NUV survey that observed the HDF-N and HDF-S fields (Gardner et al., 2000), and a deep HST-ACS (SBC F150LP) FUV survey that also covers the HDF-N field but with 3x the coverage area (Teplitz et al., 2006). We also include a model for the galaxy counts in the GALEX FUV and NUV bands (Xu et al., 2005). We have performed a color correction to match the FOCA filter to the GALEX system based on a magnitude comparison for 46 galaxies in our GALEX FOV that were also detected by FOCA (Donas et al., 1991). We converted the FOCA monochromatic magnitudes at 2000 Å using the relations =+2.4 and =+2.0, which are reliable for star forming galaxies brighter than m2000=17.5; we found that FOCA significantly overestimates the flux for galaxies fainter than m2000=17.5 as suggested in previous GALEX studies (e.g. Wyder et al., 2005). We do not perform color corrections for the STIS NUV and UVOT uvm2 filters, as their similarity with the GALEX NUV bandpass results in a negligible 0.02 mag correction across all three filters (Hoversten et al., 2009). Color corrections for the HST FUV filters are beyond the scope of this paper, as they are highly sensitive to redshift (e.g. Teplitz et al., 2006).
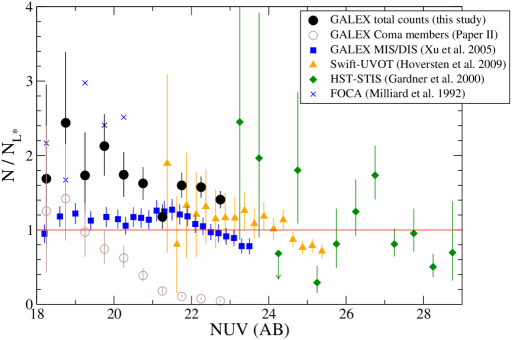
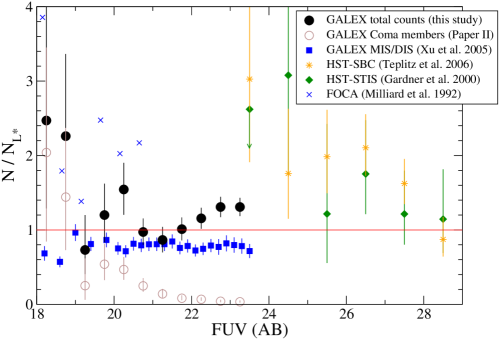
We have also plotted in Figure 11 the expected number of Coma members in each apparent magnitude bin based on measurements of the Coma UV luminosity function (Paper II). As expected, our total number counts are higher than the previous GALEX measurements at bright magnitudes ( and 21; Xu et al., 2005) owing to the overdensity of galaxies in the foreground Coma cluster. However, we see a significant excess of faint galaxies relative to the Xu et al. (2005) counts at =21.5-23 and =21.5-23.5, amounting to 50% in NUV and 60% in the FUV counts at our limiting depth. This is more obvious from Figure 12, where we have plotted galaxy counts relative to an arbitrary baseline (the model counts). The excess galaxy counts cannot be accounted for by Coma members, which contribute only 2% of the counts at the limiting depth. In addition, we suspect that our counts are too low across the three faintest magnitude bins in both GALEX bands owing to SDSS incompleteness. For instance, the SDSS detection efficiency for extended galaxies may only be 50% at =22.2, while it is 95% for point sources at this magnitude limit999www.sdss.org/dr6/products/general/completeness.html. Assuming a worst-case scenario such that one-half of SDSS galaxies at 21 are missing from our catalog, our UV counts could be underestimated by 5, 10, and 30% across our three faintest magnitude bins for both GALEX bands.
Our excess galaxy counts and their slopes at faint magnitudes are a better match to the deep HST surveys. At NUV wavelengths, our counts are statistically consistent with the deeper HST-STIS counts where the two datasets are bridged; the large STIS uncertainties, however, prevent any definitive conclusions regarding this agreement as we could also argue that our counts are lower by a factor of 2. Our FUV counts are clearly disjoint with both HST surveys, such that the deep HST FUV counts are 30-50% larger than expected based on an extrapolation of our values to fainter magnitudes. This difference may result from incompleteness of the SDSS catalog as discussed above. Interestingly, Teplitz et al. (2006) suggest that the HST-SBC FUV survey may cover a 30% larger volume than GALEX owing to its slightly redder wavelength coverage (the HST-STIS and SBC FUV filters extend 100 and 150 Å redward of the GALEX FUV filter, respectively). A more recent HST-SBC FUV study covering a larger area with more sightlines (E. Voyer et al. 2010, in prep) finds 30% lower counts (on average) than the Teplitz et al. (2006) or Gardner et al. (2000) studies, possibly due to cosmic variance. A combination of these effects is likely responsible for the offset between our FUV counts and the deeper HST surveys.
The excess galaxy counts are not likely attributed to the different detection/photometry methods and statistical corrections used in our study as compared to Xu et al. (2005). For example, we measured nearly identical FUV and NUV counts using the GALEX pipeline catalog with the exact selection criteria and corrections used by Xu et al. (2005). The excess galaxy counts are at least partially due to AGN that are not accounted for in this study, but were removed by Xu et al. (2005). However, only a small fraction of galaxies are expected to have UV emission that is dominated by AGN (e.g. a few percent; Hoversten et al., 2009). We also note that the UVOT NUV counts are approximately midway between both sets of GALEX measurements, but we suspect that their true GALEX-matched values are closer to our counts, e.g. the redder wavelength coverage of the GALEX NUV filter relative to UVOT uvm2 results in both more detections of early-type galaxies and a slightly larger survey volume as the Lyman limit passes through the GALEX NUV band at a higher redshift. An excess of background galaxies owing to cosmic variance would seem unlikely, as this requires a minimum 5 overdensity in the background Coma field at our limiting depth, where the cosmic variance is 10% (the excess is 50-60% relative to Xu et al. (2005)). For example, background clusters are not likely responsible for the excess counts as this would require at least 25 Coma cluster galaxy populations in the background FOV. However, massive clusters such as Coma tend to be associated with more filaments (e.g. Pimbblet et al., 2004), and we cannot rule out excess galaxy counts due to such large-scale structures. Interestingly, Jenkins et al. (2007) also reported excess galaxy counts in the same Coma-3 region at 3.6 relative to a comparison field. Clearly, further studies are needed to explain the difference between both sets of GALEX measurements.
In each diagram we have plotted the UV galaxy count models presented in Xu et al. (2005). These models were computed assuming pure luminosity evolution ((1+)2.5) using a single starburst SED (SB4; Kinney et al., 1996) with a flat spectrum blueward of Ly and no emission below the Lyman limit. Although the models assume a relatively simple evolution and only allow for a single SED, they provide a good first-order fit to both the FUV and NUV galaxy counts across 12 magnitudes. Noticeable shortcomings are that (a) whereas the models previously overestimated the faint galaxy counts from early GALEX measurements, they are now too low relative to our galaxy counts for both GALEX bands, (b) the slope of the FUV model flattens at FUV=22, which occurs 2-3 mags too bright as compared to the measured FUV counts, and (c) the slope of the FUV and NUV models are too steep at very faint magnitudes ( and 25). The difference between the model and measured counts likely results from neglecting number density evolution, using a single SED to represent all galaxies, assuming a flat spectrum shortward of Ly-, and poor constraints on the faint-end slopes of restframe UV LFs at higher redshifts (0.5). For example, cosmic downsizing (Cowie et al., 1996) predicts some number density evolution via low-mass galaxies that “turn on” at more recent epochs. Also, at higher redshifts (0.5) the majority of UV-detected galaxies are unobscured starbursts (e.g. Kinney SB1 template; Arnouts et al., 2005), as opposed to the obscured starburst template used for the models. The effect that these parameters have on the UV galaxy counts is highly model-dependent, and thus beyond the scope of this paper. Our counts will allow for more improved models of galaxy evolution by constraining number counts at intermediate UV magnitudes.
Finally, although the FOCA counts were measured for the field galaxy population, there is good agreement between FOCA and our measurements at bright magnitudes ( and 19.5). This agreement may result from contamination by cluster galaxies in the FOCA survey field SA57, which is partially located inside the apparent virial radius of the Coma cluster. Although the FOCA counts were measured in three separate fields, the majority of bright galaxies were detected in the SA57 field. At fainter magnitudes, the FOCA counts are higher than all other studies likely owing to overestimated flux measurements.
4.2. Source Confusion Limits
We have already established that our UV photometry is not affected by source confusion over the magnitude range studied here. This results from the use of a Bayesian deblending technique that performs source detection in higher-resolution SDSS images and then photometry in the GALEX image. Source confusion affects the GALEX pipeline catalog at relatively brighter magnitudes owing to source detection and photometry that are performed in the same GALEX image. Given the higher galaxy counts reported in this study, it is necessary to revise estimates of the source confusion limit in GALEX pipeline catalogs.
Although studies typically use indirect methods to measure the source confusion limit (discussed in the next paragraph), the most reliable estimates are performed via simulations (Hogg, 2001). Our simulations indicate that the GALEX pipeline catalogs are confusion limited in the NUV band between =23-23.5 based on the abrupt drop in the detection efficiency and systematic photometry errors that emerge over this magnitude range (§3.4). Our FUV image is flux limited, thus simulations were only able to establish an upper (bright) magnitude limit of =24 where the GALEX pipeline is not affected by source confusion.
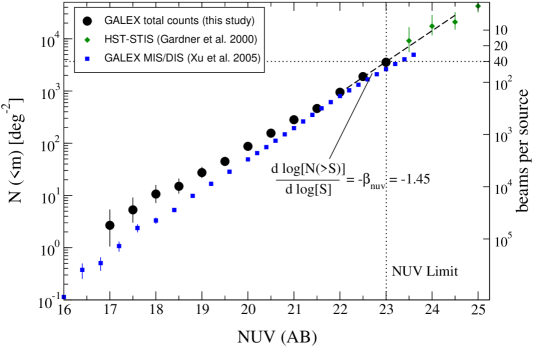
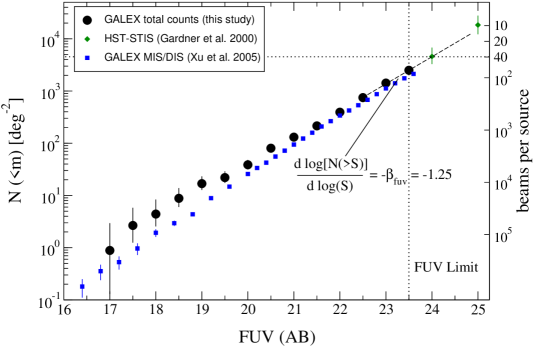
In lieu of performing simulations, the source confusion limit may be estimated indirectly from the measured number density of sources and the instrument beam size, more commonly referred to as the number of beams-per-source ():
| (1) |
where is the cumulative number counts at apparent magnitude , and is the instrument beam size. Hogg (2001) suggests that =40 should be taken as the confusion limit for source distributions with a cumulative Log N-Log S slope less than 1.5; we adopt this value as our cumulative number counts have slopes of nuv=1.45 and fuv=1.25, respectively. The cumulative galaxy counts for our survey are presented in Figure 13. One complication associated with equation [1] is that there does not exist a standard definition for the beam size, e.g. the beam size may be taken as the diameter equal to (a) the 1- Gaussian profile (FWHM/2.35), (b) the FWHM, or (c) the measured 50% light diameter. We chose a beam size equal to the GALEX FWHM, as only this definition of the beam size corresponds to a 40 beams-per-source NUV confusion limit (=23.1) that lies within the magnitude range =23.0-23.5 predicted by our simulations. Applying the GALEX FUV FWHM (4.8) and our FUV number counts to equation [1], we estimate that the GALEX pipeline catalogs are confusion limited at =24.0. We conclude that source confusion affects the GALEX pipeline catalogs at magnitudes fainter than =23 and =24, which are approximately 1 mag brighter than the source confusion limits estimated by Xu et al. (2005).
The Bayesian deblending method is affected by source confusion at relatively fainter magnitudes than the GALEX pipeline catalog owing to source detection that is performed in higher-resolution optical images (SDSS in our case). Adopting the standard 1.4 SDSS seeing for the beam size in equation [1], we estimate that our Bayesian deblending method would become confusion limited at 25.5 and 27.
5. Future Work
We use the GALEX/SDSS source catalog presented in this paper and a deep database of spectroscopic redshifts to measure the UV luminosity function (LF) of the Coma cluster (Paper II; D. Hammer et al. 2010, submitted). The improved source detection and photometry via the Bayesian deblending technique allows us to measure the deepest UV LF presented for a cluster thus far. We were recently awarded a deep GALEX observation at the center of the Coma cluster (P.I. R. Smith) that will allow for a comparison of the UV-faint properties of Coma member galaxies across a large range of cluster-centric distance.
Appendix A Appendix A: Constraining Properties of SDSS DR6 Sources with HST-ACS Data
The Coma cluster was the target of a HST-ACS Treasury survey that provides coverage in 19 fields located at the center of Coma with six additional fields in the south-west region of the cluster (Carter et al., 2008). The entire ACS footprint is covered by the SDSS DR6, and the six ACS fields in the south-west region of Coma overlap our GALEX FOV. Although the ACS coverage of our GALEX field is negligible (a few percent of the total GALEX FOV), we have used the ACS data to assess the reliability of the SDSS catalog, which we rely on for galaxy identification in this study. Specifically, the ACS images have relatively high resolution (0.12; Ford et al., 1998) and sensitivity (95% complete to 26; D. Hammer et al. 2010, in prep) as compared to SDSS, which allows us to determine statistically (a) the fraction of real/spurious objects in SDSS DR6 at faint magnitudes, and (b) the accuracy of the SDSS star/galaxy classification at faint magnitudes.
-
Real/Spurious Detections in the SDSS DR6
We have estimated the fraction of real/spurious detections in the SDSS DR6 catalog by searching the ACS images at the location of every SDSS object in the ACS footprint. The results are given in Table 3, which lists the SDSS -band magnitude [1], the number of SDSS galaxies inspected [2], the fraction of real objects among SDSS galaxies and the 1 upper/lower confidence limits [3-5], the number of SDSS stars inspected [6], and the fraction of real objects among SDSS stars and the 1 upper/lower confidence limits [7-9]. The uncertainties were calculated following the method in Gehrels (1986) for binomial statistics. We found that the fraction of real objects among SDSS galaxies/stars is 85% at magnitudes brighter than =24 mag. At fainter magnitudes, 40% of objects listed in the SDSS DR6 are spurious detections that result primarily from galaxy shredding near bright galaxies.
-
Accuracy of the SDSS Star/Galaxy Classification
The SDSS pipeline reports that its star/galaxy (S/G) classification is 95% accurate to =21 (e.g. Stoughton et al., 2002), although past studies suggest it may perform well to ‘at least =21.5’ (Lupton et al., 2001). We have tested the reliability of the SDSS S/G classification at faint magnitudes by comparing it to morphologies taken directly from the ACS images. This analysis was performed for SDSS objects located inside the ACS footprint, and also for the subset of SDSS/ACS objects that were detected in our GALEX field (for objects brighter than our UV 95% completeness limits of =24.5 and =25.0). The results are shown in Table 4 which lists the SDSS -band magnitude [1], the number of SDSS-classified galaxies that were inspected [2], the fraction of true galaxies among SDSS galaxies and the 1 upper/lower confidence limits [3-5], the number of SDSS-classified stars that were inspected [6], and the fraction of true galaxies among SDSS stars and the 1 upper/lower confidence limits [7-9]. The uncertainties were calculated following the method in Gehrels (1986) for binomial statistics.
For SDSS detections alone, we confirm that the SDSS S/G classification is 95% accurate for all objects brighter than =21. At fainter magnitudes, objects that are classified as galaxies by SDSS remain 90% accurate to the faintest limits of the SDSS survey (25). On the other hand, SDSS star classifications are unreliable at magnitudes fainter than =21, e.g. over one-half of faint (21) objects considered stars by SDSS are actually galaxies.
For the subset of SDSS sources with GALEX FUV or NUV detections, objects considered galaxies by SDSS are 95% accurate to =25.0, which is a slightly higher rate as compared to SDSS detections alone. There are relatively few SDSS-classified stars with GALEX detections that are located inside the ACS footprint (12 FUV detections and 31 NUV detections). The subset of SDSS stars that are brighter than =21 were indeed confirmed as stars (8/8). On the other hand, all SDSS star classifications fainter than =21 were confirmed as galaxies for GALEX FUV detections (11/11), and also for the majority of NUV detections (18/24); these rates are significantly higher than for SDSS detections alone, which suggests that the UV data tends to select galaxies that were misclassified by SDSS. This is likely a color selection effect owing to optical-selected stars that typically have red UV-optical colors (thus are fainter than the UV completeness limits of our catalog), while the background galaxies tend to be spirals with blue UV-optical colors.
Statistical studies that use our GALEX/SDSS catalog (e.g. UV galaxy counts, UV luminosity function) must correct for the number of galaxies among objects classified as stars by SDSS at magnitudes fainter than =21.0. For NUV studies, this correction may be estimated by counting the number of SDSS stars in each UV magnitude bin, then separating the stars into -band bins, and then applying to the corrections listed in the middle panel of Table 4, e.g. the NUV correction for misclassified galaxies is: nuv=0.50 (2122), nuv=0.77 (2122), nuv=0.86 (2324). At FUV wavelengths, the fraction of galaxies among SDSS classified stars is relatively higher as compared to the NUV band (stars are less likely to be observed in the FUV band), although the 100% galaxy correction listed in the bottom panel of Table 4 is likely too high owing to low-number statistics. Instead, we recommend using a FUV galaxy correction that is midway between the NUV fraction given above and a 100% correction, with uncertainties that span the total range, e.g. the FUV correction for misclassified galaxies is: fuv=0.75 (2122), fuv=0.88 (2122), fuv=0.93 (2324).
References
- Abazajian et al. (2004) Abazajian, K., et al. 2004, AJ, 128, 502
- Abell et al. (1989) Abell, G. O., Corwin, H. G., Jr., & Olowin, R. P. 1989, ApJS, 70, 1
- Adelman-McCarthy et al. (2008) Adelman-McCarthy, J. K., et al. 2008, ApJS, 175, 297
- Andreon (1999) Andreon, S. 1999, A&A, 351, 65
- Arnouts et al. (2005) Arnouts, S., et al. 2005, ApJ, 619, L43
- Bautz & Morgan (1970) Bautz, L. P., & Morgan, W. W. 1970, ApJ, 162, L149
- Bertin & Arnouts (1996) Bertin, E., & Arnouts, S. 1996, A&AS, 117, 393
- Blanton & Roweis (2007) Blanton, M. R., & Roweis, S. 2007, AJ, 133, 734
- Boselli et al. (2005) Boselli, A., et al. 2005, ApJ, 629, L29
- Briel et al. (2001) Briel, U. G., et al. 2001, A&A, 365, L60
- Brown et al. (1995) Brown, T. M., Ferguson, H. C., & Davidsen, A. F. 1995, ApJ, 454, L15
- Budavári et al. (2009) Budavári, T., et al. 2009, ApJ, 694, 1281
- Caldwell & Rose (1998) Caldwell, N., & Rose, J. A. 1998, AJ, 115, 1423
- Caldwell et al. (1993) Caldwell, N., Rose, J. A., Sharples, R. M., Ellis, R. S., & Bower, R. G. 1993, AJ, 106, 473
- Carter et al. (2008) Carter, D., et al. 2008, ApJS, 176, 424
- Code (1969) Code, A. D. 1969, PASP, 81, 475
- Colless & Dunn (1996) Colless, M., & Dunn, A. M. 1996, ApJ, 458, 435
- Cortese et al. (2005) Cortese, L., et al. 2005, ApJ, 623, L17
- Cortese et al. (2008) Cortese, L., Gavazzi, G., & Boselli, A. 2008, MNRAS, 390, 1282
- Cortese et al. (2003a) Cortese, L., Gavazzi, G., Boselli, A., Iglesias-Paramo, J., Donas, J., & Milliard, B. 2003a, A&A, 410, L25
- Cortese et al. (2003b) Cortese, L., Gavazzi, G., Iglesias-Paramo, J., Boselli, A., & Carrasco, L. 2003b, A&A, 401, 471
- Cowie et al. (1996) Cowie, L. L., Songaila, A., Hu, E. M., & Cohen, J. G. 1996, AJ, 112, 839
- Donas et al. (1991) Donas, J., Milliard, B., & Laget, M. 1991, A&A, 252, 487
- Dorman et al. (1995) Dorman, B., O’Connell, R. W., & Rood, R. T. 1995, ApJ, 442, 105
- Dorman et al. (2003) Dorman, B., O’Connell, R. W., & Rood, R. T. 2003, ApJ, 591, 878
- Eddington (1913) Eddington, A. S. 1913, MNRAS, 73, 359
- Ford et al. (1998) Ford, H. C., et al. 1998, in SPIE Conference Series, ed. P. Y. Bely & J. B. Breckinridge, Vol. 3356, 234
- Gardner et al. (2000) Gardner, J. P., Brown, T. M., & Ferguson, H. C. 2000, ApJ, 542, L79
- Gehrels (1986) Gehrels, N. 1986, ApJ, 303, 336
- Gilmore et al. (2009) Gilmore, R. C., Madau, P., Primack, J. R., Somerville, R. S., & Haardt, F. 2009, MNRAS, 399, 1694
- Glazebrook et al. (1994) Glazebrook, K., Peacock, J. A., Collins, C. A., & Miller, L. 1994, MNRAS, 266, 65
- Graham & Driver (2005) Graham, A. W., & Driver, S. P. 2005, Publications of the Astronomical Society of Australia, 22, 118
- Graham & Guzmán (2003) Graham, A. W., & Guzmán, R. 2003, AJ, 125, 2936
- Greggio & Renzini (1990) Greggio, L., & Renzini, A. 1990, ApJ, 364, 35
- Guillaume et al. (2006) Guillaume, M., Llebaria, A., Aymeric, D., Arnouts, S., & Milliard, B. 2006, in SPIE Conference Series, ed. E. R. Dougherty, J. T. Astola, K. O. Egiazarian, N. M. Nasrabadi, & S. A. Rizvi, Vol. 6064, 332
- Heinis et al. (2009) Heinis, S., et al. 2009, ApJ, 698, 1838
- Hogg (2001) Hogg, D. W. 2001, AJ, 121, 1207
- Hogg & Turner (1998) Hogg, D. W., & Turner, E. L. 1998, PASP, 110, 727
- Hoversten et al. (2009) Hoversten, E. A., et al. 2009, ApJ, 705, 1462
- Ilbert et al. (2009) Ilbert, O., et al. 2009, ApJ, 690, 1236
- Jenkins et al. (2007) Jenkins, L. P., Hornschemeier, A. E., Mobasher, B., Alexander, D. M., & Bauer, F. E. 2007, ApJ, 666, 846
- Kennicutt (1998) Kennicutt, R. C. 1998, ARA&A, 36, 189
- Kinney et al. (1996) Kinney, A. L., Calzetti, D., Bohlin, R. C., McQuade, K., Storchi-Bergmann, T., & Schmitt, H. R. 1996, ApJ, 467, 38
- Komiyama et al. (2002) Komiyama, Y., et al. 2002, ApJS, 138, 265
- Kron (1980) Kron, R. G. 1980, ApJS, 43, 305
- Łokas & Mamon (2003) Łokas, E. L., & Mamon, G. A. 2003, MNRAS, 343, 401
- Lupton et al. (2001) Lupton, R., Gunn, J. E., Ivezić, Z., Knapp, G. R., & Kent, S. 2001, in ASP-ADASS, ed. F. R. Harnden, Jr., F. A. Primini, & H. E. Payne, Vol. 238, 269
- Martin et al. (2005) Martin, D. C., et al. 2005, ApJ, 619, L59
- Miller et al. (2009) Miller, N. A., Hornschemeier, A. E., & Mobasher, B. 2009, AJ, 137, 4436
- Miller & Owen (2002) Miller, N. A., & Owen, F. N. 2002, AJ, 124, 2453
- Milliard et al. (1991) Milliard, B., Donas, J., & Laget, M. 1991, Advances in Space Research, 11, 135
- Milliard et al. (1992) Milliard, B., Donas, J., Laget, M., Armand, C., & Vuillemin, A. 1992, A&A, 257, 24
- Milliard et al. (2007) Milliard, B., et al. 2007, ApJS, 173, 494
- Mobasher et al. (2001) Mobasher, B., et al. 2001, ApJS, 137, 279
- Morrissey et al. (2007) Morrissey, P., et al. 2007, ApJS, 173, 682
- Morrissey et al. (2005) Morrissey, P., et al. 2005, ApJ, 619, L7
- Nagashima et al. (2002) Nagashima, M., Yoshii, Y., Totani, T., & Gouda, N. 2002, ApJ, 578, 675
- Neumann et al. (2001) Neumann, D. M., et al. 2001, A&A, 365, L74
- O’Connell (1999) O’Connell, R. W. 1999, ARA&A, 37, 603
- Park & Lee (1997) Park, J.-H., & Lee, Y.-W. 1997, ApJ, 476, 28
- Pimbblet et al. (2004) Pimbblet, K. A., Drinkwater, M. J., & Hawkrigg, M. C. 2004, MNRAS, 354, L61
- Poggianti et al. (2004) Poggianti, B. M., Bridges, T. J., Komiyama, Y., Yagi, M., Carter, D., Mobasher, B., Okamura, S., & Kashikawa, N. 2004, ApJ, 601, 197
- Rawle et al. (2008) Rawle, T. D., Smith, R. J., Lucey, J. R., Hudson, M. J., & Wegner, G. A. 2008, MNRAS, 385, 2097
- Salim et al. (2009) Salim, S., et al. 2009, ApJ, 700, 161
- Schlegel et al. (1998) Schlegel, D. J., Finkbeiner, D. P., & Davis, M. 1998, ApJ, 500, 525
- Smith et al. (2009) Smith, R. J., Lucey, J. R., Hudson, M. J., Allanson, S. P., Bridges, T. J., Hornschemeier, A. E., Marzke, R. O., & Miller, N. A. 2009, MNRAS, 392, 1265
- Stoughton et al. (2002) Stoughton, C., et al. 2002, AJ, 123, 485
- Teplitz et al. (2006) Teplitz, H. I., et al. 2006, AJ, 132, 853
- White et al. (1993) White, S. D. M., Briel, U. G., & Henry, J. P. 1993, MNRAS, 261, L8
- Wyder et al. (2007) Wyder, T. K., et al. 2007, ApJS, 173, 293
- Wyder et al. (2005) Wyder, T. K., et al. 2005, ApJ, 619, L15
- Xu et al. (2005) Xu, C. K., et al. 2005, ApJ, 619, L11
- York et al. (2000) York, D. G., et al. 2000, AJ, 120, 1579
- Zamojski et al. (2007) Zamojski, M. A., et al. 2007, ApJS, 172, 468
| R.A. | Dec. | S/G Type | NUV | FUV | |||||||
|---|---|---|---|---|---|---|---|---|---|---|---|
| (1) | (2) | (3) | (4) | (5) | (6) | (7) | (8) | (9) | (10) | (11) | (12) |
| 194.57009 | 27.72968 | 3 | 18.00 | 16.67 | 16.07 | 15.75 | 15.54 | 18.6 | 0.05 | 19.2 | 0.05 |
| 194.69751 | 27.67473 | 3 | 16.56 | 14.62 | 13.81 | 13.44 | 13.25 | 18.9 | 0.05 | 20.4 | 0.06 |
| 194.63167 | 27.67351 | 3 | 18.06 | 16.39 | 15.63 | 15.28 | 15.01 | 20.8 | 0.05 | 22.7 | 0.10 |
| 194.73922 | 27.65435 | 3 | 20.18 | 19.42 | 18.59 | 18.31 | 18.07 | 20.8 | 0.05 | 21.6 | 0.06 |
| 194.75167 | 27.64399 | 3 | 19.64 | 18.77 | 18.52 | 18.39 | 18.29 | 20.0 | 0.05 | 20.3 | 0.05 |
Note. — See the electronic version of this paper for the complete catalog.
| AB mag | area | ||||
|---|---|---|---|---|---|
| (1) | (2) | (3) | (4) | (5) | (6) |
| NUV | |||||
| 16.75 | 5.4 | 5.4 | 3.3 | 3 | 1.13 |
| 17.25 | 5.2 | 5.4 | 3.2 | 3 | 1.13 |
| 17.75 | 10.7 | 7.0 | 5.2 | 6 | 1.13 |
| 18.25 | 8.6 | 6.5 | 4.5 | 5 | 1.13 |
| 18.75 | 24.8 | 9.7 | 8.0 | 14 | 1.13 |
| 19.25 | 34.9 | 11.7 | 10.1 | 20 | 1.13 |
| 19.75 | 85 | 17 | 16 | 48 | 1.13 |
| 20.25 | 137 | 24 | 23 | 78 | 1.13 |
| 20.75 | 252 | 34 | 34 | 142 | 1.13 |
| 21.25 | 360 | 51 | 49 | 138 | 0.79 |
| 21.75 | 967 | 103 | 101 | 366 | 0.79 |
| 22.25 | 1888 | 171 | 171 | 716 | 0.79 |
| 22.75 | 3332 | 273 | 277 | 1238 | 0.79 |
| FUV | |||||
| 16.75 | 1.7 | 4.1 | 1.5 | 1 | 1.13 |
| 17.25 | 3.6 | 4.8 | 2.4 | 2 | 1.13 |
| 17.75 | 3.5 | 4.8 | 2.4 | 2 | 1.13 |
| 18.25 | 8.8 | 6.3 | 4.2 | 5 | 1.13 |
| 18.75 | 16.0 | 7.8 | 6.0 | 9 | 1.13 |
| 19.25 | 10.3 | 6.6 | 4.6 | 6 | 1.13 |
| 19.75 | 33.3 | 11.7 | 10.2 | 19 | 1.13 |
| 20.25 | 83 | 19 | 18 | 47 | 1.13 |
| 20.75 | 101 | 19 | 18 | 57 | 1.13 |
| 21.25 | 168 | 34 | 32 | 65 | 0.79 |
| 21.75 | 356 | 55 | 53 | 135 | 0.79 |
| 22.25 | 710 | 87 | 86 | 271 | 0.79 |
| 22.75 | 1344 | 140 | 140 | 503 | 0.79 |
| 23.25 | 2153 | 202 | 202 | 793 | 0.79 |
Note. — Magnitudes are reported for the center of the bins, differential number counts have units of mag-1 deg-2, are the raw galaxy counts in each bin (not including statistical corrections), and the coverage area is given for square degrees.
| (1) | (2) | (3) | (4) | (5) | (6) | (7) | (8) | (9) |
|---|---|---|---|---|---|---|---|---|
| 18.5 | 28 | 0.96 | 0.03 | 0.08 | 13 | 1.00 | 0.00 | 0.13 |
| 19.5 | 56 | 0.95 | 0.03 | 0.05 | 23 | 1.00 | 0.00 | 0.08 |
| 20.5 | 131 | 0.97 | 0.01 | 0.02 | 33 | 0.91 | 0.05 | 0.08 |
| 21.5 | 247 | 0.86 | 0.02 | 0.03 | 33 | 0.91 | 0.05 | 0.08 |
| 22.5 | 240 | 0.88 | 0.02 | 0.02 | 86 | 0.98 | 0.02 | 0.03 |
| 23.5 | 66 | 0.89 | 0.04 | 0.05 | 72 | 0.78 | 0.05 | 0.06 |
| 24.5 | 46 | 0.59 | 0.08 | 0.08 | 38 | 0.61 | 0.09 | 0.09 |
| (1) | (2) | (3) | (4) | (5) | (6) | (7) | (8) | (9) |
|---|---|---|---|---|---|---|---|---|
| ACS/SDSS Detections in the Coma-1 and Coma-3 Fields | ||||||||
| 18.5 | 32 | 0.97 | 0.03 | 0.07 | 14 | 0.07 | 0.15 | 0.06 |
| 19.5 | 78 | 0.95 | 0.02 | 0.04 | 33 | 0.03 | 0.07 | 0.03 |
| 20.5 | 192 | 0.93 | 0.02 | 0.02 | 44 | 0.07 | 0.04 | 0.06 |
| 21.5 | 299 | 0.94 | 0.01 | 0.02 | 62 | 0.32 | 0.07 | 0.06 |
| 22.5 | 320 | 0.93 | 0.01 | 0.02 | 137 | 0.50 | 0.04 | 0.04 |
| 23.5 | 86 | 0.90 | 0.03 | 0.04 | 83 | 0.66 | 0.06 | 0.06 |
| 24.5 | 38 | 0.92 | 0.04 | 0.07 | 36 | 0.53 | 0.09 | 0.10 |
| ACS/SDSS/GALEX NUV Detections in the Coma-3 Field | ||||||||
| 18.5 | 6 | 0.83 | 0.14 | 0.29 | 1 | 0.00 | 0.84 | 0.00 |
| 19.5 | 11 | 1.00 | 0.00 | 0.15 | 3 | 0.00 | 0.46 | 0.00 |
| 20.5 | 31 | 1.00 | 0.00 | 0.06 | 4 | 0.00 | 0.37 | 0.00 |
| 21.5 | 63 | 0.97 | 0.02 | 0.04 | 4 | 0.50 | 0.31 | 0.31 |
| 22.5 | 61 | 0.98 | 0.01 | 0.04 | 13 | 0.77 | 0.12 | 0.18 |
| 23.5 | 9 | 1.00 | 0.00 | 0.18 | 7 | 0.86 | 0.12 | 0.26 |
| ACS/SDSS/GALEX FUV Detections in the Coma-3 Field | ||||||||
| 18.5 | 4 | 0.75 | 0.21 | 0.37 | 0 | |||
| 19.5 | 12 | 1.00 | 0.00 | 0.14 | 0 | |||
| 20.5 | 25 | 1.00 | 0.00 | 0.07 | 1 | 0.00 | 0.00 | 0.84 |
| 21.5 | 45 | 0.98 | 0.02 | 0.05 | 2 | 1.00 | 0.00 | 0.60 |
| 22.5 | 27 | 0.96 | 0.03 | 0.08 | 5 | 1.00 | 0.00 | 0.31 |
| 23.5 | 6 | 1.00 | 0.00 | 0.26 | 4 | 1.00 | 0.00 | 0.37 |