Data Mining the University: College GPA Predictions from SAT Scores
Abstract
We analyze a data set comprised of academic records of undergraduates at the University of Oregon from 2000-2004. We find correlations of roughly 0.35 to 0.5 between SAT scores and upper division, in-major GPA (henceforth, GPA). Interestingly, low SAT scores do not preclude high performance in most majors. That is, the distribution of SAT scores after conditioning on high GPA (e.g., 3.5 or even 4.0) typically extends below 1000 (the average among test takers). We hypothesize that overachievers overcome cognitive deficits through hard work, and discuss to what extent they can be identified from high school records. Only a few majors seem to exhibit a cognitive threshold – such that high GPA (mastery of the subject matter) is very unlikely below a certain SAT threshold (i.e., no matter how dedicated or hard working the student). Our results suggest that almost any student admitted to university can achieve academic success, if they work hard enough.
In addition to our primary result, we find that the best predictor of GPA is a roughly equally weighted sum of SAT and high school GPA, measured in standard deviation units. Using a sub-population of honors college students, we can estimate how students at elite universities would fare at a typical state university, allowing us to comment on issues such as grade inflation. Finally, we observe that 1) SAT scores fluctuate little on retest (very high reliability), 2) SAT and GRE scores (where available) correlate at roughly 0.75 (consistent with the notion that both tests measure a stable general cognitive ability) and 3) the SAT distribution of students that obtained a degree does not differ substantially from that of the entering class.
1 Introduction and Overview
Considering their widespread use in college admissions, the predictive power (validity) of tests such as the SAT and ACT is a surprisingly controversial topic. On the negative side, one often reads claims that the correlation of SAT with freshman GPA is as low as 0.25 to 0.35 (Sackett et al. 2008). On the positive side, one cannot help but be impressed by a measure of cognitive ability that requires only a few hours of testing, is fairly stable (see results below) and has roughly as much predictive power as high school GPA, which represents years of evaluation by experienced instructors111For a review of psychometrics and the science of mental ability, see Jensen (1998). The SAT is clearly a cognitive test, and as such has a high correlation with IQ or the general factor of intelligence, . Indeed, the SAT, administered at an early age to overcome ceiling limitations, has been used successfully as a tool for identifying exceptionally gifted children (Park et al. 2008).. Note, in what follows, we will refer primarily to SAT rather than SAT/ACT, and convert scores when necessary to the SAT scoring system.
It is easy to understand why freshman GPA measured over an entire population is not a satisfactory metric of academic success – students typically self-select into courses of varying difficulty already in their freshman year. More able students typically take more difficult courses, for example: linear algebra, multivariable calculus or electromagnetism, whereas less able students are likely to be in introductory courses that are not very different from high school classes. A further complication is that studies done at elite universities suffer from restricted range: nearly all students in such studies have high SAT scores. Theoretical estimates suggest that adjusting for effects such as course difficulty and restriction of range leads to higher correlation values such as 0.55 (Berry & Sackett 2009).
The University of Oregon (UO), a state flagship campus, has a number of favorable characteristics for the study of SAT predictive power. Because UO admits a broad range of students, there is little restriction of range: very strong, average and slightly below average (i.e., below the average among all test takers, SAT 1000) students are represented. The student body also has a fairly uniform racial composition, which minimizes effects of ethnicity on the results.
In the analysis presented below, we focus on upper division, in-major GPA. This corrects for variation between majors in course difficulty and grading standards. Upper division grades test in-depth mastery of material specific to each major. While we do observe variation between different majors, which we explore in some detail, in almost every major we find a significant correlation between SAT and GPA, with values ranging from about 0.35 to 0.5.
Thus, at least for UO and similar institutions, a strong case can be made for the use of SAT scores in admissions. Students with high SAT scores are clearly more likely to perform well in upper division courses. However, it is important to emphasize that a low SAT score does not, by itself, preclude strong performance, a fact that surprised us when we examined the data. There are many students (overachievers) with modest scores who nevertheless achieve high upper division GPAs, across a broad variety of majors. Interestingly, these overachievers tend to be disproportionately female (64 percent), whereas underachievers (students with high SAT scores but poor performance in courses) are overwhelmingly male (79 percent).
Our results raise a number of interesting questions, which we investigate further below. Can one determine from high school records which low scoring students are likely to overachieve? Perhaps work ethic or conscientiousness in low SAT students is reflected in superior high school grades? Some studies (Noftle & Robins 2007) have shown that conscientiousness (as measured in personality inventory) contributes to college GPA even after high school GPAHS and SAT are controlled for. Below, we determine the relative weighting of GPAHS and SAT that best predicts upper division GPA, across a variety of majors. A related analysis, using data from the Clark Honors College at UO, allows us to predict the performance of elite university students were they to have enrolled at a typical state university instead.
A final question relates to whether mastery of certain subjects is more cognitively challenging than others. Such majors might exhibit cognitive thresholds below which no amount of hard work or motivation is enough to permit mastery of the subject matter. In section §4 we discuss some modest evidence for cognitive thresholds related to mathematical ability in majors such as physics and math.
2 Descriptive Results
Our dataset focuses on courses taken from 2000 to 2004 by students in twelve majors in the College of Arts and Sciences (see below). In order to follow the academic path from freshman year to graduation, we constrained the sample to only include those students enrolled during the 2000 to 2004 time frame, admitted after 1996 (to avoid the 1995 SAT re-centering event). Students were then binned into four types; 1) those who graduated in one of the twelve majors selected for study, 2) those who graduated, but changed their major to something outside the selected twelve, 3) those who graduated, but outside a six year limit, and 4) those who did not graduate (this will include those who dropped out or transferred or are simply still working on their degree). Note that by limiting the sample to students enrolled before or during 2004, we include all students who should have graduated in less than six years by 2010.
For uniformity in the sample, we selected twelve majors from the College of Arts and Sciences (CAS). They are: Biology, Chemistry, Computer and Information Sciences, Economics, English, History, Mathematics, Philosophy, Physics, Political Science, Sociology and Spanish. The total sample contained 9,934 students of which 2,474 did not graduate and 746 took more than six years to obtain their degree. The resulting analysis sample contains 6,714 students (although 2,249 lacked SAT or ACT scores, or graduated in some major outside the twelve selected for analysis). The final sample contained 4,420 students over all twelve majors. Of those, only 336 lacked high school GPAs, producing a total sample size of 4,084 students. Table 1 lists the total numbers for the sample by major, mean GPAs and SAT scores.
| Major | N | GPAtotal | GPAupper | SATM | SATR | SATM+R | GPAHS |
|---|---|---|---|---|---|---|---|
| All Majors | 4420 | 3.200.50 | 3.270.53 | 55685 | 57290 | 1128155 | 3.450.43 |
| Biology | 521 | 3.280.44 | 3.360.47 | 59774 | 59082 | 1188133 | 3.650.38 |
| Chemistry | 84 | 3.350.42 | 3.210.50 | 62377 | 61088 | 1232147 | 3.790.26 |
| CIS | 25 | 3.290.50 | 3.410.59 | 63559 | 59090 | 1225119 | 3.610.30 |
| Economics | 445 | 2.950.54 | 2.970.63 | 56981 | 53098 | 1099157 | 3.350.44 |
| English | 572 | 3.280.46 | 3.320.46 | 55279 | 60881 | 1160141 | 3.480.42 |
| History | 500 | 3.270.45 | 3.290.45 | 54880 | 58579 | 1133141 | 3.430.43 |
| Mathematics | 60 | 3.480.49 | 3.230.68 | 66262 | 64182 | 1304125 | 3.600.52 |
| Philosophy | 164 | 3.290.45 | 3.360.44 | 57777 | 60484 | 1181141 | 3.390.42 |
| Physics | 77 | 3.220.55 | 3.160.56 | 64770 | 62177 | 1269131 | 3.570.50 |
| Political Science | 728 | 3.180.50 | 3.210.55 | 54380 | 57483 | 1117145 | 3.360.43 |
| Sociology | 744 | 2.980.52 | 3.180.54 | 50880 | 52286 | 1031147 | 3.310.41 |
| Spanish | 500 | 3.450.40 | 3.610.40 | 55279 | 57285 | 1124146 | 3.570.38 |
Student GPA was calculated in two ways. The traditional quantity, GPAtotal, uses all courses taken regardless of course title or credit hours. Courses marked ’P’ (pass), ’N’ (no pass), ’W’ (withdraw), ’Y’ (no grade reported) or ’I’ (incomplete) were ignored in our analysis. GPAupper, a measure of upper division performance in a specific subject, was calculated using only courses in the student’s major, at or above the 300 level. Upper division GPA presumably reflects mastery of a chosen field of study. In the few cases where a student was a double major, upper division GPA was calculated twice for each major and recorded as separate data points. The set of upper division courses for Mathematics and CIS (Computer and Information Sciences) were restricted to a subset of courses that are considered rigorous and are typically prerequisites for post-graduate study.
As outlined in greater detail in the appendix, the ability to perform the analysis in this paper, particularly the separation of GPA for upper division courses, required a combination of knowledge of student records, access to lists of majors over various years, network tools to extract the necessary data, software tools to interpret the data, and an understanding of data reduction of large datasets. Most of the analysis involved in this study could not have been produced by simple SQL commands to various databases supported by student record software. In particular, typical access to student records in the current UO network environment is through webpages. Analysis of large numbers of student records requires the parsing and interpretation of HTML, generating structured data from unstructured sources.
2.1 SAT/ACT conversion and reliability of SAT scores
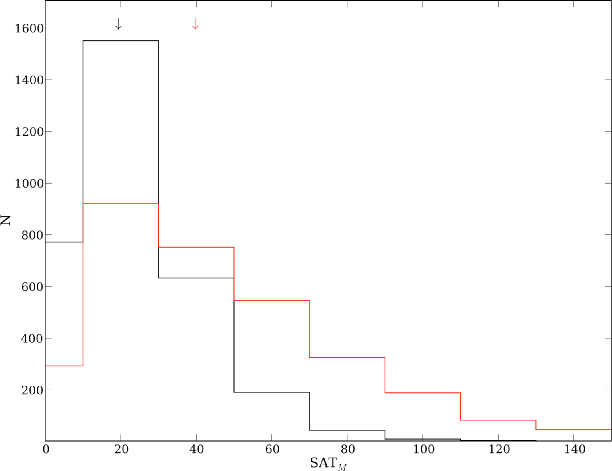
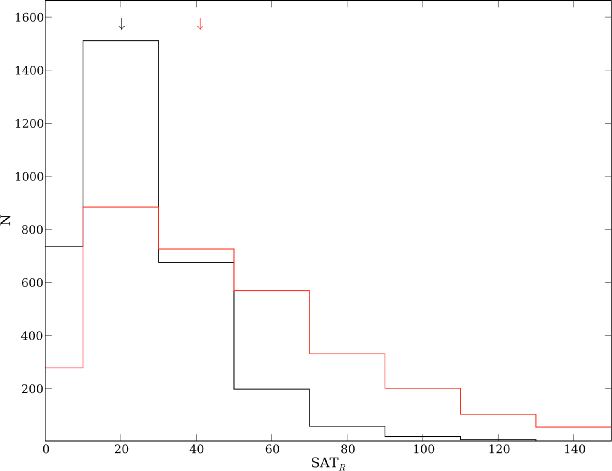
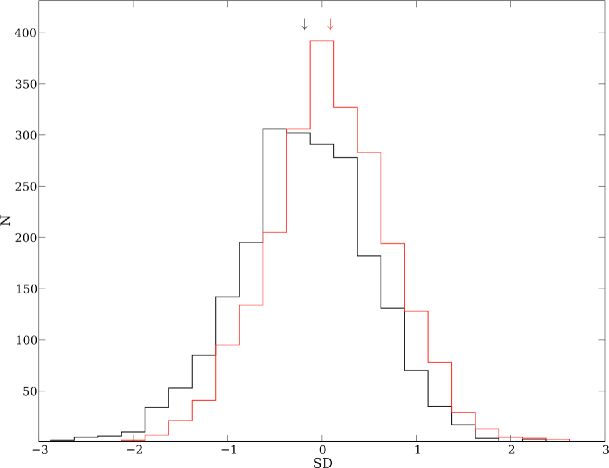
From the final sample, 4,179 () had SAT scores. The rest had ACT scores, which we converted to SAT values using standard ACT to SAT concordance tables. In aggregate, our sample contains 8,085 students with SAT scores or converted ACT scores. Of these students, 2,486 took the Math and Reading components twice, 562 took them three times, 114 took them four times, 31 took them over 5 times. This allows us to analyze the effect of multiple re-tests of the SAT by looking at the mean score versus the peak score and the minimum score versus the peak score. This analysis is shown in Figures 1 and 2, and demonstrates that, on average, re-taking the SAT only improves scores by 20 to 30 points per section. The use of average vs. peak SAT score has little impact on our subsequent analysis.
In addition, from our initial search samples, we have 740 students with SAT scores and recent GRE scores (typically graduating seniors applying for admission to graduate programs). The composite SAT scores range from 800 to 1550 The SAT and GRE scores are highly correlated (with R values of roughly 0.75 for both Math and Reading) and a correlation slope near unity. This correlation is somewhat lower than the .86 obtained in Angoff (1990), however that study was conducted before the 1995 re-centering of the SAT.
2.2 SAT Scores for Graduates versus Non-Graduates
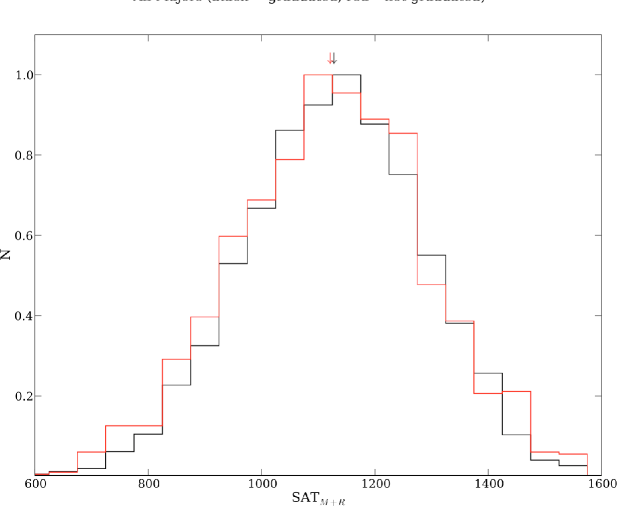
Figure 3 displays the composite SAT scores (math plus critical reading) for students graduating from UO within one of the twelve majors (4,420 students) versus those students who did not graduate (2,474 students). Note that this includes the entire population of students who may have transferred to other schools with better (or different) programs, as well as students who left college entirely. Based on overall UO attrition rates, we suspect that most of the non-graduates actually left the university, although we do not have precise data to support this. Interestingly, the distribution of SAT scores for both populations is identical. Not only do the means agree within the errors, but also the variance and shape of the distributions are identical. We conclude that, as a population, students leave college for reasons unrelated to their cognitive ability.
In comparison, high school GPA (GPAHS) is a better predictor of graduation probability. Figure 4 displays the distribution of HS GPA for the same populations in Figure 3. There is a clear shift in the peaks of the histograms, to lower GPAHS for the students that did not graduate. This may reflect a lack of ability to perform in a classroom setting. Retention efforts at various universities should concentrate on students with low high school GPAs rather than SAT scores.
3 SAT versus upper division GPA
The core of this project is to examine the relationship between entering student SAT score and academic success. We measure academic success in terms of grades in courses within a student’s major. To this end, we define an upper GPA (GPAupper) for in-major classes with course numbers greater than 300 (i.e., upper division classes). This procedure ignores grades outside their major and any courses below the level of 300. Our objective is to isolate a metric which correlates with mastery of an academic subject. For example, most programs require a GPA of 3.8 for selection of graduation with honors.
While we expect that upper GPA is correlated with total GPA, we cannot ignore the fact that grade inflation, and its counterpart, diluted course content, are particularly systemic in the lower division classes. This makes lower division courses a much poorer measure of academic success due to the large range in course type, grading, content and instructor quality.
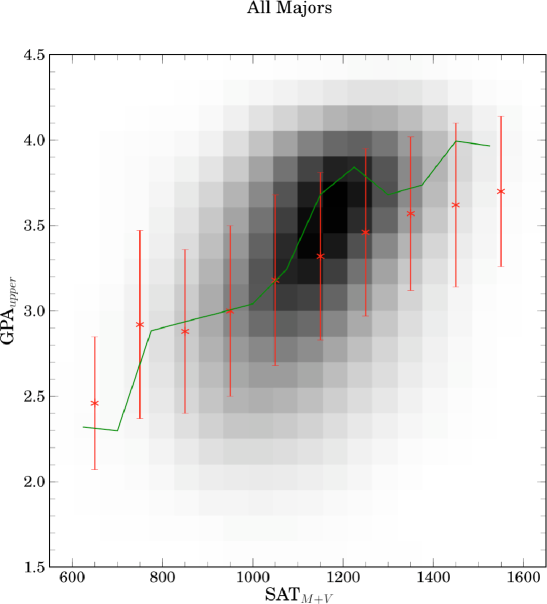
The resulting plot of SAT score versus GPAupper for all majors (4,420 students) is shown in Figure 5. Due to the large number of data points, a scatter plot is not the best choice for conveying visual information. Instead, we plot the data as a normalized density distribution. Each data point is treated as a small 2D gaussian with standard deviation equal to the size of a (small) selected grid cell. Each grid cell has a value determined by summing the value of all the gaussians at the cell’s center point. This results in a greyscale plot where darker cells represent more data. The shading intensity of each cell provides additional visual information beyond the position of the cell within the two variable space.
The greyscale image shows the distribution of SAT versus GPAupper scores for our entire sample. There is a clear trend for increasing SAT score with increasing GPA (R=0.40). Also displayed on this plot are the moving averages in GPA (the red symbols and the errors bars of one standard deviation) and the peak density positions (the green line). All three demonstrate an increase in GPA with larger SAT score.
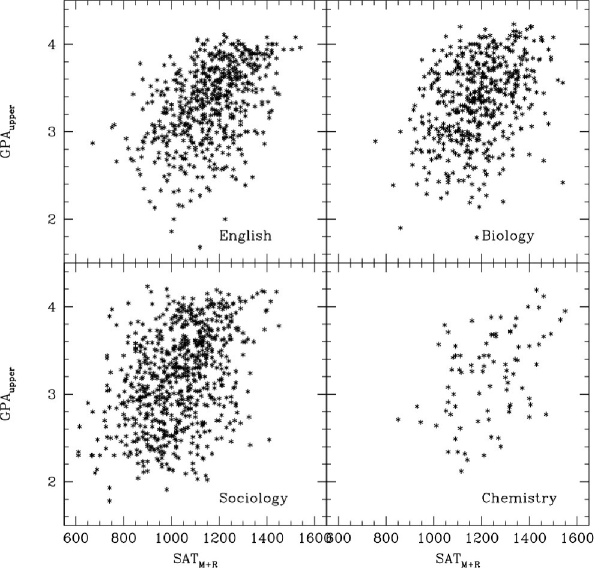
The same analysis can be performed on any of the twelve majors. All of the relevant plots can be found at our website (http://abyss.uoregon.edu/js/sat). For reference we display the SAT versus GPA plots of English, Biology, Sociology and Chemistry in Figure 6. While the same general trends of increasing SAT score with increasing GPA are seen in all the majors, each major exhibits subtle differences which may reflect the nature of their various degree programs. For example, Sociology has more students in the upper left portion of the diagram (low SAT score, high GPA) than other majors. English has fewer low GPA students than other majors.
For the sake of later discussion, we divide the SAT vs GPA diagram into four areas; upper left and right, lower left and right. Clearly, the upper right and lower left portions of the diagram are populated by students within normal expectations, i.e., they are performing as one might expect given their SAT scores. The upper left and lower right display populations that, to some degree, deviate from expectations. The lower right represents students who struggle in college, despite having superior SAT scores.
The upper left portion of the diagram represents the most interesting population of students, those who over-perform in their majors relative to the expectations from their SAT scores. We refer to these students as overachievers, suspecting that their high performance may be due to factors such as conscientiousness or personal motivation. We return to this population later in our study.
3.1 Best Fit Predictor: SAT + GPAHS
There are significant correlations between SAT score and GPAupper as well as between GPAHS and GPAupper. Since SAT and GPAHS are not perfectly correlated, we expect that some combination of SAT score and GPAHS will exhibit an even stronger correlation with GPAupper. To construct this optimal predictor, we first normalize SAT scores and high school GPA to their various means and standard deviations ( score). We then test a range of linear combinations searching for the values which maximize the correlation against upper GPA. These fractional values (, ) are shown in Table 2 for each major, where the combination is expressed as . Table 2 also displays the correlation coefficient for GPAupper versus SAT (, ) and the correlation coefficient for GPAupper versus GPAHS (, RGPA).
A plausible hypothesis for overachievers is that they overcome cognitive deficiencies through conscientiousness and hard work. We would expect these behavioral qualities to be present already at the high school level, and reflected in high school grades. Thus, we expect that these same academic behavior advantages would also carry over into college performance.
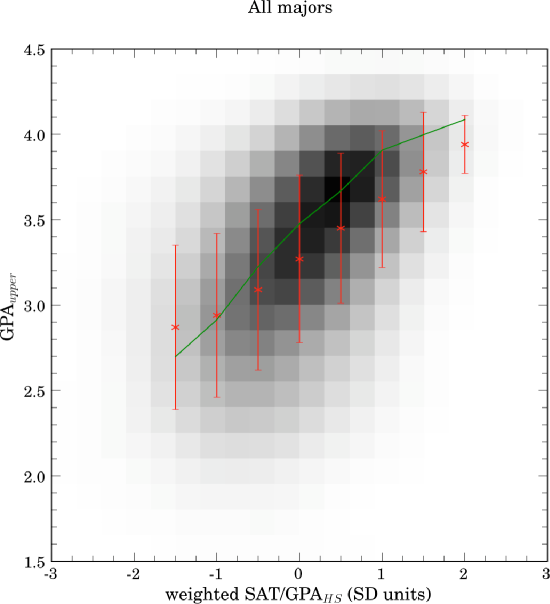
The data in Table 2 show a modest improvement in prediction of academic success using both SAT score and high school GPA. While there is some variation between different majors (e.g., Philosophy versus Sociology), the best predictor is typically obtained for nearly equal weighting of SAT and high school GPA. This two component model is shown graphically in Figure 7.
| Major | ||||
|---|---|---|---|---|
| All Majors | 0.40 | 0.46 | 0.61 | 0.52 |
| Biology | 0.36 | 0.40 | 0.61 | 0.47 |
| Chemistry | 0.36 | 0.40 | 0.52 | 0.45 |
| CIS | 0.00 | -0.09 | 0.11 | -0.01 |
| Economics | 0.49 | 0.43 | 0.44 | 0.57 |
| English | 0.44 | 0.46 | 0.52 | 0.57 |
| History | 0.36 | 0.43 | 0.61 | 0.48 |
| Mathematics | 0.46 | 0.27 | 0.31 | 0.48 |
| Philosophy | 0.42 | 0.29 | 0.31 | 0.44 |
| Physics | 0.40 | 0.37 | 0.51 | 0.48 |
| Political Science | 0.43 | 0.46 | 0.53 | 0.54 |
| Sociology | 0.40 | 0.54 | 0.71 | 0.58 |
| Spanish | 0.45 | 0.48 | 0.54 | 0.56 |
3.2 Underachievers and Overachievers
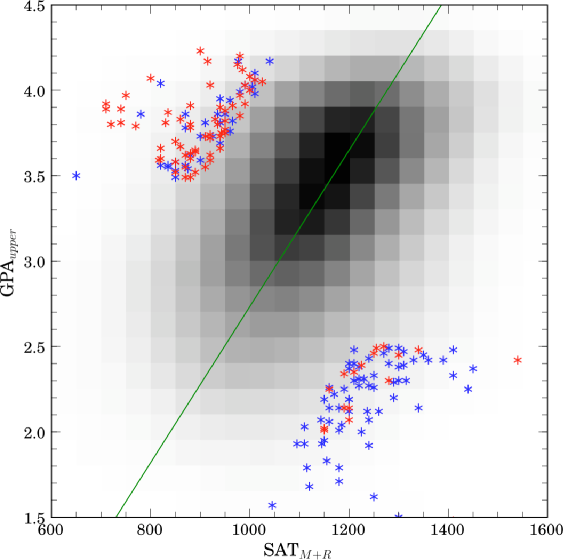
We previously defined overachievers as students who entered the university with low SAT scores, but earned high upper division GPAs. Similarly, the underachievers had high SAT scores but performed poorly in college. We further refine our definition of these groups as follows. In Figure 8, which displays upper GPA versus combined SAT, we fit a line to the ridge of highest density (green curve). We then calculate the standard deviation of population density distribution in the direction perpendicular to this line. Students that lie more than +1.25 SD above the line (with GPAs greater than 3.5) are defined as overachievers, and those who are more than -1.25 SD below the line (with GPAs less than 2.5) are defined as underachievers. The outcome of this procedure is displayed in Figure 8, in which the overachievers are in the upper left (red are female students, blue are male students) and the underachievers are in the lower right.
An analysis of the two populations reveals that overachievers are predominantly (64 percent) female and underachievers are overwhelmingly (79 percent) male. See Figure 8 for gender distributions; note the overall population of our data set has a male:female ratio of 45:55. Table 3 and 4 display the breakdown by major and gender for the over and underachievers. Social sciences dominate both categories, although one should be careful in considering the distribution by major. We defined over- and underachievers relative to the GPA vs. SAT trend computed across all 12 majors. Some majors, whose average upper GPAs deviate from the group average, will tend to overpopulate one of the two groups. For example, Spanish has a high average upper GPA (3.61) and economics has a low one (2.97). This contributes to the overrepresentation of Spanish majors among the overachievers, and of economics majors among the underachievers. If our primary interest were the distribution among majors, we could correct for these variations in average upper GPA by converting to SD units relative to mean for each major. Note that Sociology, which contributes the single largest group of overachievers, has an average upper GPA of 3.18, which is close to the average of 3.20 for the 12 majors as a whole. Thus, in the case of Sociology, the overrepresentation of overachievers is not due to systematically higher grades.
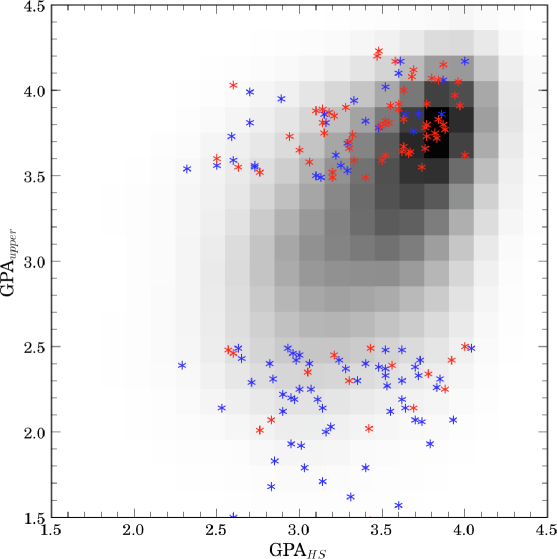
One might guess that these two groups could be identified using high school GPA. Figure 9, in which the horizontal axis is GPAHS, shows a wide range for both populations. Many of the underachievers have low high school GPA relative to what their SAT scores would have predicted, and lower than the average for admitted UO students. Figure 10 shows that women tend to outperform men in upper GPA at any fixed value of SAT score. This is related to the fact that women admitted to the University tend to have higher high school GPAs. In the best fit predictive model we discussed above, women would have higher combined (SAT + HSGPA) z scores than men at fixed values of SAT score.
| Male | Female | Total | |||
|---|---|---|---|---|---|
| 1 | Biology | 1 | Biology | ||
| 3 | Economics | 2 | Economics | 5 | Economics |
| 1 | English | 1 | English | 2 | English |
| 3 | History | 3 | History | 6 | History |
| 2 | Philosophy | 2 | Philosophy | ||
| 7 | Political Science | 6 | Political Science | 13 | Political Science |
| 9 | Sociology | 29 | Sociology | 38 | Sociology |
| 9 | Spanish | 20 | Spanish | 29 | Spanish |
| Male | Female | Total | |||
|---|---|---|---|---|---|
| 5 | Biology | 4 | Biology | 9 | Biology |
| 2 | Chemistry | 1 | Chemistry | 3 | Chemistry |
| 1 | CIS | 1 | CIS | ||
| 20 | Economics | 1 | Economics | 21 | Economics |
| 4 | English | 3 | English | 7 | English |
| 7 | History | 2 | History | 9 | History |
| 6 | Mathematics | 6 | Mathematics | ||
| 1 | Philosophy | 1 | Philosophy | 2 | Philosophy |
| 5 | Physics | 1 | Physics | 6 | Physics |
| 14 | Political Science | 3 | Political Science | 17 | Political Science |
| 4 | Sociology | 2 | Sociology | 6 | Sociology |
4 Evidence for Cognitive Thresholds
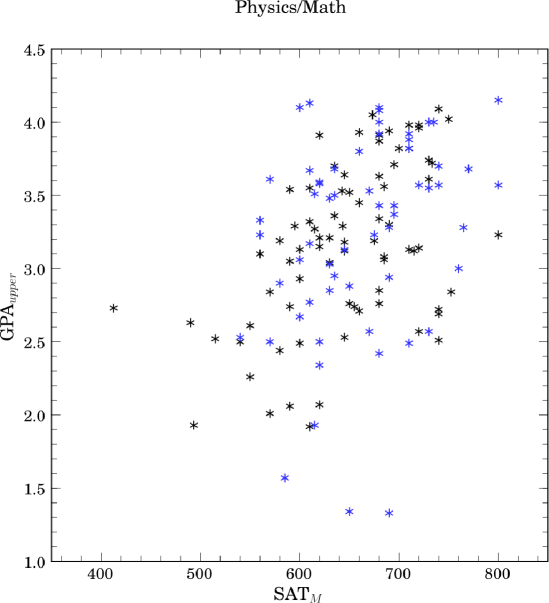
One might reasonably associate mastery of a subject with GPA 3.5 – roughly, the minimum threshold to be admitted to graduate school (i.e., students who earn equal numbers of A’s and B’s in their upper division core courses are borderline for most graduate programs). We find that in Physics and Mathematics no student with SATM less than roughly 600 was able to attain this level of mastery.
Figure 11 shows the upper division in-major GPAs of UO physics and math graduates from a 5 year period. The math GPAs were computed using a specific set of rigorous courses taken by graduate school bound majors. The figure provides at least modest evidence for a minimum cognitive threshold required for physics and mathematics. That is, the a priori probability that a student with SATM 600 will perform well enough to be admitted to graduate school in these subjects is extremely low. Note many poorly performing students switch majors, and hence do not populate the lower left corner of our graph.
A simple but plausible model for college performance includes (at least) two factors: 1. ability (measured by SAT) and 2. conscientiousness or effort (for simplicity, an uncorrelated random variable, probably normally distributed). In one version of this model the predicted GPA might depend linearly on the sum of the two factors, each measured in standard deviation (SD) units. (This is similar to the GPA predictor depicted in Figure 7.) Applying such a model to our data, we would conclude that even a student in the, e.g., 90th percentile of work ethic has a low probability of attaining mastery if their SATM score is below 600.
To reiterate, SAT 600 seems to be the lowest score at which even a very motivated student has a chance for mastery. From the data one might guess that only for SATM well above 700 do students have more than a 50 percent chance of obtaining GPA 3.5. That is, a student with average motivation or conscientiousness probably needs SATM well above 700 to have a high probability of obtaining mastery.
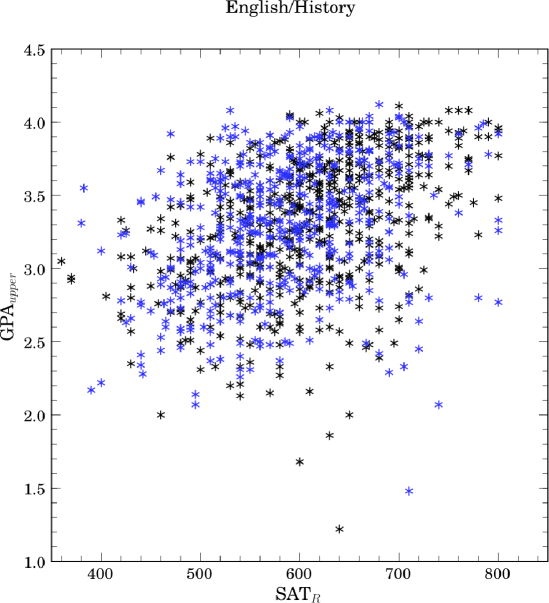
We were unable to find any similar threshold (either in SATR or SATM) in other majors, including economics, sociology, history, philosophy, biology, chemistry, etc. For example, Figure 12 is the analogous plot for English (black) and History (blue) majors versus SATR (verbal). If a threshold exists it is probably at SATR of 450 or so.
For the total SAT-taking population, an SATM score of 600 is about 75th percentile. For the overall population, it might be roughly 85th percentile (the result depends on assumptions concerning the pool of test takers versus the general population). SATM of 750 is roughly 98th percentile for the total SAT-taking population.
5 Clark Honors College and the elites
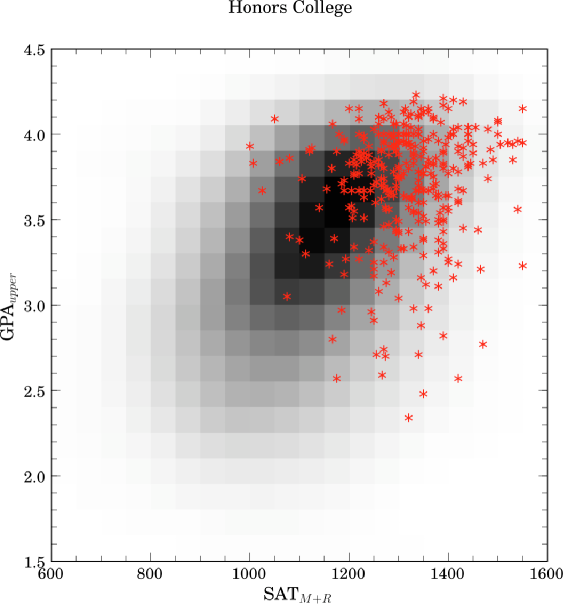
The University of Oregon is home to Clark Honors College (CHC), one of the oldest honors colleges in the country. Students must apply separately to CHC, and admission is competitive: enrolled students have average SAT of 1340 and unweighted high school GPA of 3.9. In terms of selectivity, the CHC is roughly comparable to Cornell or UC Berkeley. CHC students must fulfill additional rigorous course requirements beyond those required by their major. Their willingness to do so suggests that, in terms of drive and ambition, they are more similar to students at elite universities than other UO students with similar SAT and high school GPAs.
The performance of CHC students (red dots) relative to the broader UO population is shown in Figure 13. The average upper GPA of CHC students is 3.7, versus 3.2 for the entire UO population. This graph plausibly describes how a group of Berkeley or Cornell students might do at Oregon. It suggests that UO students with high in-major GPAs have subject mastery similar to the better students at elite universities. Note that this high GPA population includes many overachievers who entered the university with low SATs, low high school GPA or even both. These overachieving students would have had almost zero probability of admission to an elite university, an illustration of the imperfections of our system of elite higher education.
Using our data, we can estimate how a population of elite college students (e.g., from the Ivy League) might perform at a typical state university. Students from universities at least as selective as the CHC would be expected to earn an average upper GPA similar to the 3.7 of CHC students. This suggests that an average grade of B+ or even A- does not constitute unreasonable grade inflation at an elite university, if the grade averages are meant to be commensurate (in the performance or subject mastery they represent) with those at less selective universities. Similarly, one could argue that public university graduates with high GPAs (e.g., above 3.7) likely have levels of subject mastery similar to those of elite graduates.
6 Conclusions
SAT scores have strong predictive power, if the quantities to be predicted are carefully defined so as to measure actual academic achievement. The examples studied in this paper are upper division, in-major GPA and, more generally, GPA in specific groups of courses, yielding correlations in the 0.35-0.5 range. The often quoted low correlation (roughly 0.3) between SAT and freshman GPA is subject to self-sorting effects and variation in course difficulty (students with high academic ability are likely to take more challenging freshman courses).
The cognitive abilities measured by the SAT seem quite stable: in cases where GRE scores are available, the correlation between GRE score (measured 4+ years later) and SAT is high (roughly 0.75 for both reading and math). This is consistent with the results from IQ studies (Jensen 1998).
Below we summarize our most important results.
1. SATs predict upper GPA with correlations in the 0.35 – 0.50 range.
2. Overachievers exist in most majors, with low SAT scores but very high GPAs. These overachievers are disproportionately female.
3. Underachievers exist in all majors, with high SAT scores but very low GPAs. These underachievers are disproportionately male.
4. Some majors, like math and physics, may exhibit a cognitive threshold – mastery of the material is unlikely below an ability threshold (as measured by SATM), no matter how hard the student works.
5. Students at public universities, like UO, with high upper GPA (e.g., 3.7 or greater) likely have subject mastery similar to graduates of elite universities. Elite college students who transferred to a state university would likely average upper division GPAs of 3.7 or greater.
Appendix A APPENDIX
This study required extensive access to online student records, flexible network tools and innovative analysis routines. Almost all the information used in this project was extracted from student on-line transcripts, but using automated tools. Without those tools the human labor involved would have been prohibitive. The data used in our analysis, in particular for upper division GPA by major, was not available in any SQL database.
Briefly, the data reduction for this study contains three parts. The first part is the acquisition of student IDs for the academic terms of interest in the majors we selected. This was accomplished using a simple SQL query to UO’s Student Data Warehouse, where we selected all students active in the Fall terms from 2000 to 2004 for the twelve majors. Selecting by major lowered the total number of transcripts that had to be queried in the next stage of the data extraction process.
The second stage was to acquire transcripts, SAT/ACT scores and high school GPAs from Duckweb servers. Duckweb allows advisors to examine individual student records using a browser. In our case, we wanted all the student information stored on our local machines, so a special set of network tools was used to extract the relevant pages and download them to a local machine. These tools were developed for a NASA data mining project focused on large online datasets. Access to modern data repositories is often via webpages and CGI interfaces. The tools we used have the ability to behave like a web browser, but with the advantage of not having to wait for human input. They act under automatic control, making decisions based on a set of user defined conditions.
For Duckweb access, the Python module urllib was sufficient to navigate the series of web pages leading to individual student transcripts of interest. Standard CGI security prevents a user from going directly to a particular webpage (i.e., you cannot navigate directly to the URL addresses for student records) through the use of cookies. Fortunately, urllib automatically handles the processing of cookies as long as the script follows the same path of webpages that an interactive user would. The primary difference between a script and a human user is, of course, the speed of interaction with the server. In order to avoid triggering DOS (Denial of Service attack) alerts, the scripts were run late at night and included pause statements in the chain of commands so as not to tax the servers. The extraction of 25,000 student records only required an evening of interaction. Whereas the scripts could have obtained this information in only a few tens of minutes, the process was deliberately slowed and took several hours.
The last stage of our analysis involved parsing the HTML files on each student into some meaningful dataset (e.g., XML format or raw ASCII). Once in a usable format, we continued our analysis using standard tools for astronomical research (means, correlations, plotting, linear fitting). Often HTML pages contain embedded information tags which facilitate converting the pages into XML format. In Duckweb web data, the HTML tags are only used for browser formatting. A simple Python re (regular expression) command strips all the HTML tags from the page. The remaining text is simple to process for courses, grades, dates, etc.
All of these steps were accelerated by the Python scripting language. The Python language has several advantageous features. For example, Python’s unique try/except feature allows for unknown conditions in the datasets to be handled without crashing the analysis. Python’s modular nature allows for network, statistical and plotting features to be seamlessly integrated without producing an unmanageable amount of code. In this study, none of the scripts were over 50 lines in length, giving us the ability to consider a range of research questions without being limited by pre-existing software tools.
References
- (1)
- (2) Berry, C. M. & Sackett, P. R. (2009). Individual differences in course choice result in underestimation of college admissions system validity. Psychological Science, 20, 822-830.
- (3)
- (4) Jensen, A. (1998). The g factor: the science of mental ability, Arthur R. Jensen; Praeger Publishers.
- (5)
- (6) Noftle, Erik E. & Robins, Richard W. (2007) Personality Predictors of Academic Outcomes: Big Five Correlates of GPA and SAT Scores, Journal of Personality and Social Psychology. Vol 93(1), 116-130.
- (7)
- (8) Park, G., Lubinski, D., & Benbow, C. P. (2008). Ability differences among people who have commensurate degrees matter for scientific creativity. Psychological Science, 19, 957-961 ; Lubinski, D., and Benbow, C. P. (2006). Study of Mathematically Precocious Youth after 35 years: Uncovering antecedents for the development of math-science expertise. Perspectives on Psychological Science, 1, 316-345.
- (9)
- (10) Sackett, Paul R., Borneman, Matthew J. & Connelly, Brian S (2008) . American Psychologist. High Stakes Testing in Higher Education & Employment, Vol 63(4), 215-227.
- (11)
- (12) Angoff, William H. & Johnson, Eugene G. (1990) The Differential Impact of Curriculum on Aptitude Test Scores. Journal of Educational Measurement, Vol. 27, No. 4, 291-305.
- (13)