Long-term multi-wavelength studies of GRS 1915105
I. A high-energy and mid-infrared focus with RXTE/INTEGRAL and Spitzer
Abstract
To date, mid-infrared properties of Galactic black hole binaries have barely been investigated in the framework of multi-wavelength campaigns. Yet, studies in this spectral domain are crucial to get complementary information on the presence of dust and/or on the physical processes such as dust heating and thermal bremsstrahlung. Here, we report a long-term multi-wavelength study of the microquasar GRS 1915105. On the one hand, we aimed at understanding the origins of the mid-infrared emission, and on the other hand, at searching for correlation with the high-energy and/or radio activities. We observed the source at several epochs between 2004 and 2006 with the photometer IRAC and spectrometer IRS, both mounted on the Spitzer Space Telescope. When available, we completed our set of data with quasi-simultaneous RXTE/INTEGRAL high-energy and/or Ryle radio observations from public archives. We then studied the mid-infrared environment and activities of GRS 1915105 through spectral analysis and broad band fitting of its radio to X-ray spectral energy distributions. We detected polycyclic aromatic hydrocarbon molecules in all but one IRS spectra of GRS 1915105 which unambiguously proves the presence of a dust component, likely photoionised by the high-energy emission. We also argue that this dust is distributed in a disc-like structure heated by the companion star, as observed in some Herbig Ae/Be and isolated cool giant stars. Moreover, we show that some of the soft X-ray emission emanating from the inner regions of the accretion disc is reprocessed and thermalised in the outer part. This leads to a mid-infrared excess that is very likely correlated to the soft X-ray emission. We exclude thermal bremsstrahlung as contributing significantly in this spectral domain.
1 Introduction
In a multi-wavelength study of microquasars, the infrared presents a particular interest as the accretion disc, the jets, or the companion star may all be detected. Nevertheless, most of the previous studies focused on the accretionejection phenomena as seen is X-ray/near-infrared/radio correlations, and did not take the mid-infrared (MIR) emission into account (see e.g. Mirabel et al., 1998; Ueda et al., 2002; Corbel & Fender, 2002; Corbel et al., 2003; Chaty et al., 2003; Homan et al., 2005; Chaty & Bessolaz, 2006; Russell et al., 2006). Yet, getting both MIR photometric and spectroscopic information is crucial to investigate the presence of dust, the disc illumination, thermal bremsstrahlung from the accretion disc’s wind, or the contribution of relativistic ejecta.
1.1 GRS 1915105
Discovered by the WATCH all-sky X-ray monitor on board the GRANAT satellite, on 1992 August 15 (Castro-Tirado et al., 1992, 1994), GRS 1915105 is the first microquasar in which apparent superluminal radio ejecta were detected (Mirabel & Rodriguez, 1994). The nature of its companion star was the subject of debate until Greiner et al. (2001b) unambiguously showed that it was a K/M red giant by detecting CO absorption features in its near-infrared (NIR) spectrum. Moreover, the orbital period of the system and the mass of the compact object were found to be days (recently refined to day, Neil et al., 2007) and , respectively (Greiner et al., 2001a). The inclination is , and estimates of the distance fall in the range 612 kpc (Chaty et al., 1996; Fender et al., 1999; Chapuis & Corbel, 2004).
GRS 1915105 is strongly variable, on time scales from seconds to days. Using extensive RXTE timing observations, Belloni et al. (2000) showed that its X-ray behaviour could be divided in 12 distinct luminosity classes (up to 14 today, Klein-Wolt et al., 2002; Hannikainen et al., 2003), and that the source was carrying out transitions between three canonical spectral states, labelled A, B (strong disc domination), and C (corona-dominated, no disc). Previous multi-wavelength studies showed the existence of a strong connection between the accretion disc instabilities and plasma outflows. In particular, discrete ejecta, emitting through optically thin synchrotron, are believed to be triggered during the transition between the C and A states, expanding adiabatically in the environment and detectable gradually from the NIR to the radio domains (see e.g. Mirabel et al., 1996; Fender et al., 1997; Mirabel et al., 1998; Eikenberry et al., 1998, 2000; Rodriguez et al., 2008a, b). Moreover, the other known class of radio ejecta the compact jets, emitting simultaneously from the radio to the NIR through optically thick synchrotron are only detected in the luminosity class, which is only seen in the C state. The presence of such a jet is characterised by a flat spectrum with a roughly constant flux density between 50 and 100 mJy. Long periods of the luminosity class during which compact jets are present are called plateau, and often precede or follow a giant ejection (see e.g. Foster et al., 1996; Pooley & Fender, 1997; Fender et al., 1999; Dhawan et al., 2000; Klein-Wolt et al., 2002; Fuchs et al., 2003b).
1.2 Previous MIR studies of microquasars
Koch-Miramond et al. (2002) presented an ISO spectrophotometric study of Cygnus X3 in quiescence,
and found the MIR continuum to be due to free-free emission from the winds of the Wolf-Rayet companion star
with perhaps a contribution from a cold dust component (see Fuchs et al., 2006, for similar conclusions on SS 433). Moreover, Fuchs et al. (2003a) reported ISOCAM photometric data of the GRS 1915105 obtained at two different epochs, during a flaring activity and a plateau state. On the one hand, they showed that, despite strong uncertainties, the MIR flux of GRS 1915105 had likely increased between the two observations, and they argued that during the plateau, the MIR emission of the source was likely due to a compact jet, without excluding bremsstrahlung. They, on the other hand, excluded the contribution of dust, which is the opposite of the conclusion reached by Muno & Mauerhan (2006) to explain the MIR excess they detected in the Spitzer/IRAC SEDs of A062000 and XTE J1118+480 in quiescence. Finally, Migliari et al. (2007) argued that X-ray/UV irradiation of the disc in the thermal state, and compact jet in the hard state might be responsible for the excess they detected in the MIR emission of GRO J165540; the same conclusion was reached by Gallo et al. (2007) concerning the quiescence of A062000, V404 Cyg, and XTE J1118+480, claiming that dust component is not statistically necessary.
In this paper, we report a long-term multi-wavelength study of GRS 1915105 focusing on its spectroscopic and photometric MIR emission. It aimed at understanding its origins, as well as its possible connection with the high-energy and radio domains. The observations and the data analysis are presented in Sect. 2, while Sect. 3 and Sect. 4 are devoted to the analysis of the broad band X-ray to MIR SEDs of the source built with high-energy and Spitzer data. We discuss the outcomes in Sect. 5 and we give our conclusions in Sect. 6.
2 Observations and data analysis
We performed, between 2004 October 2 and 2006 June 5, 16 photometric and spectroscopic observations of GRS 1915105 with the IRAC photometer and the IRS spectrometer (PI Y. Fuchs), both mounted on the Spitzer Space Telescope. Moreover, we completed our set of MIR observations with quasi-simultaneous high-energy observations, including INTEGRAL data already presented in great detail in Rodriguez et al. (2008a, b) (revolution #373), and several monitoring observations with RXTE (PI Morgan, the data are immediately public). We finally also made use of observations of GRS 1915105 obtained at 15 GHz with the Ryle Radio Telescope (PI G. G. Pooley). Table 1 lists all the data we used in this study. In the following, for each quasi-simultaneous X-ray/MIR/radio observation, we will refer to the integer part of the MIR observation date.
2.1 Spitzer’s MIR observations
GRS 1915105 was observed with IRAC at 3.59, 4.50, 5.80,
and 8.00 m. Each image was the combination of 24 sub-exposures of 10 s each, giving a total
integration time of 240 s in each filter. We performed photometry on the Basic Calibration
Data (BCD) using the software MOsaicker and Point source EXtractor (MOPEX) v18.2.2.
BCD data are raw data on which the Spitzer pipeline performs dark subtraction, multiplexer bleed correction,
detector linearisation, flat fielding, cosmic ray detection, and flux calibration.
We used MOPEX for pointing refinement, mosaicking, coaddition, and fluxes measurement through PSF fitting in a 3-pixel radius aperture.
They were then scaled to a 10-pixel aperture using the aperture-correction factors as given in the IRAC manual111http://ssc.spitzer.caltech.edu/irac/dh/iracdatahandbook3.0.pdf. The source was always detected,
in all filters, and the absorbed fluxes are listed in Table 2. The uncertainties include the 3% systematic errors due to flux calibration instabilities (Reach et al., 2005).
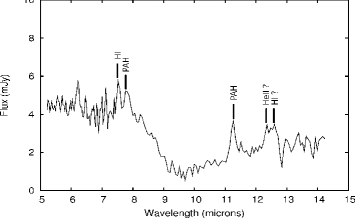
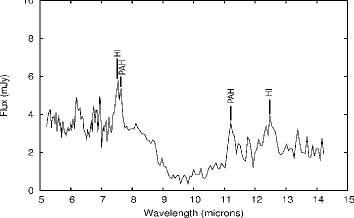
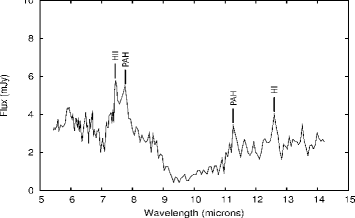
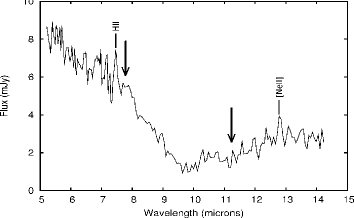
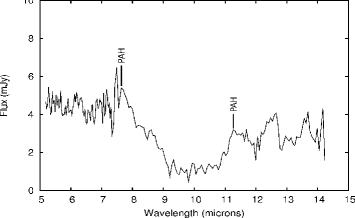
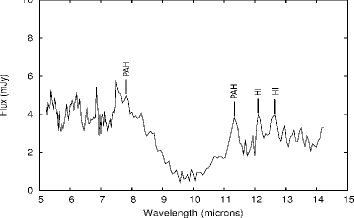
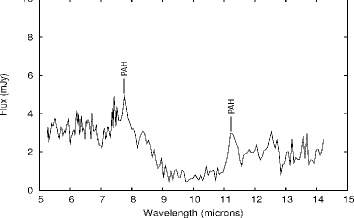
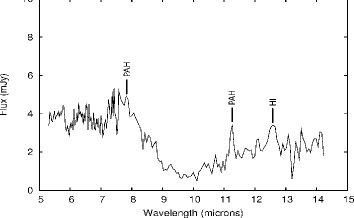
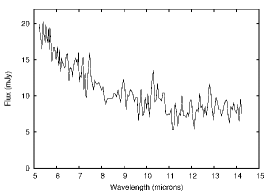
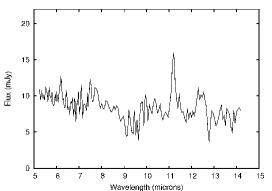
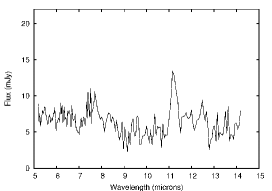
Spectroscopy was performed with IRS using the SL2 ( m), SL1 ( m), LL2 ( m) and LL1 ( m) modules with the IRS Peak-up option for a better pointing accuracy. Total exposures times were set to 120 s, divided in 2 sub-exposures in SL1 and SL2, and 300 s, divided in ten sub-exposures in LL1 and LL2. BCD data were reduced following the standard procedure given in the IRS Data Handbook 222http://ssc.spitzer.caltech.edu/irs/dh/dh32.pdf. The basic steps were bad pixel correction, sky subtraction, as well as extraction and calibration (wavelength and flux) of the spectra with the Spitzer IRS Custom Extraction software Spice v2.1.2 for each nod. Spectra were then nod-averaged to improve the signal-to-noise ratio (SNR). In SL1 and SL2, GRS 1915105 was always detected with SNRs good enough to allow spectroscopic features identification (SNR10), as shown in Figure 1. Unfortunately, in LL1 and LL2, we never managed to detect the source.
2.2 RXTE observations
The RXTE data were reduced with the LHEASOFT v. 6.7. All data products were extracted from user’s good times intervals (GTI). GTIs corresponded to times when the satellite elevation was greater than 10∘ above the Earth limb, the offset pointing less than 0.02∘, and proportional counter unit #2 was active. In order to identify the classes, we extracted 1s resolution light curves in the 2–60 keV range and in the three energy bands defined in Belloni et al. (2000), from the Proportional Counter Array (PCA). These bands are 2.05.7 keV (channels 013, PCA epoch 5), 5.714.8 keV (channels 1435), and 14.8 keV (channels 36255). The colours were defined as HR1=5.714.8/2.05.7 keV and HR2=14.860.0/2.05.7 keV. The shift of gain between the different epochs of PCA leads to different absolute values of the count rates, hardness ratios (HR) and position in the colour-colour (CC) diagrams, but the general shape of a given class is easily comparable to those of epoch 3 (Belloni et al., 2000), and therefore allowed us to easily identify the variability class in each observation (see Rodriguez et al., 2008a). 16 s resolution light curves were extracted from standard 2 data between 2.0 and 18.0 keV. All these light curves were corrected for background, using the latest PCA background models available for bright sources. Spectra, including those showing clear spectral variations, were then extracted and averaged over the entire observations for a better spectral fitting.
2.3 INTEGRAL observations
Our study makes use of the INTEGRAL Soft Gamma-Ray Imager (ISGRI, Lebrun et al., 2003) the low energy detector of the Imager On-Board INTEGRAL (IBIS) to cover the 18.0 to keV energy range, and the X-ray monitors JEMX (Lund et al., 2003) to cover the 3.030.0 keV one. The data reduction process can be found in Rodriguez et al. (2008a, b).
2.4 MIR data dereddening
The MIR data were dereddened from an optical absorption (Chapuis & Corbel, 2004) using the extinction laws given in Chiar & Tielens (2006). In their paper, the authors derived the ratio rather than the usual ones. To express the absorption ratio in a standard way, we assigned to the value derived using the extinction law given in Fitzpatrick (1999) for the diffuse ISM (), which is . Although it has recently been demonstrated that the long-believed universal NIR extinction curve showed sharp variations depending on the line-of-sight (Fitzpatrick & Massa, 2009, and references therein), these variations are rather observed outside of the Galactic plane (Galactic centre excluded), and our choice to fix to the value of the diffuse ISM has no strong incidences in the dereddening of the GRS 1915105 data.
Moreover, if the authors give a universal expression up to 8.00 m, they then propose two laws that take silicate absorption at 9.70 and 18.00 m into account. Both differ in the sense that one is valid for the diffuse ISM and the other one for the Galactic centre. Our absorbed MIR spectra exhibit a strong silicate absorption feature at 9.70 m and we tried to deredden each of them using both laws. The best results were systematically obtained with the modelling of interstellar extinction due to the diffuse ISM, the silicate feature in the Galactic centre being too strong.
3 Results
3.1 Light curves
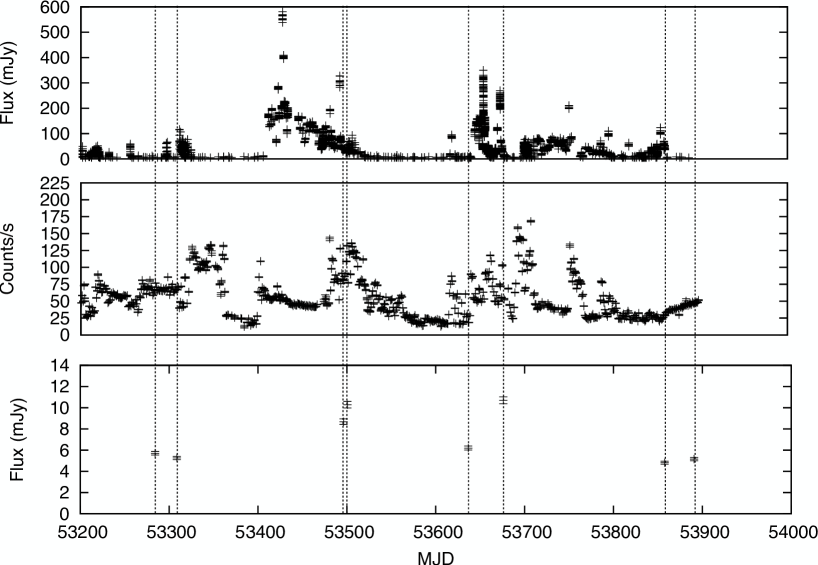
The fluxes listed in Table 2 show that GRS 1915105 is strongly variable in all the IRAC filters, which confirms the variation detected by Fuchs et al. (2003a). The first step of our study was to compare the evolution of the source’s MIR emission with its X-ray and radio ones. Fig. 2 displays the 3.59 m (IRAC), 1.212 keV (ASM) and 15 GHz (Ryle) light curves of GRS 1915105 covering the time interval from MJD 53200 to MJD 53900. Although we cannot claim for a correlation in the existing data, it is noticeable that the source is at its minimum level of MIR emission (or rather the minimum level of our measurements) when the microquasar has a steady and relatively low X-ray activity (around MJD 53280, MJD 53308, MJD 53857, MJD 53890). On the other hand, the maximum level of its MIR emission was measured when the source entered in a quite high and unstable X-ray activity, around MJD 53500 and MJD 53676. This behaviour could be a hint for an X-ray/MIR correlation.
Moreover, the comparison with the Ryle telescope light curve could point towards a bimodal relation between the radio and the MIR activities. Indeed, each time GRS 1915105 is detected at 15 GHz with a flux higher than 22 mJy (MJD 53496, 53500, and 53676), the MIR emission appears to be at its highest, while it is at its lowest when the radio flux is less than 1 mJy (see Fig. 2 and Table 1). Nevertheless, it is important to point out that during all our spectroscopic and photometric observations, GRS 1915105 has never been found in the plateau state; a MIR emission from the compact jets can consequently be excluded from now on. Each time the Ryle flux is high, the source is rather in the decaying phase of a giant discrete ejection, whose emission is optically thin. This MIR/radio bimodal relation is therefore very likely related to the disc activity.
3.2 RXTE/INTEGRAL SEDs
The quasi-simultaneous high-energy spectra were fitted in ISIS v.1.5.0, between 3.0 (6.0) and 20.0 keV for PCA (JEMX), as well as 20.0 and 200.0 keV for ISGRI and HEXTE. In most cases, they were further rebinned so as to obtain good quality spectra. We added 3 % systematic errors to the uncertainties in the JEM-X spectra, 2% to the ISGRI ones and 1% to the PCA ones before the fitting process. In all fits a normalisation constant was added to account for uncertainties in the cross calibration of the instruments.
The model we used during the fitting processes consisted in the combination of a multicolour black body (diskbb, Mitsuda et al., 1984), accounting for the accretion disc emission, a comptonisation component (comptt, Titarchuk, 1994) for the corona and a Gaussian for the iron feature at 6.4 keV when present, all modified by photo-electric absorption (phabs). The column density was fixed at 3.5 atoms cm-2, as measured by Chapuis & Corbel (2004) from radio observations. If this value is consistent with some measurements derived from X-ray observations (see e.g. Ebisawa, 1998; McClintock et al., 2006), several authors derived higher column densities clustered in the range 58 atoms cm-2 (see e.g. Klein-Wolt et al., 2002; Lee et al., 2002). Nevertheless, our attempts with higher values always gave equally good fits and did not change significantly the parameters of the disc and the comptonisation components. Our goal being to fit broad band SEDs including both X-ray and MIR data, we decided to use the same column density value in both spectral domains.
A discussion on the validity of the use of comptt to model the hard X-ray emission can be found in Rodriguez et al. (2008b). Following the authors, the optical depth was fixed to 0.01, the lowest allowed value, when GRS 1915105 was in the states A or B, during which the hard X-ray emission is better fitted by a power law. We made this choice of comptt because the use of a power law strongly overestimates the contribution of the corona at low energy and consequently underestimates the disc’s one, which has consequences in the optical and infrared domains. Moreover, a power law diverges once the data are dereddened, which forbids a spectral fitting from the X-rays to the MIR. on the contrary peaks at and is negligible in the optical and the infrared.
Finally, the Gaussian width was fixed at 0.8 keV and the iron line feature’s energy was allowed to vary between 5.0 and 7.0 keV. Table 3 gives the best-fit parameters found for the spectra obtained on MJD 53280, MJD 53284, MJD 53500, MJD 53676, MJD 53851, and MJD 53890: and are the accretion disc’s temperature and norm, and and are the hard component’s electrons temperature and opacity. The spectra obtained on MJD 63660 and MJD 53661 did not need any disc component but an extra power law. Their best-fit parameters are listed in Table 4.
3.3 X-ray to MIR SEDs: the photometric case
The first step to model the MIR emission of GRS 1915105 was to understand in which extent the IRAC fluxes could be explained by the Rayleigh-Jeans tail of the accretion disc combined with the stellar emission. We then built the X-ray to MIR SEDs of GRS 1915105 with the RXTE/INTEGRAL and IRAC data obtained quasi-simultaneously on MJD 53284 and MJD 53890, i.e. when the measured photometric fluxes of the source were at their lowest. Concerning the latter date, it is worth noting that about 1.2 days separate the IRAC data from the RXTE ones. Nevertheless, the light curve displayed in Fig. 2 shows that between MJD 53890 and MJD 53892, the source had a steadily increasing 1.212.0 keV X-ray emission (with no flares) and that the disc parameters were therefore barely variable.
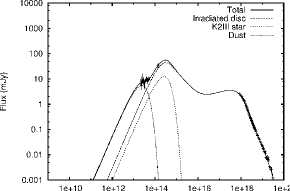
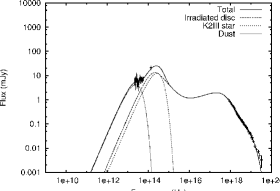
For each SED, the dereddened fluxes were stored in an ASCII file. They were then fitted along with the quasi-simultaneous high-energy data into ISIS, combining a spherical black body (bbodyrad) and the model described above. Greiner et al. (2001b) showed that the companion star of GRS 1915105 was a K/M giant whose temperature is about K, and Harlaftis & Greiner (2004) found that its radius was around 19 . During the fitting process, we then considered two distinct cases:
-
•
first, the temperature was allowed to vary between 2800 to 5000 K, which is the temperature scale of K/M giant stars (see e.g. van Belle et al., 1999). We obtained good fits, but for temperatures that systematically pegged at the minimum allowed, and for stellar radii clustered in the range 3877 depending on the considered distance. This is very unlikely because a giant star with such a low temperature would rather have a radius (Dumm & Schild, 1998; van Belle et al., 1999),
-
•
second, the star’s temperature and radius were fixed to those of a K2 giant star, i.e. 4520 K and 21 as given in van Belle et al. (1999), and the source’s distance was allowed to vary between 6 and 12 kpc. In both cases, the best fits, obtained for a distance of 6 kpc, were unable to completely reproduce the IRAC fluxes as there always was a MIR excess (see the fits displayed in Fig. 3).
We then conclude that even when it is at its lowest, and in absence of any radio activity, the MIR emission of GRS 1915105 cannot be explained only by the companion star and Rayleigh-Jeans tail of the accretion disc. Moreover, on MJD 53500 and MJD 53676, the IRAC fluxes of the source almost doubled compared to their lowest values. It is impossible that this increase comes from the companion star. On the contrary, the disc dominates the 3.0200.0 keV unabsorbed X-ray emission, which was not the case on MJD 53284 and MJD 53890 (Table 3). This therefore suggests a relation between the MIR and the disc activities of GRS 1915105.
4 Origin of the MIR excess of GRS 1915105
Although we excluded contributions from the companion star and the compact jets, the MIR excess we detected as well as the increase of the MIR fluxes of GRS 1915105 may still be explained by (1) the presence of a dust component, maybe heated by the companion star and/or the X-ray/UV emission, (2) thermal bremsstrahlung from the accretion disc’s winds, (3) illumination of the accretion disc, (4) optically thin synchrotron from a discrete ejection.
4.1 A photoionised dust component?
All the IRS SL1/2 absorbed spectra of GRS 1915105 are displayed in Fig. 1, and Table 5 lists all the features we detected. All the measurements were carried out using the task IDEA of the data reduction software SMART v. 6.4.0. The central wavelength , equivalent width , full-width at half-maximum FWHM, flux, and signal-to-noise ratio SNR of each feature were computed through gaussian fitting. The highest source of error on the equivalent width and line flux measurement is due to the continuum, particularly uncertain at these wavelengths. Each time, instead of trying to fit it globally, the continuum was assessed in the vicinity of each feature through a linear function fitting. Several attempts showed that the resulting systematic errors were about 5% of the measured flux, which were quadratically added to the statistical uncertainties.
Along with several H I and H II emission lines that likely originate from the accretion disc, and a strong silicate absorption feature, we detected in each spectrum but the one obtained on MJD 53511, the so-called unidentified infrared features at 7.70 m (with 2 primary components at 7.60 and 7.80 m) and 11.25 m (detected between 11.20 and 11.30 m). These lines are thought to be created by the family of the polycyclic aromatic hydrocarbon molecules (PAH, Leger & Puget, 1984; Puget et al., 1985; Allamandola et al., 1985), which are found in the MIR spectra of many objects with associated dust and gas components illuminated by UV photons.
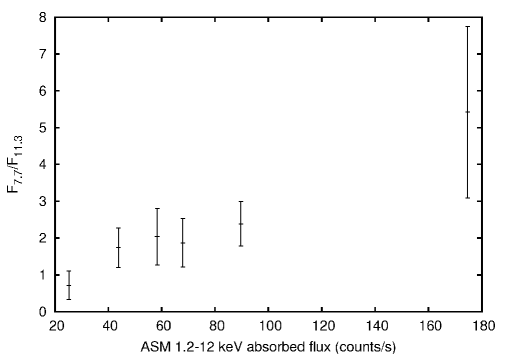
The presence of such features in the MIR spectrum of GRS 1915105 infers that there is dust in the system. Moreover, despite the strong uncertainties, all the PAH lines appear to be strongly variable in flux; this might be related to the photoionisation state of the environment of GRS 1915105. Indeed, the excitation mode of PAH molecules is vibrational; the 7.70 m feature is due to CC stretching, whereas the 11.25 m is due to CH out-of-plane bending. The CH bond being weaker than the CC one, the photoionised PAH is principally detected at 7.70 m. The flux ratio is therefore a good indicator of the photoionisation state of the environment in which PAH molecules are detected, and the larger it is, the higher the photoionisation degree (see e.g. Allamandola et al., 1989; Tielens, 2008, for comprehensive reviews on PAH properties).
The companion star of GRS 1915105 is a late K giant. If its emission can heat up a potential dust component, it is impossible that it photoionises it as it is too cold to emit enough energetic UV photons. Therefore, only the X-ray emission can be responsible for the photoionisation of the PAH molecules. To validate this hypothesis, we compared, for each spectrum, the evolution of the PAH flux ratio with the corresponding 1.212.0 keV X-ray flux of GRS 1915105. The result is displayed in Fig. 4. Despite the strong uncertainties due to the silicate absorption, it suggests a correlation; the dust may therefore be photoionised by the X-ray/UV photons originated from the accretion disc and/or the corona. This would partly explain why no PAH molecules are detected in the GRS 1915105 MIR spectrum obtained on MJD 53511. Indeed, a [Ne II] emission feature is present at 12.81 m. The Ne atom ionisation potential is about 21.56 eV, while the PAH one is smaller than 10 eV, depending on the molecule size (Ruiterkamp et al., 2005). The absence of the 11.25 m PAH feature could consequently mean that almost all the PAH was photoionised. But this spectrum also displays a huge increase of the continuum below about 9.00 m, reaching the flux level measured through photometry on MJD 53500 i.e. about 8.00 mJy and 5.00 mJy at 5.80 m and 8.00 m, respectively. The reason for this increase will be discussed in the next section, but the non-detection of the PAH feature at 7.70 m could be due to a contamination by the continuum, as the peak flux of the feature appears to be less than 6.00 mJy in all the other spectra where it is detected.
4.2 Effect of the thermal bremsstrahlung
Thermal bremsstrahlung from an expanding wind might be partially responsible for the MIR emission of GRS 1915105. Indeed, Begelman et al. (1983) showed that X-ray driven winds could form above an accretion disc heated by X-ray radiation with luminosity a few percents above the Eddington limit, which is likely the case of GRS 1915105 as Lee et al. (2002) and more recently Neilsen & Lee (2009) and Ueda et al. (2009) detected such wind in the system.
Thermal bremsstrahlung was already invoked in van Paradijs et al. (1994) to explain the strong MIR excess the authors had detected in the emission of GRO J0422+32. In their paper, they used the formalism given in Rybicki & Lightman (1979) to assess the expected 10.80 m luminosity of a spherical expanding wind. We followed the same steps, for a disc wind emitted in a solid angle , to assess the expected monochromatic luminosity of GRS 1915105 due to free-free emission at 8.00 m. In such a wind, the mass-loss rate is:
| (1) |
where is the distance within the wind, the proton mass, the electronic density, and the wind velocity. Following Rybicki & Lightman (1979), the thermal bremsstrahlung emissivity at the frequency can be written as:
| (2) |
where is the wind temperature, g the Gaunt factor, and and the Planck and Boltzmann constants, respectively. In the following, we fix to 1, corresponding to a large angle regime in the interaction between an electron and an ion.
Replacing from Eq. 1 into Eq. 2, and integrating over the radial distance between the launching radius (in cm) and infinity, we obtained the monochromatic luminosity at the frequency :
| (3) | |||||
| (4) |
Following Ueda et al. (2009), we can approximate the mass-loss rate as:
| (5) |
which in turn gives the following expression for the monochromatic luminosity:
| (6) |
In their thermally-driven wind model, Begelman et al. (1983) introduced four important parameters, the Compton temperature , where heating from Compton scattering and cooling from inverse Compton are balanced out, the Compton radius , for which the escape velocity equals the isothermal sound speed at the Compton temperature, the critical luminosity , above which a Compton heating disc wind can overcome gravity, and , which is the characteristic temperature of a parcel of gas that rises at a height above the disc in a finite heating time. Those parameters are defined as:
| (7) | |||||
| (8) | |||||
| (9) | |||||
| (10) |
where is the black hole’s mass, the X-ray bolometric luminosity, and the Eddington luminosity. On MJD 53284, using the continuum parameters given in Table 3, and integrating the system’s monochromatic luminosity between 1.0 and 1000.0 keV, we find K, which leads to cm, , and .
Begelman et al. (1983) and Woods et al. (1996) showed that a disc wind could develop for and would get strong for . It is reasonable to assert that the thermal bremsstrahlung arises from the gravity-free part of the wind, in which . Then, considering , Eq. 10 leads to . Replacing by and by in Eq. 6, the inferred luminosity at 8.00 m, is:
| (11) |
On MJD 53284, the unabsorbed luminosity of GRS 1915105 at 8.00 m is about W Hz-1. With a covering factor of about 5%, as measured for GRS 1915105 in Neilsen & Lee (2009), we deduce a bremsstrahlung-induced luminosity at 8.00 m of about W Hz-1, which is an order of magnitude lower that what we measured. Even for a larger value of the covering factor as high as 0.2 (Proga et al., 2000), we derive about W Hz-1, which is still too low. It is therefore very likely that thermal bremsstrahlung from the accretion disc wind barely contributes to the MIR flux of GRS 1915105. Moreover, Fig. 1 shows that on MJD 53511, the MIR continuum of the source below about 9 m increased while it remained almost the same beyond. Yet, the spectral signature of free-free emission is a power law with an index from 0 (optically thin) to 2 (optically thick, Wright & Barlow, 1975), the wind being in the optically thin regime in the infrared. An increase of the MIR flux due to bremsstrahlung would be detected at all wavelengths, which then excludes it as a reason for the MIR brightening.
4.3 X-ray to MIR SEDs: irradiation of the disc
In the soft state, reprocessing in the outer disc of X-ray and UV photons originated from the inner part likely dominates the UV and optical emission of microquasars (Vrtilek et al., 1990; Fukue, 1992; Sanbuichi et al., 1993; van Paradijs & McClintock, 1994; Hynes et al., 1998; Esin et al., 2000; Hynes et al., 2002). In the hard state, there might also be a contribution of the reprocessed hard X-ray photons from the corona. Indeed, Ueda et al. (2002) showed that it could even represent about 2030 % of the K-band emission of GRS 1915105 in the plateau state.
We showed that the sharp increase of the MIR emission on MJD 53511 only detected below about 9.00 m was not due to thermal bremsstrahlung. Dust heating is also little plausible as the MIR increase would have been detected at all wavelengths. On the contrary, it seems rather consistent with irradiation of the outer disc and/or optically thin synchrotron from a discrete ejection. To confirm this hypothesis, we built for MJD 53284, MJD 53511, and MJD 53851 the X-ray to radio SEDs of GRS 1915105, including the dereddened MIR spectra. Moreover, on MJD 53284 and MJD 53851, GRS 1915105 was not detected in the radio domain so we did not include any radio flux in these SEDs.
The way we built the MJD 53511 radio to X-ray SED of GRS 1915105 deserves some justifications. In the high energy domain, we used the MJD 53500 RXTE data because we did not have any high-energy observations quasi-simultaneous with the IRS ones (see Table 1). Indeed, the ASM fluxes and C/A hardness ratios being similar at both dates (see Fig. 5), it is likely that the disc parameters were the same. Moreover, to compensate the lack of data in the radio domain, we made use of the archival VLA fluxes of the source obtained on MJD 53513 at 8.46, 14.94, and 22.46 GHz (37.90, 23.20, and 16.20 mJy respectively, about 10% uncertainties)333http://www.aoc.nrao.edu/mrupen/XRT/GRS1915+105/grs1915+105.shtml. At this epoch, GRS 1915105 was in the decaying phase of a giant ejection, and the VLA flux at 14.94 GHz is similar to the ones from the Ryle telescope on MJD 53510 and MJD 53512, proving that the unknown MJD 53511 radio fluxes are barely different from the VLA ones.
The model we chose to take the reprocessing into account is diskir (Gierliński et al., 2008, 2009). Roughly, it is a extension of diskbb that includes disc irradiation (both from the inner region and the corona) as well as comptonisation (based on nthcomp). The model has nine parameters: the disc’s temperature and norm Norm (same as diskbb), the hard X-rays power law and temperature , the ratio between the corona’s and the disc’s luminosity , the fraction of hard X-ray emission that illuminates the disc , the irradiated radius expressed in term of the disc inner radius, the fraction of soft X-ray emission which is thermalised in the outer disc , and the logarithm of the outer radius expressed in function of the inner radius. The first seven parameters are completely defined by the high-energy data while the two latter are characterised by the optical and infrared ones.
diskir was additively combined to a gaussian accounting for the iron feature at 6.4 keV (0.8 keV frozen width), and we fitted all the data, in ISIS, in three steps:
-
•
we first modified the model with a photo-electric absorption phabs ( atoms cm-2) and fitted the high-energy data only. The electron temperature was frozen to the value found in the previous fits with comptt (see Table 3), the irradiated radius was frozen to after several unsuccessful attempts that showed that it was poorly constrained, was fixed to 0.1 for the corona-dominated spectrum and to 0.3 for the disc-dominated one (for a fixed 0.1 disc’s albedo, Poutanen et al., 1997; Ibragimov et al., 2005; Gilfanov, 2009), and and were frozen to 0 and 3, respectively, as the X-ray data do not allow to constrain them,
-
•
we built the new radio to X-ray SEDs with the unabsorbed MIR spectra stored in ASCII files the RXTE data sets and the VLA radio fluxes (MJD 53511 only),
-
•
we finally fitted the global SEDs with the previous model combined to spherical black body component accounting for the companion star emission, another one accounting for the detected dust emission, and a power law for the radio emission (MJD 53511 only). All the parameters were allowed to vary freely, except the stellar ones (temperature and radius fixed to 4520 K and 21 , respectively), and (same values as in step 1), and lrout which was frozen to (Chaty et al., 2003), being the orbital separation derived from the third Kepler’s law for a 30.8 days orbital period (Neil et al., 2007), and a 14 and 0.86 black hole and companion star, respectively (Harlaftis & Greiner, 2004). Note that lrout was dynamically tied to for a 10 kpc distance and a 66∘ inclination.
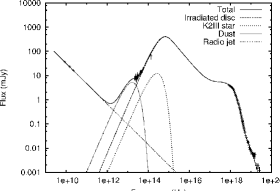
All the best-fit parameters are listed in Table 6, and the fitted SEDs are displayed in Fig. 6. The lack of optical and NIR fluxes being a caveat to constrain irradiation, we added in each SED the K-band magnitudes of GRS 1915105 found in Neil et al. (2007), the uncertainties corresponding to the magnitudes the day before and after our observations. These data were not used to fit the SEDs, but they show the emission level given in the K-band by the irradiation component is not inconsistent with the measurements at the same epoch.
5 Discussion
5.1 Origin of the dust component
Our results suggest the existence of a cold dust component ( K) in the vicinity of GRS 1915105 that likely interacts with the high-energy emission of the black hole binary. Moreover, the dust’s temperature and radius appear to be roughly constant whatever the level of the X-ray emission, which implies that the dust is heated by the K giant companion star rather than the high-energy photons. And lastly, the average dust extension derived from the fits, or cm, is roughly 5 times larger than the orbital separation and 10 times larger than the outer radius of the accretion disc, which means that the MIR emission due to the dust is produced well beyond the binary orbit and that the dust enshrouds the whole system.
Many red giant stars are known to be embedded in a dusty shell that originates from the slow and dense stellar winds (see e.g. Hagen, 1978; Zuckerman & Dyck, 1986; Morris, 1987; van Loon et al., 2005), and this might be the case of the companion star of GRS 1915105. To check the consistency of the dust’s temperature derived from the fits with the dusty stellar winds hypothesis, we can use the simple relation giving the expected temperature of a spherical dust shell in a thermodynamic equilibrium with a central star. Following Rahoui et al. (2009), this temperature is:
| (12) |
where and are the Planck and the Boltzmann constants, the gamma and the Riemann zeta
functions, and and such as the chromatic grain emissivity is defined as . Typical values for carboneous dust are and , where is the
average dust grain’s radius (see e.g. Draine & Lee, 1984; Robberto & Herbst, 1998). For 0.01 m0.1 m, as observed for interstellar dust grains (Draine & Lee, 1984), K, , and , the inferred dust temperatures is about 315 K490 K, which is consistent with our fits.
However, the dust could also originate from a dusty disc-like circumstellar component. Such discs have already been invoked around some isolated first-ascent red giant stars, and a possible explanation for their presence could be the engulfment of an hypothetic low-mass companion when the star entered into the red giant phase (see e.g. Jura, 2003; Jura et al., 2006; Melis et al., 2009). They also have been detected around cataclysmic variables (Dubus et al., 2004; Howell et al., 2006; Brinkworth et al., 2007; Hoard et al., 2009), and Muno & Mauerhan (2006) suggested their presence around A062000 and XTE J1118480 to explain the 8.00 m MIR excess in the emission of both sources while in quiescence. The two most common accepted explanations for the presence of circumbinary discs (CBDs) are (1) the dust was ejected from the binary with angular momentum during the common envelope phase, (2) it comes from a supernova fallback, as it was recently argued for the anomalous X-ray pulsar 4U 014261 (Wang et al., 2006).
In the case of a flat and optically thick CBD irradiated by the companion star, the expected temperature at a radius is (Chiang & Goldreich, 1997):
| (13) |
For a CBD whose inner parts are truncated by tidal forces, the expected minimum inner radius is about , where is the binary separation (Artymowicz & Lubow, 1994). In the case of GRS 1915105, this leads to a maximum inner radius temperature of an hypothetical flat and optically thick CBD of , which again is consistent with the MIR excess due to dust that we detected.
At this point, our data do not allow us to discriminate between a spherical and a disc geometry, but simple considerations
confirm the presence of dust heated by the companion star and enshrouding the black hole binary. Moreover, it is worth noting that
the MIR spectra of GRS 1915105 are strongly similar in shape to those of some pre-main sequence or Herbig Ae/Be stars, silicate absorption and PAH features included
(see e.g. van Boekel et al., 2004; Sloan et al., 2005; Boersma et al., 2009; Berné et al., 2009, for such spectra). Such stars are known to exhibit a MIR excess due to the presence
of an equatorial dusty disc within which PAH molecules are photoionised by the UV emission of the central star, and we suggest that this similarity strengthens
the disc scenario for the dust distribution around GRS 1915105.
Finally, the silicate absorption feature due to the diffuse interstellar medium is strongly correlated to the optical extinction as (Draine, 2003), where is the optical depth of the silicate absorption at 9.70 m. Following Chiar et al. (2007), we took , where and are the source and continuum’s fluxes at 9.70 m, respectively. The optical depth was computed on the spectrum obtained on MJD 53851, as this is the one for which X-ray reprocessing has the smallest contribution in the the MIR. The continuum was fitted using the ranges 5.207.00 m and 13.0014.50 m (in order to exclude the contribution of the silicate absorption feature) with a second order polynomial. This method is strongly uncertain, especially concerning the continuum fitting, and the result should therefore be considered with caution. We nevertheless infer , which is consistent with the value found by Chapuis & Corbel (2004) for the optical extinction in the line of sight of GRS 1915105. We therefore conclude that the silicate absorption feature in the MIR spectrum of GRS 1915105 is likely due to the diffuse interstellar medium.
5.2 Importance of irradiation
The results of the fitting of the three SEDs displayed in Fig. 6 suggest that not only X-ray irradiation of the
disc dominates the UV to NIR emission of GRS 1915105, but that it also extends to the MIR, where it is overcome by the dust component
between about 6 to 10 m, depending on the accretion disc’s flux. In the thermal state (MJD 53511), the MIR continuum is even strongly dominated
by the thermalisation in the outer region of the soft X-ray emission from the inner parts. These results might once again emphasise the peculiarity
of GRS 1915105. Indeed, only Migliari et al. (2007) previously proposed X-ray irradiation of the disc to explain the MIR emission of GRO 165540
in the thermal state, and van Paradijs et al. (1994) excluded it for GRO J0422+32, arguing that the accretion
disc was not large enough to have outer regions sufficiently cold to emit at these wavelengths. This is not the case
of GRS 1915105 as the latter exhibits a large accretion disc, with an assessed outer radius of about cm. A strong contribution of
the X-ray irradiation extending to the infrared was then expected, and Ueda et al. (2002) already argued that it was responsible for about 2030%
of the band flux in the hard state, even in presence of compact jets.
Disc illumination therefore provides a consistent explanation for the variations of the MIR continuum of GRS 1915105. A caveat nevertheless forbids definitive conclusions. Indeed, X-ray reprocessing is thought to be the dominant contribution to the UV and optical fluxes of X-ray binaries, and any model needs these information to be well constrained. Their lack in the set of data we used to fit the SEDs is then a strong limitation to our interpretation, as the process could have artificially increased the emission at these wavelengths to better fit the MIR data. So, even if the fluxes given in Neil et al. (2007) are consistent with the ones derived from our model, only the information on at least the quasi-simultaneous J, H, and K bands magnitudes could strengthen our conclusions.
6 Conclusion
We presented a multi-wavelength study of GRS 1915105 whose outcomes suggest that, in the absence of discrete or continuous ejecta, the MIR continuum of the source is mainly due to the X-ray irradiation of the accretion disc and to a photoionised dust component. This might have consequences on the interpretation of the MIR emission of microquasars in presence of compact jets. Indeed, dust might be ubiquitous around isolated compact objects and X-ray binaries, because of mass transfer during the common envelope phase or material from supernova fallback. If so, compact jets could contribute less than expected at infrared wavelengths, with perhaps a cutoff frequency in the millimeter domain. To confirm our results, it is therefore crucial to increase the sample of microquasars and systematically observe them through MIR spectroscopy, as this is the only way to obtain firm information on both their environment and their continuum. In particular, studying microquasars whose variation time scales are longer than the GRS 1915105 ones, and which do not exhibit such rapid transitions between spectral states would strongly facilitate the multi-wavelength observations and would allow to reach definitive conclusions.
References
- Allamandola et al. (1985) Allamandola, L. J., Tielens, A. G. G. M., & Barker, J. R. 1985, ApJL, 290, L25
- Allamandola et al. (1989) —. 1989, ApJS, 71, 733
- Artymowicz & Lubow (1994) Artymowicz, P., & Lubow, S. H. 1994, ApJ, 421, 651
- Begelman et al. (1983) Begelman, M. C., McKee, C. F., & Shields, G. A. 1983, ApJ, 271, 70
- Belloni et al. (2000) Belloni, T., Klein-Wolt, M., Méndez, M., van der Klis, M., & van Paradijs, J. 2000, A&A, 355, 271
- Berné et al. (2009) Berné, O., Joblin, C., Fuente, A., & Ménard, F. 2009, A&A, 495, 827
- Boersma et al. (2009) Boersma, C., Peeters, E., Martín-Hernández, N. L., van der Wolk, G., Verhoeff, A. P., Tielens, A. G. G. M., Waters, L. B. F. M., & Pel, J. W. 2009, A&A, 502, 175
- Brinkworth et al. (2007) Brinkworth, C. S., et al. 2007, ApJ, 659, 1541
- Castro-Tirado et al. (1992) Castro-Tirado, A. J., Brandt, S., & Lund, N. 1992, IAU Circ., 5590, 2
- Castro-Tirado et al. (1994) Castro-Tirado, A. J., Brandt, S., Lund, N., Lapshov, I., Sunyaev, R. A., Shlyapnikov, A. A., Guziy, S., & Pavlenko, E. P. 1994, ApJS, 92, 469
- Chapuis & Corbel (2004) Chapuis, C., & Corbel, S. 2004, A&A, 414, 659
- Chaty & Bessolaz (2006) Chaty, S., & Bessolaz, N. 2006, A&A, 455, 639
- Chaty et al. (2003) Chaty, S., Haswell, C. A., Malzac, J., Hynes, R. I., Shrader, C. R., & Cui, W. 2003, MNRAS, 346, 689
- Chaty et al. (1996) Chaty, S., Mirabel, I. F., Duc, P. A., Wink, J. E., & Rodriguez, L. F. 1996, A&A, 310, 825
- Chiang & Goldreich (1997) Chiang, E. I., & Goldreich, P. 1997, ApJ, 490, 368
- Chiar & Tielens (2006) Chiar, J. E., & Tielens, A. G. G. M. 2006, ApJ, 637, 774
- Chiar et al. (2007) Chiar, J. E., et al. 2007, ApJL, 666, L73
- Corbel & Fender (2002) Corbel, S., & Fender, R. P. 2002, ApJL, 573, L35
- Corbel et al. (2003) Corbel, S., Nowak, M. A., Fender, R. P., Tzioumis, A. K., & Markoff, S. 2003, A&A, 400, 1007
- Dhawan et al. (2000) Dhawan, V., Mirabel, I. F., & Rodríguez, L. F. 2000, ApJ, 543, 373
- Draine (2003) Draine, B. T. 2003, ARA&A, 41, 241
- Draine & Lee (1984) Draine, B. T., & Lee, H. M. 1984, ApJ, 285, 89
- Dubus et al. (2004) Dubus, G., Campbell, R., Kern, B., Taam, R. E., & Spruit, H. C. 2004, MNRAS, 349, 869
- Dumm & Schild (1998) Dumm, T., & Schild, H. 1998, New Astronomy, 3, 137
- Ebisawa (1998) Ebisawa, K. 1998, in IAU Symposium, Vol. 188, The Hot Universe, ed. K. Koyama, S. Kitamoto, & M. Itoh, 392–+
- Eikenberry et al. (2000) Eikenberry, S. S., Matthews, K., Muno, M., Blanco, P. R., Morgan, E. H., & Remillard, R. A. 2000, ApJL, 532, L33
- Eikenberry et al. (1998) Eikenberry, S. S., Matthews, K., Murphy, Jr., T. W., Nelson, R. W., Morgan, E. H., Remillard, R. A., & Muno, M. 1998, ApJL, 506, L31
- Esin et al. (2000) Esin, A. A., Kuulkers, E., McClintock, J. E., & Narayan, R. 2000, ApJ, 532, 1069
- Fender et al. (1999) Fender, R. P., Garrington, S. T., McKay, D. J., Muxlow, T. W. B., Pooley, G. G., Spencer, R. E., Stirling, A. M., & Waltman, E. B. 1999, MNRAS, 304, 865
- Fender et al. (1997) Fender, R. P., Pooley, G. G., Brocksopp, C., & Newell, S. J. 1997, MNRAS, 290, L65
- Fitzpatrick (1999) Fitzpatrick, E. L. 1999, PASP, 111, 63
- Fitzpatrick & Massa (2009) Fitzpatrick, E. L., & Massa, D. 2009, ApJ, 699, 1209
- Foster et al. (1996) Foster, R. S., Waltman, E. B., Tavani, M., Harmon, B. A., Zhang, S. N., Paciesas, W. S., & Ghigo, F. D. 1996, ApJL, 467, L81+
- Fuchs et al. (2006) Fuchs, Y., Koch Miramond, L., & Ábrahám, P. 2006, A&A, 445, 1041
- Fuchs et al. (2003a) Fuchs, Y., Mirabel, I. F., & Claret, A. 2003a, A&A, 404, 1011
- Fuchs et al. (2003b) Fuchs, Y., et al. 2003b, A&A, 409, L35
- Fukue (1992) Fukue, J. 1992, PASJ, 44, 663
- Gallo et al. (2007) Gallo, E., Migliari, S., Markoff, S., Tomsick, J. A., Bailyn, C. D., Berta, S., Fender, R., & Miller-Jones, J. C. A. 2007, ApJ, 670, 600
- Gierliński et al. (2008) Gierliński, M., Done, C., & Page, K. 2008, MNRAS, 388, 753
- Gierliński et al. (2009) —. 2009, MNRAS, 392, 1106
- Gilfanov (2009) Gilfanov, M. 2009, ArXiv e-prints
- Greiner et al. (2001a) Greiner, J., Cuby, J. G., & McCaughrean, M. J. 2001a, Nature, 414, 522
- Greiner et al. (2001b) Greiner, J., Cuby, J. G., McCaughrean, M. J., Castro-Tirado, A. J., & Mennickent, R. E. 2001b, A&A, 373, L37
- Hagen (1978) Hagen, W. 1978, ApJS, 38, 1
- Hannikainen et al. (2003) Hannikainen, D. C., Rodriguez, J., & Pottschmidt, K. 2003, IAU Circ., 8088, 4
- Harlaftis & Greiner (2004) Harlaftis, E. T., & Greiner, J. 2004, A&A, 414, L13
- Hoard et al. (2009) Hoard, D. W., et al. 2009, ApJ, 693, 236
- Homan et al. (2005) Homan, J., Buxton, M., Markoff, S., Bailyn, C. D., Nespoli, E., & Belloni, T. 2005, ApJ, 624, 295
- Howell et al. (2006) Howell, S. B., et al. 2006, ApJL, 646, L65
- Hynes et al. (2002) Hynes, R. I., Haswell, C. A., Chaty, S., Shrader, C. R., & Cui, W. 2002, MNRAS, 331, 169
- Hynes et al. (1998) Hynes, R. I., O’Brien, K., Horne, K., Chen, W., & Haswell, C. A. 1998, MNRAS, 299, L37
- Ibragimov et al. (2005) Ibragimov, A., Poutanen, J., Gilfanov, M., Zdziarski, A. A., & Shrader, C. R. 2005, MNRAS, 362, 1435
- Jura (2003) Jura, M. 2003, ApJ, 582, 1032
- Jura et al. (2006) Jura, M., et al. 2006, ApJL, 637, L45
- Klein-Wolt et al. (2002) Klein-Wolt, M., Fender, R. P., Pooley, G. G., Belloni, T., Migliari, S., Morgan, E. H., & van der Klis, M. 2002, MNRAS, 331, 745
- Koch-Miramond et al. (2002) Koch-Miramond, L., Ábrahám, P., Fuchs, Y., Bonnet-Bidaud, J.-M., & Claret, A. 2002, A&A, 396, 877
- Lebrun et al. (2003) Lebrun, F., et al. 2003, A&A, 411, L141
- Lee et al. (2002) Lee, J. C., Reynolds, C. S., Remillard, R., Schulz, N. S., Blackman, E. G., & Fabian, A. C. 2002, ApJ, 567, 1102
- Leger & Puget (1984) Leger, A., & Puget, J. L. 1984, A&A, 137, L5
- Lund et al. (2003) Lund, N., et al. 2003, A&A, 411, L231
- McClintock et al. (2006) McClintock, J. E., Shafee, R., Narayan, R., Remillard, R. A., Davis, S. W., & Li, L.-X. 2006, ApJ, 652, 518
- Melis et al. (2009) Melis, C., Zuckerman, B., Song, I., Rhee, J. H., & Metchev, S. 2009, ApJ, 696, 1964
- Migliari et al. (2007) Migliari, S., et al. 2007, ApJ, 670, 610
- Mirabel et al. (1998) Mirabel, I. F., Dhawan, V., Chaty, S., Rodriguez, L. F., Marti, J., Robinson, C. R., Swank, J., & Geballe, T. 1998, A&A, 330, L9
- Mirabel & Rodriguez (1994) Mirabel, I. F., & Rodriguez, L. F. 1994, Nature, 371, 46
- Mirabel et al. (1996) Mirabel, I. F., Rodriguez, L. F., Chaty, S., Sauvage, M., Gerard, E., Duc, P.-A., Castro-Tirado, A., & Callanan, P. 1996, ApJL, 472, L111+
- Mitsuda et al. (1984) Mitsuda, K., et al. 1984, PASJ, 36, 741
- Morris (1987) Morris, M. 1987, PASP, 99, 1115
- Muno & Mauerhan (2006) Muno, M. P., & Mauerhan, J. 2006, ApJL, 648, L135
- Neil et al. (2007) Neil, E. T., Bailyn, C. D., & Cobb, B. E. 2007, ApJ, 657, 409
- Neilsen & Lee (2009) Neilsen, J., & Lee, J. C. 2009, Nature, 458, 481
- Pooley & Fender (1997) Pooley, G. G., & Fender, R. P. 1997, MNRAS, 292, 925
- Poutanen et al. (1997) Poutanen, J., Krolik, J. H., & Ryde, F. 1997, MNRAS, 292, L21
- Proga et al. (2000) Proga, D., Stone, J. M., & Kallman, T. R. 2000, ApJ, 543, 686
- Puget et al. (1985) Puget, J. L., Leger, A., & Boulanger, F. 1985, A&A, 142, L19
- Rahoui et al. (2009) Rahoui, F., Chaty, S., & Lagage, P.-O. 2009, A&A, 493, 119
- Reach et al. (2005) Reach, W. T., et al. 2005, PASP, 117, 978
- Robberto & Herbst (1998) Robberto, M., & Herbst, T. M. 1998, ApJ, 498, 400
- Rodriguez et al. (2008a) Rodriguez, J., et al. 2008a, ApJ, 675, 1436
- Rodriguez et al. (2008b) —. 2008b, ApJ, 675, 1449
- Ruiterkamp et al. (2005) Ruiterkamp, R., Cox, N. L. J., Spaans, M., Kaper, L., Foing, B. H., Salama, F., & Ehrenfreund, P. 2005, A&A, 432, 515
- Russell et al. (2006) Russell, D. M., Fender, R. P., Hynes, R. I., Brocksopp, C., Homan, J., Jonker, P. G., & Buxton, M. M. 2006, MNRAS, 371, 1334
- Rybicki & Lightman (1979) Rybicki, G. B., & Lightman, A. P. 1979, Astronomy Quarterly, 3, 199
- Sanbuichi et al. (1993) Sanbuichi, K., Yamada, T. T., & Fukue, J. 1993, PASJ, 45, 443
- Sloan et al. (2005) Sloan, G. C., et al. 2005, ApJ, 632, 956
- Tielens (2008) Tielens, A. G. G. M. 2008, ARA&A, 46, 289
- Titarchuk (1994) Titarchuk, L. 1994, ApJ, 434, 570
- Ueda et al. (2009) Ueda, Y., Yamaoka, K., & Remillard, R. 2009, ApJ, 695, 888
- Ueda et al. (2002) Ueda, Y., et al. 2002, ApJ, 571, 918
- van Belle et al. (1999) van Belle, G. T., et al. 1999, AJ, 117, 521
- van Boekel et al. (2004) van Boekel, R., Waters, L. B. F. M., Dominik, C., Dullemond, C. P., Tielens, A. G. G. M., & de Koter, A. 2004, A&A, 418, 177
- van Loon et al. (2005) van Loon, J. T., Cioni, M.-R. L., Zijlstra, A. A., & Loup, C. 2005, A&A, 438, 273
- van Paradijs & McClintock (1994) van Paradijs, J., & McClintock, J. E. 1994, A&A, 290, 133
- van Paradijs et al. (1994) van Paradijs, J., Telesco, C. M., Kouveliotou, C., & Fishman, G. J. 1994, ApJL, 429, L19
- Vrtilek et al. (1990) Vrtilek, S. D., Raymond, J. C., Garcia, M. R., Verbunt, F., Hasinger, G., & Kurster, M. 1990, A&A, 235, 162
- Wang et al. (2006) Wang, Z., Chakrabarty, D., & Kaplan, D. L. 2006, Nature, 440, 772
- Woods et al. (1996) Woods, D. T., Klein, R. I., Castor, J. I., McKee, C. F., & Bell, J. B. 1996, ApJ, 461, 767
- Wright & Barlow (1975) Wright, A. E., & Barlow, M. J. 1975, MNRAS, 170, 41
- Zuckerman & Dyck (1986) Zuckerman, B., & Dyck, H. M. 1986, ApJ, 311, 345
| IRAC | IRS | RXTE | INTEGRAL | Ryle | Ryle fluxes (mJy) | Class |
|---|---|---|---|---|---|---|
| 53280.275 | 53280.24153280.348 | 53280.63653280.746 | 1 | |||
| 53284.176 | 53284.17753284.236 | 53283.67353283.706 | 1 | |||
| 53299.226 | 53298.58753298.663 | 1 | ||||
| 53308.741 | 53308.81153308.841 | 1 | ||||
| 53484.099 | 53484.02753484.169 | 7691 | ||||
| 53496.287 | 53496.20953496.230 | 3743 | ||||
| 53500.571 | 53500.32653500.430 | 53500.20253500.358 | 2232 | |||
| 53511.697 | ||||||
| 53636.571 | ||||||
| 53660.072 | 53659.98253660.079 | 53659.57753659.906 | 2747 | |||
| 53661.182 | 53661.70653661.856 | 53660.60253660.881 | 1855 | |||
| 53676.070 | 53676.24753677.488 | 53675.58363675.641 | 6475 | , , | ||
| 53851.419 | 53851.30753851.319 | 53851.10253851.320 | 3 | |||
| 53857.587 | ||||||
| 53874.818 | ||||||
| 53890.827 | 53892.04753892.063 | 53888.23953888.261 | 1 |
.
Note. — For each instrument, we give the day of observation (in MJD), and, when available, we give the day of quasi-simultaneous coverage with RXTE, INTEGRAL, and/or the Ryle telescope, as well as the Ryle flux level (15 GHz) in mJy. Moreover, when high-energy observations were available, we give the spectral class of the source as defined in Belloni et al. (2000)
| MJD | 3.59 m | 4.50 m | 5.80 m | 8.00 m |
|---|---|---|---|---|
| 53284 | 5.700.17 | 5.320.16 | 4.800.15 | 3.120.10 |
| 53308 | 5.260.16 | 4.850.15 | 4.320.13 | 2.950.10 |
| 53496 | 8.690.26 | 8.120.24 | 7.610.23 | 5.030.16 |
| 53500 | 10.280.31 | 10.090.30 | 8.800.27 | 6.140.19 |
| 53636 | 6.200.19 | 5.880.18 | 5.330.16 | 3.770.12 |
| 53676 | 10.700.32 | 10.310.31 | 9.150.28 | 6.410.20 |
| 53857 | 4.820.15 | 4.750.14 | 4.230.13 | 2.870.09 |
| 53890 | 5.160.16 | 4.920.15 | 4.360.13 | 3.050.10 |
Note. — Uncertainties are given at 1 and include 3% systematic errors.
| MJD 53280 | MJD 53299 |
 |
 |
| MJD 53484 | MJD 53511 |
 |
 |
| MJD 53660 | MJD 53661 |
 |
 |
| MJD 53851 | MJD 53874 |
 |
 |
| Parameters | MJD 53280 | MJD 53284 | MJD 53500 | MJD 53676 | MJD 53851 | MJD 53890 |
|---|---|---|---|---|---|---|
| (keV) | 1.27 | 1.20 | 1.85 | 2.05 | 0.81 | 1.28 |
| (keV) | ||||||
| 0.01 (frozen) | 0.01 (frozen) | 0.01 (frozen) | 0.01 (frozen) | 0.95 | 0.01 (frozen) | |
| aa and are the total and disc unabsorbed fluxes, extrapolated to 3.0200.0 keV. ( erg cm-2 s-1) | 3.08 | 3.49 | 4.64 | 4.59 | 1.71 | 2.13 |
| aa and are the total and disc unabsorbed fluxes, extrapolated to 3.0200.0 keV. ( erg cm-2 s-1) | 1.22 | 1.19 | 3.75 | 3.74 | 0.20 | 0.85 |
| (d.o.f) | 0.93 (53) | 1.09 (53) | 1.29 (53) | 1.65 (49) | 1.31 (53) | 1.25 (53) |
Note. — The best-fit model is phabs(diskbb+gaussian+comptt), and the errorbars are given at the 90% confidence level. These spectra were built with RXTE/PCA+HEXTE data, except on MJD 53676 for which we used INTEGRAL/JEMX+ISGRI data.
| Parameters | MJD 53660 | MJD 53661 |
|---|---|---|
| (keV) | ||
| (keV) | ||
| aa is the power law photon index. | ||
| bb is the total unabsorbed flux, extrapolated to 3.0200.0 keV. (erg cm-2 s-1) | 3.08 | 4.43 |
| (d.o.f) | 0.82 (53) | 0.74 (53) |
Note. — The best-fit model is phabs(comptt+gaussian+powerlaw), and the errorbars are given at the 90% confidence level.
| MJD 53284 |
 |
| MJD 53890 |
 |
| Features | FWHM | Flux | SNR | |||
|---|---|---|---|---|---|---|
| (m) | (m) | (m) | (m) | W cm-2 | ||
| MJD 53280 | ||||||
| H I | 7.508 | 7.5220.004 | -0.041 | 0.1130.005 | 1.0300.119 | 11.29 |
| PAH | 7.800 | 7.8010.008 | -0.032 | 0.2280.009 | 1.2660.137 | 15.93 |
| PAH | 11.250 | 11.2510.004 | -0.193 | 0.1780.004 | 0.6220.041 | 18.04 |
| He II ? | 12.367 | 12.3530.003 | -0.090 | 0.1630.003 | 0.4240.026 | 27.54 |
| H I ? | 12.587 | 12.5900.011 | -0.075 | 0.2390.014 | 0.5760.089 | 14.65 |
| MJD 53299 | ||||||
| H I | 7.508 | 7.5190.003 | -0.058 | 0.1340.004 | 1.5460.169 | 34.30 |
| PAH | 7.600 | 7.6210.002 | -0.034 | 0.1000.003 | 1.4320.078 | 25.37 |
| PAH | 11.250 | 11.2060.003 | -0.227 | 0.1890.003 | 0.5990.039 | 36.64 |
| MJD 53484 | ||||||
| H II | 7.460 | 7.4580.004 | -0.050 | 0.1220.007 | 1.5460.06 | 68.28 |
| PAH | 7.700 | 7.7220.008 | -0.097 | 0.2400.009 | 2.5810.190 | 16.55 |
| PAH | 11.250 | 11.2990.014 | -0.110 | 0.1430.012 | 0.4630.060 | 8.85 |
| H I | 12.587 | 12.5990.007 | -0.140 | 0.1940.007 | 0.6700.076 | 12.49 |
| MJD 53511 | ||||||
| H II | 7.460 | 7.4600.002 | -0.029 | 0.0870.002 | 0.9030.073 | 17.47 |
| Ne II | 12.813 | 12.8030.001 | -0.080 | 0.1360.001 | 0.4270.011 | 60.68 |
| MJD 53660 | ||||||
| PAH | 7.700 | 7.7190.021 | -0.029 | 0.2640.017 | 1.2930.138 | 16.11 |
| PAH | 11.250 | 11.2790.011 | -0.077 | 0.2560.005 | 0.6920.035 | 46.56 |
| MJD 53661 | ||||||
| PAH | 7.800 | 7.8120.005 | -0.051 | 0.1870.006 | 1.3890.111 | 14.66 |
| PAH | 11.250 | 11.3110.005 | -0.100 | 0.2080.005 | 0.6440.050 | 17.89 |
| H I | 12.157 | 12.1360.004 | -0.094 | 0.1830.006 | 0.6250.055 | 17.69 |
| H I | 12.611 | 12.6060.011 | -0.089 | 0.2230.012 | 0.6670.099 | 11.21 |
| MJD 53851 | ||||||
| PAH | 7.800 | 7.7730.006 | -0.043 | 0.1190.006 | 0.8530.126 | 11.29 |
| PAH | 11.250 | 11.2690.009 | -0.347 | 0.2810.010 | 1.1880.120 | 11.42 |
| MJD 53874 | ||||||
| PAH | 7.800 | 7.8310.010 | -0.026 | 0.1210.010 | 1.1520.112 | 11.76 |
| PAH | 11.250 | 11.2470.001 | -0.076 | 0.1150.002 | 0.6620.022 | 45.99 |
| H I | 12.587 | 12.5680.011 | -0.101 | 0.2530.028 | 0.6700.128 | 11.02 |
Note. — We give the name of the feature, its laboratory () and measured () wavelengths, its equivalent width , its full-width at half-length (), its flux, and its signal-to-noise ratio ().
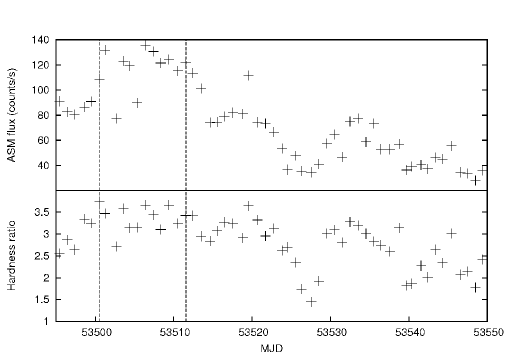
Bottom: C/A ASM hardness ratio.
| Parameters | MJD 53280 | MJD 53511 | MJD 53851 |
|---|---|---|---|
| (keV) | 1.33 | 1.88 | 0.75 |
| () | 6.01 | 6.17 | 5.74 |
| 0.1 (frozen) | 0.3 (frozen) | 0.1 (frozen) | |
| () | |||
| (K) | |||
| () | |||
| (d.o.f) | 1.28 (187) | 1.12 (190) | 1.64 (187) |
Note. — The best-fit model is phabs(diskir+gaussian+bbodyrad+bbodyrad+powerlaw), and the errorbars are given at the 90% confidence level. The SEDs were built with the MJD 53280, MJD 53511, and MJD 53851 RXTE/PCA+HEXTE and IRS data, as well as archival VLA data in the case of MJD 53511.
| MJD 53511 | MJD 53280 | MJD 53851 |
|---|---|---|
 |
 |
 |
 |
 |
 |
Bottom: dereddened 5.20 to 14.50 m IRS spectra of GRS 1915105, obtained on MJD 53511, MJD 53280, and MJD 53851, used to fit the radio/MIR/X-ray SEDs. Note that from the left to the right, both SEDs and spectra are displayed by decreasing levels of irradiation.