H I Column Densities, Metallicities, and Dust Extinction of Metal-Strong Damped Ly Systems11affiliation: Observations reported here were obtained at the MMT Observatory, a joint facility of the University of Arizona and the Smithsonian Institution.
Abstract
With the Blue Channel Spectrograph (BCS) on the MMT telescope, we have obtained spectra to the atmospheric cutoff of quasars previously known to show at least one absorption system at with very strong metal lines. We refer to these absorbers as candidate metal-strong damped Ly systems (cMSDLAs), the majority of which were culled from the Sloan Digital Sky Survey. The BCS/MMT spectra yield precise estimates of the H I column densities () of the systems through Voigt profile analysis of their Ly transitions. Nearly all of the cMSDLAs (41/43) satisfy the criterion of DLAs, atoms cm-2. As a population, these systems have systematically higher values than DLAs chosen randomly from quasar sightlines. Combining our measurements with previously measured metal column densities, we estimate metallicities for the MSDLAs. These systems have significantly higher values than randomly selected DLAs; at , the MSDLAs show a median metallicity [M/H] that is dex higher than a corresponding control sample. This establishes MSDLAs as having amongst the most metal-rich gas in the high universe. Our measurements extend the observed correlation between Si II 1526 equivalent width and the gas metallicity to higher values. If interpreted as a mass-metallicity relation, this implies the MSDLAs are the high mass subset of the DLA population. We demonstrate that dust in the MSDLAs reddens their background quasars, with a median shift in the spectral slope of . Assuming an SMC extinction law, this implies a median reddening mag and visual extinction mag. The latter quantity yields a dust-to-gas ratio of , very similar to estimation for the SMC. Future studies of MSDLAs offer the opportunity to study the extinction, nucleosynthesis, and kinematics of the most chemically evolved, gas-rich galaxies at high .
1. Introduction
A Damped Ly Absorption System (DLA) is defined as a neutral hydrogen absorber along a Quasi-Stellar Object (QSO) sight line with an H I column density of atoms cm-2 (see Wolfe et al., 2005, for a review). DLAs provide an important way to study the gas and dust content of the early universe (e.g. Pettini et al., 1994; Lu et al., 1996; Prochaska & Wolfe, 2001). Their heavy elements were synthesized either in nuclear reactions occurring in stellar cores or when massive stars go supernova. Studies of DLAs, therefore, probe the processes of stellar evolution in young galaxies. The large surface density of neutral hydrogen that defines DLAs means these systems contain most of the star forming gas in the early universe (Prochaska et al., 2005; O’Meara et al., 2007). Since the presence of heavy metals in DLAs implies the existence of stars, DLAs likely trace high redshift galaxies along the sight line between the QSO and earth. These high redshift galaxies are thought to be precursors of galaxies like the Milky Way (e.g. Nagamine et al., 2004; Pontzen et al., 2008).
A subset of DLAs exhibit especially strong metal absorption lines. The metal-strong damped Ly systems (MSDLAs) enable analysis of tens of elements in individual galaxies (Prochaska et al., 2003c). The metal-strong criteria were defined by (Herbert-Fort et al., 2006, ; hereafter, H06) to be absorbers showing ionic column densities that satisfy N(Zn+)13.15 and/or N(Si+)15.95. The MSDLAs, therefore, are absorbers that satisfy the metal-strong criteria and also the DLA criterion on . H06 identified a number of MSDLA candidates from the Sloan Digital Sky Survey (SDSS) and presented higher resolution follow-up spectra of the metal-line transitions. The strong metal absorption lines of these candidates suggests a high metallicity. For many of these MSDLA candidates, however, the Ly absorption line was bluer than the wavelength coverage in the SDSS spectra, precluding measurements of their H I column densities. Therefore, these absorption systems could not be classified as damped Ly systems nor could the authors provide metallicity estimates for the gas.
The wavelengths covered by SDSS spectra range from 3800 to 9200 Å (Adelman-McCarthy et al., 2008). This range allows for the identification of DLAs with redshifts corresponding to . For absorbers with 1.5 zabs 2.2, the Ly absorption line lies blueward of the SDSS spectral coverage, but these systems can be observed from ground-based observatories equipped with blue-sensitive spectrometers. With this observational goal in mind, we obtained new spectra from the MMT telescope of various QSO sight lines containing MSDLA candidates using the Blue Channel Spectrograph (BCS).
Here we summarize our classification scheme. Systems with atoms cm-2 are classified as DLAs. Systems with H I column densities meeting the DLA criteria stated above and with measured metal column densities of N(Zn+)13.15 and/or N(Si+)15.95 are classified as MSDLAs. Candidate MSDLAs are systems identified with strong metal lines in the SDSS spectra (or elsewhere for a few systems) for which there was previously no Ly coverage and/or no precise measurement of the metal column density. We refer to these candidate MSDLAs as cMSDLAs. Each cMSDLA has had its spectrum taken with the MMT/BCS in order to obtain Ly coverage.
The gas identified with MSDLAs is analogous to the HI regions found in the Milky Way (e.g. Savage & Sembach, 1996). Several heavy elements detected in the gas of MSDLAs are also known to make up interstellar dust in the Milky Way and other nearby galaxies. Dust in the Milky Way is comprised of heavy elements including C, O, Mg, Ni, S, K, Mn, Si, Fe, Al, Ti, and Ca (e.g. Savage & Mathis, 1979; Jenkins, 2009). Herbert-Fort et al. (2006) presents the abundance ratios of previously observed MSDLAs showing their ratios approach solar. Dust particles preferentially absorb short wavelengths of light, reddening the color of background objects. Ellison et al. (2005) have performed the only extinction estimate for a complete survey of DLAs and set an upper limit to their average reddening of mag. Reddening has been studied in the low redshift universe where nearby galaxies can be well resolved. In contrast, the properties of dust in high redshift galaxies is very poorly constrained. QSO absorption systems provide a probe for studying reddening in high redshift galaxies due to absorption of the QSO’s light by the dust in the absorber. A series of studies have been performed on the extinction properties of DLAs beginning several decades ago (e.g. Ostriker & Heisler, 1984; Pei et al., 1991). More recently, Murphy & Liske (2004) leveraged the large dataset afforded by SDSS to examine reddening from DLAs in the SDSS-DR2 using the spectrophotometric observations. Their results show no conclusive evidence for reddening ( mag). Reddening in DLAs has also been investigated using the SDSS photometry by Vladilo et al. (2006, 2008), who report evidence for dust. Vladilo et al. (2008) found evidence for reddening when comparing the colors of quasars background to a large sample of DLAs to a control sample of QSOs without DLAs. These authors estitimate an average reddening mag. Given their large metal column densities, MSDLAs may be expected to show significant reddening.
In this paper we first determine if our candidate MSDLAs meet the DLA and/or the metal-strong criteria and then we search for reddening to see if they contain dust. We cover the observations and data reduction of our candidate MSDLA sample in Section 2. The measurements for redshift and H I column density are given in § 3. We determine metallicities for the cMSDLAs and explore the relationship between [M/H] and the EW of the Si II 1256 line in § 4. Section 5 covers the search for dust reddening and extinction in our data sample and presents the results. We conclude in 6 with a brief summary.
2. Observations and Reduction
We used the following criteria to select our MSDLA candidates for MMT/BCS spectroscopy, hereafter referred to as cMSDLAs. We selected all SDSS-DR5 quasars with magnitudes showing ‘strong’ or ‘very strong’ Zn II 2026 or Si II 1808 absorption profiles at absorption redshifts . ‘Strong’ is where the minimum depth of the absorption profile is the continuum flux, while ‘very strong’ is when the minimum depth is the continuum flux. These designations come from visual inspection of the SDSS spectra by JXP and SHF and correspond to the systems with flags 4 for ‘strong’ or 5 for ‘very strong’ in the tables of Herbert-Fort et al. (2006). The minimum of the selection is set to by the blue atmospheric cutoff, so that Ly remains accessible at optical wavelengths, while the maximum is set to 2.2 because Ly becomes accessible in SDSS data directly at higher redshifts. We then gave priority to systems satisfying the metal-strong criterion absorption in higher-resolution follow-up Keck ESI and HIRES spectra (still lacking Ly coverage), as well as to systems without follow-up data but showing particularly strong metal absorption in the SDSS discovery spectra (at redshifts ).
Data on cMSDLAs were acquired over the course of four nights (Sept. 17 2006, Dec. 15 2006, Dec. 16 2006, and Mar. 26 2007) using the MMT telescope at the MMT Observatory on Mt. Hopkins, Arizona. The data were taken with the MMT/BCS using the 800 grooves/mm grating. The slit was 1.25′′ wide giving a spectral resolution of FWHM . The wavelengths for these observations range from to 5100 Å, corresponding to coverage of the Ly transition for redshifts 1.55zabs3.1. The observations, totalling 41 QSOs, are summarized in Table 1.
| QSO | zem | |||||
|---|---|---|---|---|---|---|
| J0008-0958 | 00:08:15.33 | -09:58:54.0 | 2006 Sep 17 | 1000 | 2.595 | 18.38 |
| J0016-0012 | 00:16:02.40 | -00:12:24.9 | 2006 Dec 14 | 900 | 2.087 | 18.03 |
| J0020+1534 | 00:20:28.97 | +15:34:35.9 | 2006 Sep 17 | 1000 | 1.763 | 18.79 |
| J0044+0018 | 00:44:39.32 | +00:18:22.7 | 2006 Dec 14 | 1200 | 1.868 | 18.20 |
| J0058+0115 | 00:58:14.31 | +01:15:30.3 | 2006 Dec 14 | 600 | 2.495 | 17.69 |
| J0120+1324 | 01:20:20.36 | +13:24:33.6 | 2006 Sep 17 | 1000 | 2.567 | 19.23 |
| Q0201+36 | 02:04:55.60 | +36:49:18.0 | 2006 Sep 17 | 1000 | 2.912 | 17.4 |
| J0316+0040 | 03:16:09.84 | +00:40:43.2 | 2006 Dec 14 | 1300 | 2.921 | 18.66 |
| J0755+2342 | 07:55:37.22 | +23:42:04.7 | 2006 Dec 16 | 900 | 1.825 | 17.20 |
| J0756+1648 | 07:56:36.73 | +16:48:50.7 | 2006 Dec 16 | 1200 | 2.866 | 18.76 |
| J0812+3208 | 08:12:40.68 | +32:08:08.6 | 2006 Dec 16 | 600 | 2.704 | 17.46 |
| J0820+0819 | 08:20:58.37 | +08:19:48.0 | 2006 Dec 16 | 900 | 2.519 | 18.36 |
| J0831+4025 | 08:31:08.01 | +40:25:31.0 | 2006 Dec 16 | 900 | 2.330 | 18.87 |
| J0840+4942 | 08:40:32.95 | +49:42:52.8 | 2006 Dec 16 | 1200 | 2.076 | 19.02 |
| J0856+3350 | 08:56:18.23 | +33:50:42.8 | 2006 Dec 16 | 450 | 1.726 | 17.18 |
| J0912-0047 | 09:12:47.59 | -00:47:17.4 | 2006 Dec 16 | 900 | 2.859 | 18.68 |
| J0927+5823 | 09:27:08.88 | +58:23:19.4 | 2006 Dec 16 | 900 | 1.910 | 18.27 |
| J0938+3805 | 09:38:46.77 | +38:05:49.8 | 2006 Dec 16 | 300 | 1.827 | 17.13 |
| J0958+4222 | 09:58:29.47 | +42:22:56.8 | 2006 Dec 16 | 900 | 2.656 | 18.28 |
| J1009+5450 | 10:09:16.94 | +54:50:03.9 | 2006 Dec 16 | 900 | 2.062 | 19.13 |
| J1019+5246 | 10:19:39.15 | +52:46:27.8 | 2006 Dec 16 | 800 | 2.170 | 17.92 |
| J1029+1039 | 10:29:04.15 | +10:39:01.5 | 2007 Mar 25 | 900 | 1.795 | 17.57 |
| J1049-0110 | 10:49:15.43 | -01:10:38.1 | 2006 Dec 16 | 720 | 2.115 | 17.78 |
| J1054+0348 | 10:54:00.41 | +03:48:01.1 | 2006 Dec 16 | 720 | 2.095 | 17.98 |
| J1056+1208 | 10:56:48.69 | +12:08:26.8 | 2006 Dec 16 | 600 | 1.923 | 17.93 |
| J1057+1506 | 10:57:52.70 | +15:06:14.1 | 2007 Mar 25 | 1000 | 2.169 | 18.06 |
| J1111+1336 | 11:11:19.10 | +13:36:03.8 | 2007 Mar 25 | 1000 | 3.482 | 17.29 |
| J1224+5525 | 12:24:38.42 | +55:25:14.5 | 2007 Mar 25 | 1000 | 1.879 | 17.57 |
| J1310+5424 | 13:10:40.24 | +54:24:49.6 | 2007 Mar 25 | 1000 | 1.929 | 18.50 |
| J1312+5502 | 13:12:01.09 | +55:02:28.6 | 2007 Mar 25 | 1500 | 1.906 | 19.35 |
| J1341+5818 | 13:41:44.63 | +58:18:17.5 | 2007 Mar 25 | 1200 | 2.054 | 18.66 |
| J1357+3450 | 13:57:50.92 | +34:50:23.5 | 2007 Mar 25 | 1400 | 2.921 | 19.03 |
| J1610+4724 | 16:10:09.42 | +47:24:44.5 | 2006 Sep 16 | 900 | 3.217 | 18.76 |
| J1709+3258 | 17:09:09.29 | +32:58:03.4 | 2006 Sep 16 | 600 | 1.889 | 19.22 |
| J2100-0641 | 21:00:25.03 | -06:41:46.0 | 2006 Sep 16 | 900 | 3.130 | 18.17 |
| J2123-0050 | 21:23:29.46 | -00:50:52.9 | 2006 Sep 16 | 120 | 2.262 | 16.45 |
| J2125+0029 | 21:25:21.44 | +00:29:06.4 | 2006 Sep 16 | 900 | 1.951 | 19.30 |
| Q2206-19 | 22:08:51.17 | -19:44:06.5 | 2006 Sep 16 | 300 | 2.559 | 17.0 |
| J2222-0946 | 22:22:56.11 | -09:46:36.2 | 2006 Sep 16 | 600 | 2.926 | 18.00 |
| J2244+1429 | 22:44:52.22 | +14:29:15.1 | 2006 Sep 17 | 700 | 1.955 | 18.94 |
| J2340-0053 | 23:40:23.66 | -00:53:27.0 | 2006 Sep 17 | 1000 | 2.085 | 17.48 |
The LowRedux pipeline developed by J. Hennawi, S. Burles, and JXP was used to reduce the MMT data 111http://www.ucolick.org/xavier/LowRedux. Standard techniques were used to flat-field and bias subtract the raw MMT data. Objects in the CCD images were traced with a low-order polynomial and extracted optimally. The resulting 1D spectra were calibrated with a composite HeNeAr and HgCd arc lamp spectrum. Instrument flexure was compensated for by shifting the extracted sky spectrum to a template spectrum of the sky convolved with the spectral resolution of the BCS. If more than one spectrum was taken of the same QSO, the multiple exposures were coadded into a single spectrum, weighting by the median S/N ratio of each. The spectra were fluxed using an observation of a spectrophotometric standard star taken on the same night of observation with identical instrumental configuration. The final data products are wavelength and flux calibrated 1D spectra. These are publically available online222http://www.ucolick.org/xavier/DLA/MSDLA.
For the QSOs that have spectra in the SDSS Data Release 6 (Adelman-McCarthy et al., 2008), we compared the SDSS and MMT spectra visually as a consistency check on our data reduction. When comparing the MMT spectra to the SDSS spectra, the relative flux of the MMT spectra did not always match the flux of the SDSS spectra. We take the SDSS fluxing to be correct and scaled the flux of our MMT spectra correspondingly. The correction was a simple multiplicative scalar; we estimate that the relative fluxing of the MMT is accurate to . This scaling process is further elaborated upon in our discussion on searching for reddening by MSDLAs in Section 5.
While comparing the MMT spectrum to the SDSS spectrum from the years 2006.96 and 2002.18 of cMSDLA J1054+0348, two blueshifted broad absorption line features appeared in the newer MMT spectrum in the that were not present in the older SDSS spectrum. The time between observations was 4.78 years. This serendipitous discovery is the first observation of a high redshift QSO where associated absorption lines were observed to appear (Hamann et al., 2008). These absorption lines signify the appearance of a high velocity outflow in the QSO along the line of sight.
No other variable absorption features were identified in the spectra.
3. Determination of column densities from DLA Ly absorption
The principal motivation for the observations analyzed here was to measure the H I column densities of cMSDLAs. The MMT observations provide spectral coverage of the previously unobserved Ly transition. With these data, values can be estimated from line-profile fits to the Ly lines (e.g. Prochaska et al., 2005). These values are required to establish the gas metallicity and to verify that a system satisfies the DLA criterion. The cMSDLAs which satisfy both the DLA criterion () and metal-strong criterion (H06) are then classified as MSDLAs.
The Ly lines were analyzed using the program x_fitdla from the XIDL package333http://www.ucolick.org/xavier/IDL. For completeness, we considered all Ly lines in our dataset with equivalent widths exceeding Å, independent of whether the system was a cMSDLA. For two of the cMSDLAs in our MMT sample (J1111+1336 and J21000641) whose redshifts exceed zabs , the Ly absorption feature was redshifted past our wavelength coverage. This is because we were searching for molecular hydrogen in these QSOs (see Section 4). These DLAs were analyzed using spectra from the SDSS DR6 instead. A total of 49 possible DLAs were identified, that includes serendipitous DLAs along the sightlines (i.e. ones that were not targeted as MSDLA candidates). Redshifts for each DLA were estimated from the centroids of corresponding low-ion metal transitions, with preference given to the O I 1302 transition as listed in Table 2.
| QSO | [M/H]c | cMSDLA? | MSDLA?e | ||||
|---|---|---|---|---|---|---|---|
| ( | () | (Å) | |||||
| J000815.33-095854 | 1.768 | Yes | Yes | ||||
| J001602.40-001225 | 1.970 | Yes | No | ||||
| J002028.96+153436 | 1.653 | Yes | No | ||||
| J004439.32+001822 | 1.725 | Yes | No | ||||
| J005814.31+011530 | 2.010 | Yes | No | ||||
| J012020.37+132433 | 1.999 | Yes | No | ||||
| Q0201+36 | 1.955 | No | … | ||||
| Q0201+36 | 2.463 | Yes | No | ||||
| J031609.83+004043 | 2.180 | Yes | No | ||||
| J075537.22+234204 | 1.670 | Yes | … | ||||
| J075636.73+164850 | 1.973 | Yes | … | ||||
| J081240.68+320809 | 2.626 | Yes | Yes | ||||
| J081240.68+320809 | 2.067 | No | No | ||||
| J082058.37+081948 | 1.955 | Yes | … | ||||
| J083108.01+402531 | 2.084 | Yes | … | ||||
| J084032.96+494252 | 1.851 | Yes | No | ||||
| J085618.23+335042 | 1.655 | Yes | … | ||||
| J091247.59-004717 | 2.071 | Yes | Yes | ||||
| J092708.88+582319 | 1.635 | Yes | No | ||||
| J093846.77+380549 | 1.827 | Yes | … | ||||
| J095829.47+422256 | 1.853 | Yes | … | ||||
| J095829.47+422256 | 2.065 | Yes | … | ||||
| J100916.94+545003 | 1.623 | Yes | … | ||||
| J100916.94+545003 | 1.892 | Yes | … | ||||
| J101939.15+524627 | 1.833 | No | … | ||||
| J101939.15+524627 | 2.018 | Yes | … | ||||
| J102904.15+103901 | 1.622 | Yes | … | ||||
| J104915.43-011038 | 1.658 | Yes | No | ||||
| J105400.41+034801 | 2.068 | Yes | … | ||||
| J105648.69+120826 | 1.609 | Yes | Yes | ||||
| J105752.70+150614 | 1.865 | No | … | ||||
| J105752.70+150614 | 2.076 | Yes | … | ||||
| J111119.10+133603 | 3.201 | Yes | … | ||||
| J122438.42+552514 | 1.673 | Yes | … | ||||
| J131040.24+542449 | 1.600 | No | … | ||||
| J131040.24+542449 | 1.801 | Yes | Yes | ||||
| J131201.09+550228 | 1.860 | Yes | … | ||||
| J134144.63+581817 | 1.741 | Yes | … | ||||
| J135750.92+345023 | 2.132 | Yes | … | ||||
| J161009.42+472444 | 2.508 | Yes | Yes | ||||
| J170909.28+325803 | 1.830 | Yes | Yes | ||||
| J210025.03-064146 | 3.092 | Yes | No | ||||
| J212329.46-005052 | 2.058 | Yes | … | ||||
| J212521.44+002906 | 1.751 | Yes | … | ||||
| Q2206-19 | 1.920 | Yes | No | ||||
| Q2206-19 | 2.076 | No | No | ||||
| J222256.11-094636 | 2.354 | Yes | No | ||||
| J224452.22+142915 | 1.816 | Yes | No | ||||
| J234023.66-005327 | 2.055 | Yes | No |
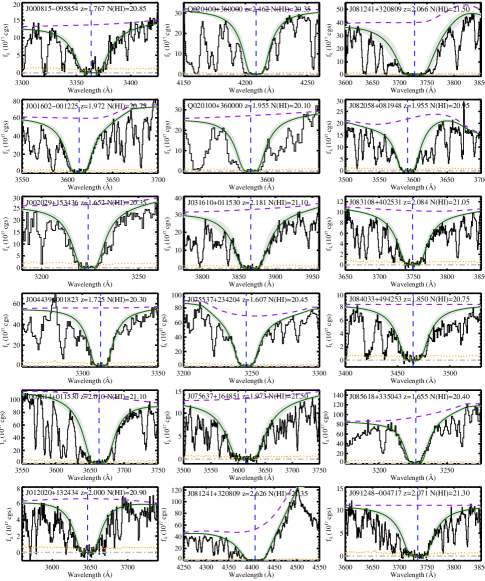
With the redshift of the possible DLA constrained, we measured the H I column density as follows. First, the continuum from the background QSO is modeled by hand in the region local to the Ly line. The centroid of the Ly line is given by the previously measured redshift. Then a Voigt profile is fit to the Ly absorption feature by visual inspection. The value of is adjusted until the wings of the profile best fit the observed Ly line. The continuum and values were then iteratively modified (generally by from our initial guess) until an optimal match to the data was established. The resulting profile gives the H I column density directly. All of the values are listed in Table 2. The errors in these values are dominated by systematic uncertainties, primarily continuum placement and line-blending in the damped wings of the Voigt profile. In all cases, we assumed a minimum error of 0.15 dex. We estimate larger uncertainties for DLAs where the QSO continuum is especially challenging, there is significant emission-line contamination from the QSO and/or if there is substantial line-blending with the Ly forest. All of our Voigt profile fits are presented in Figure 1.
We have compared our values with existing estimates from the literature. Previous measurements of H I column densities were found for eight of the absorption systems we observed. Four of these previous measurements from the literature were made at significantly higher spectral resolution (Prochaska & Wolfe, 1996; Prochaska et al., 2003b, 2001). We have adopted these H I column density measurements over our own (see fourth column of Table 2). In all cases the difference is well within our estimated error. We caution, however, that because the uncertainties are dominated by systematic error that are largely independent of the spectral resolution and signal-to-noise, the good agreement does not mean that we have overestimated the uncertainties (see also Prochaska et al., 2005).
We targeted 43 systems as cMSDLAs, most of which had no prior H I column density measurements. Beyond the 43 absorption systems targeted, five QSO slight lines contain a second absorption system. This brings the total amount of Ly absorbers to 49. Out of the 49 Ly absorption systems identified, 42 have H I column densities that satisfy the DLA criterion ( atoms cm-2). The remainder are super Lyman limit systems (SLLS) with . All but two of the cMSDLAs are confirmed as damped Ly systems. The two SLLS that were also cMSDLAs (J21230050 at and J1009+5450 at ) may represent new examples of super-solar Lyman limit systems (e.g. Péroux et al., 2006; Prochaska et al., 2006).
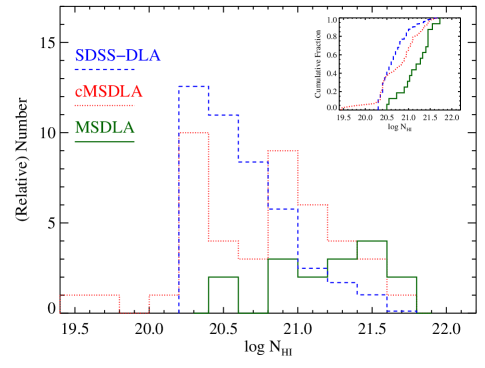
Figure 2 shows a histogram of H I column densities for MSDLAs, our sample of cMSDLAs, and a comparison sample of randomly selected DLAs from the SDSS-DR5 (Prochaska & Wolfe, 2009). The latter sample contains 380 DLAs with . Although the median redshift of this control sample is higher than metal-strong systems, Prochaska & Wolfe (2009) have demonstrated that evolution in the shape of the H I frequency distribution is weak for DLAs. The MSDLAs and cMSDLAs show systematically higher H I column densities then the comparison sample. Formally, a two-sided KS test yields probabilities that cMSDLAs and MSDLAs respectively are drawn from the same parent population as the control sample. This is consistent with the expectation that selecting systems with high metal column densities will select systems with high H I column densities.
4. Metal Column Density and Metallicity Measurements
To estimate the metallicities of the MSDLAs we simply compare the measured H I column density with the ionic column density of an element expected to trace the metal abundance of the system. Generally, one avoids refractory elements like Fe because these can be depleted from the gas-phase and may give systematically low metallicity values. Previous work has focused on low-ion transitions of Si, S, and Zn which are mildly refractory, give similar results, and have several low-ion transitions for analysis (e.g. Prochaska & Wolfe, 2001; Prochaska et al., 2003a). Unfortunately, the MMT and SDSS spectra have insufficient spectral resolution for a precise column density measurement. Therefore, we have adopted the ionic column densities for these DLAs from previous works (H06; Prochaska et al., 2007) and new Keck/HIRES observations that will be presented in a future paper (Prochaska et al., in prep.). Measurements of metal column densities exist for 24 of the absorbers in our sample, 22 of which are cMSDLAs. These metal column density measurements test whether a cMSDLA satisfies the metal-strong criteria set by H06: and/or . Those cMSDLAs that meet the metal-strong criteria are classified as MSDLAs. Out of 22 cMSDLAs with metal column density measurements, 7 meet the metal-strong criteria and are classified as MSDLAs. When combined with measurements from the literature, we have a total sample of 15 MSDLAs with .
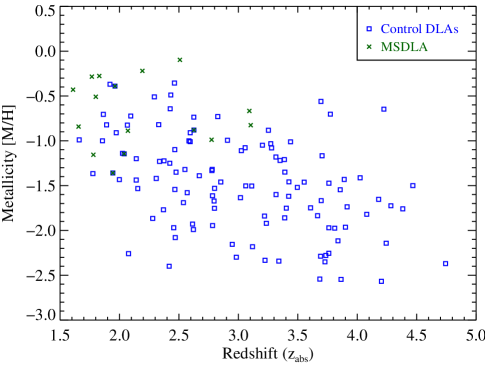
The metallicity of a DLA is usually expressed as the logarithmic ratio of the metal to H I column densities relative to the solar abundance, [M/H]. Here, the letter ‘M’ refers to metallicity, derived from one of the elements listed above. For the solar abundance scale, we adopt the compilation of (Asplund et al., 2009) using meteoritic values when available excepting C, N, and O. The values are listed in Table 2. These new metallicity values allow investigation of several relationships. In the universe, metallicity increases over time from the original abundances created in Big Bang nucleosynthesis as stars evolve and die enriching their surrounding interstellar media. One would expect that metallicities of DLAs to decrease with greater lookback time (here quantified by increasing absorber redshift). In Figure 3, the metallicity of the DLAs is compared with the absorber’s redshift. The DLAs from Prochaska et al. (2003a), which are taken as a random sample, follow the expected trend. The MSDLAs exhibit systematically higher metallicity than the random sample over the range of redshifts covered. Specifically, we measure a median metallicity for the MSDLA of [M/H] dex over the redshift interval and calculate a median [M/H] dex from the control sample over the same interval. We expect this result since the MSDLAs are selected for their high metal column densities, which should select systems with high metallicities across a range of redshifts.
DLAs, by definition, contain a large amount of neutral hydrogen. It can be expected that some might also contain large amounts of molecular hydrogen (H2), especially if the QSO sight-line probes a high density region of the DLA. H2 has been detected in DLAs by previous authors (e.g. Ge & Bechtold, 1997; Petitjean et al., 2000). Three of the cMSDLAs show evidence of H2 in their spectra. These systems are J0812+3208 (), J21000641 (), and J23400053 (). The remainder of the systems show no obvious H2 absorption at the strong transitions of the and levels (i.e. atoms cm-2). We conclude that only 3 out of the 32 systems have significant absoprtion giving a detection rate of . This is a surprisingly low detection rate given that the systems have systematically higher metallicity than random samples of DLAs. Indeed, Noterdaeme et al. (2008) report a detection rate of for systems with [M/H] to a similar limit on . The incidence is higher (2 of 6 for systems with good coverage of the Lyman-Werner transitions) if we restrict the discussion to MSDLAs, but this sample is too small for statstical discussion.
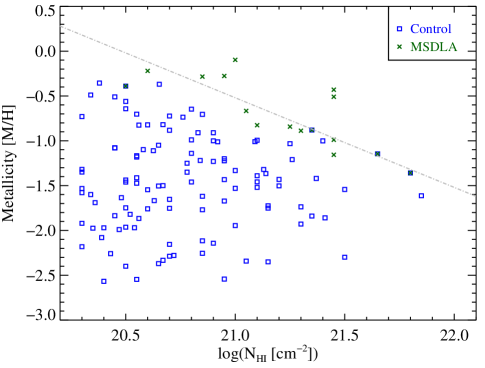
Figure 4 compares the metallicity of DLAs to their H I column densities () for the MSDLAs and cMSDLAs along with the same random sample (Prochaska et al., 2003a). Most of our confirmed MSDLAs lie on or beyond the upper bound on metallicity/ discussed by Boisse et al. (1998), who suggested this upper bound is caused by obscuration of the background QSO by large amounts of dust. In fact, MSDLAs must by definition be near or above this upper bound. Our observations of MSDLAs clearly lie beyond this limit, indicating that dust does not always completely obscure systems with very high metal column densities (see also H06). This lends further support to prior assertions that this observational bound was not driven entirely by obscuration (Ellison et al., 2005; Krumholz et al., 2009). The consistently higher metallicity of MSDLAs could incidate that their sightlines probe regions near the center of galaxies (or proto-galaxies) if a radial gradient in metallicity exists for high galaxies. Alternatively, the higher metallicity may indicate that MSDLAs probe more chemically evolved systems and, if a mass-metallicity relation holds at high (e.g. Erb et al., 2006; Prochaska et al., 2008), higher mass galaxies.
To test the latter hypothesis, we examined the relation between Si II 1526 equivalent width and the gas metallicity. A random sample of DLAs was shown by Prochaska et al. (2008) to exhibit a correlation between these two measures, which the authors interpret as a mass-metallicity relation (see also Murphy et al., 2007). The key point is that is dominated by the kinematics of the gas, generally weaker ‘clouds’ that contribute little to the column density of Si+. More massive systems have higher gravitational potentials, thus faster rotational and/or virial motion which leads to a greater broadening of Si II 1526. values for the systems in this sample have been measured using Keck HIRES and ESI spectra by (H06; Prochaska et al., 2007) and Kaplan et al. (in prep). These metal-strong systems probe a higher range of metallicities than previous observations, extending the vs. [M/H] relation. Figure 5 shows this relationship for our data and a random sample of DLAs with lower metallicities taken from Prochaska et al. (2003a).
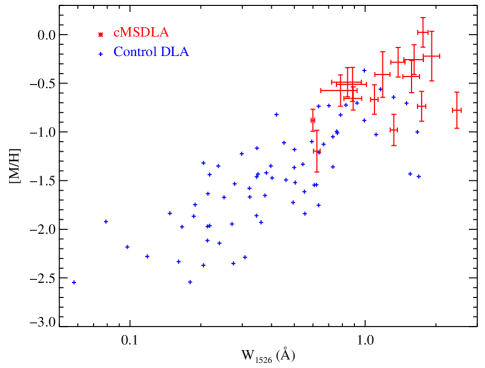
Our new measurements indicate the -metallicity relationship holds to solar metallicity with roughly constant scatter. If there is an underlying mass-metallicity relationship then the MSDLAs, with their systematically higher metallicities, also represent the subset of DLAs with highest mass. These are ideal candidates for follow-up imaging surveys if one wishes to maximize observing efficiency (Möller et al., 2004).
5. Dust Extinction
Dust in the Galaxy’s interstellar medium is known to absorb and scatter the light from background objects. Dust consists of grains of heavy elements that have solidified out of the atmospheres of cool stars and the interstellar medium. MSDLAs, with their high metal column densities, make good candidates to search for dust in the high redshift universe and set (rare) constraints on the properties of such dust, e.g. the dust-to-metals ratio, extinction laws.
This absorption is most efficient at short wavelengths, and has the tendency to redden the color of the background light source. This process is known as extinction and approximately follows a relation. In the case of QSO absorption systems like DLAs, dust in the DLA reddens the color of the background QSO. Extinction () is defined as the change in magnitude due to dust absorption. Reddening is the difference in extinction between two bands, most commonly reported between and as .
Extinction in a large sample of DLAs from the SDSS have been studied photometrically. Vladilo et al. (2008) found evidence for reddening in a large sample of DLAs when compared to QSOs that contain no absorbers. Previously, Vladilo et al. (2006) found evidence for reddening in 5 out of 13 DLAs selected to have strong Zn II absorption lines. Several of these 5 systems qualify as MSDLAs. In fact two are also in our sample of MSDLA candidates (J00160012 and J23400053) and both show evidence of reddening. The high metal column densities in MSDLAs suggest that they may contain a large amount of dust. If photometric studies of DLAs find evidence for dust in two systems that are metal strong candidates, it is plausible that many more cMSDLAs will also yield evidence for dust.
5.1. Quasar Power-Law Slopes
In principle, analysis of spectrophotometric observations for reddening are ideal because the extinction can be explored as a function of wavelength. In practice, this is difficult because the intrinsic shape of the background QSO continuum is unknown and is likely to vary with significant scatter. While this makes constraining reddening for individual systems difficult, one may explore systematic shifts in the overall population by essentially averaging over the scatter in intrinsic QSO continua. A spectroscopic search for reddening in DLAs was previously conducted by Murphy & Liske (2004) who fit a power-law () to the QSO continuum for each system and compared the exponent to a control sample of QSOs. These DLAs were not selected to be metal strong, and the authors did not detect reddening along the 70 DLA sightlines. We now conduct the same type of analysis, but with our sample of cMSDLAs.
The typical QSO spectrum in the optical and ultraviolet consists of two distinct features. The continuum spans across all wavelengths and is shaped by one or more power-laws (e.g. Telfer et al., 2002). Broad emission lines, such as Ly, lie on top of the continuum. Our spectra of cMSDLAs taken with the MMT/BCS covers a wavelength range of to 5100Å, the blue end of the visible spectrum. Most of the cMSDLAs also have corresponding SDSS DR6 spectra, covering a wavelength range of 3800 to 9200 Å. Both the MMT and SDSS spectra provide a wide coverage of wavelengths spanning the UV spectrum in the QSO rest-frame.
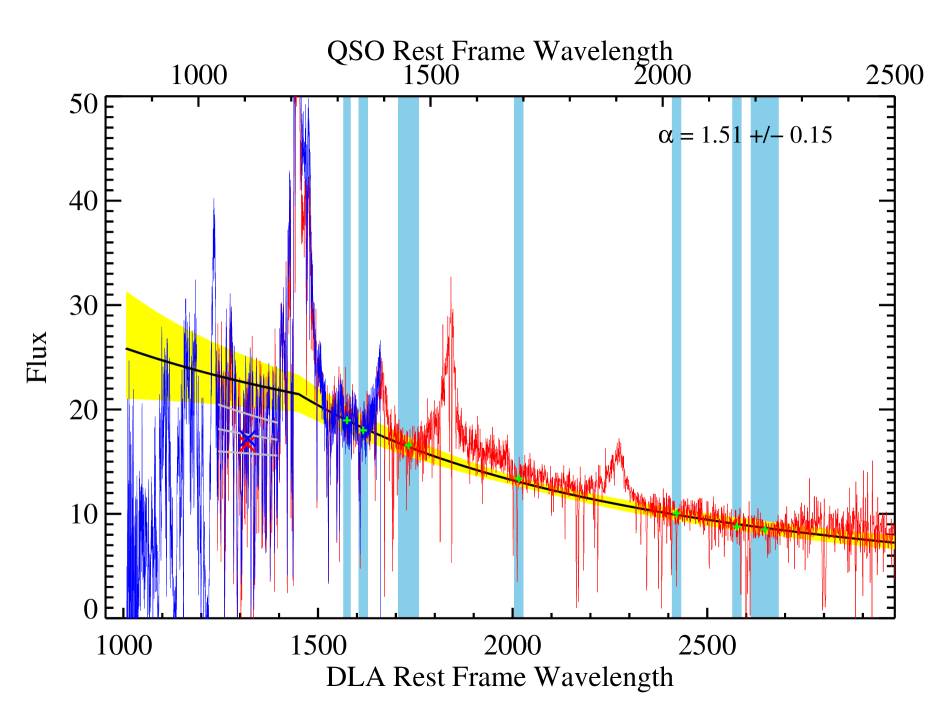
The first step in this analysis is to model the QSO’s continuum spectrum by fitting a power-law to the regions in the spectrum free from QSO emission lines:
| (1) |
See Figure 6 for an example of our power-law model. This is based on a similar method created by Murphy & Liske (2004). The seven ‘emission free’ (EM-free) regions are 1312-1328, 1345-1365, 1430-1475, 1680-1700, 2020-2040, 2150-2170, and 2190-2250 Å in the QSO rest frame. We mask emission-free regions which are unreliable or contaminated by absorption lines from the DLA. The median flux and central wavelength in each emission free region form points from which the power-law curve is fitted. We normalize our power-law fit to the QSO’s flux at 1700 Å. This fit is done in the SDSS spectrum because the fluxing is presumed to be accurate and the SDSS spectrum covers longer wavelengths redward of the QSO’s Ly line where the Ly forest cannot contaminate the continuum flux. We derived a statistical error on using the IDL program ’curvefit.’ These ranged from from approximately in . It is evident from inspection of the data and model that these are frequently poor estimates of the total uncertainty. We estimate the total uncertainty (statistical and systematic) to be .
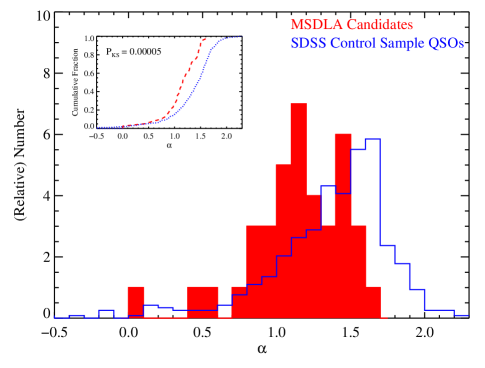
The exponent of the power-law () presumably becomes depressed when the background QSO is reddened by dust. The analysis by Murphy & Liske (2004) could not find any significant difference between the exponents for ordinary non-metal strong DLAs and a control sample of QSOs. The same comparison is done using our sample of cMSDLAs, as seen in Figure 7. (Table 3). For each cMSDLA, we construct a control sample of randomly selected QSOs with a similar redshift (zabs=0.2) and -magnitude (=0.355 mag). The latter value was chosen to give at least 12 systems in the control sample for each cMSDLA. The cMSDLA sample exhibits systematically lower then the combined control sample, indicating they are reddening their background quasars. This is true for both median (see below) and mean statistics indicating there is reddening by the bulk of the cMSDLAs. This contrasts with the results from Murphy & Liske (2004) who found no conclusive evidence for reddening in ‘random’ DLAs. The difference in the median exponent of the control sample and the median exponent of the cMSDLAs is defined to be . We measure and giving . In the following section we use to constrain the typical extinction and reddening by dust in these systems.
| QSO | Dust Absorption | Dust Absorption | |||||
|---|---|---|---|---|---|---|---|
| (MMT) | (SDSS) | (cm-2) | |||||
| J0008-0958 | 1.9512 | 1.7669 | 1.27 | 0.27 | 20.57 | ||
| J0016-0012 | 2.0869 | 1.9720 | 1.05 | 0.05 | 19.97 | ||
| J0020+1534 | 1.7635 | 1.6521 | 1.16 | 0.16 | 19.84 | ||
| J0044+0018 | 1.8677 | 1.7245 | 1.29 | 0.29 | 19.64 | ||
| J0058+0115 | 2.4949 | 2.0134 | 1.60 | 0.60 | 20.12 | ||
| J0120+1324 | 2.5671 | 1.9998 | 1.50 | 0.50 | 20.32 | ||
| J0316+0040 | 2.9206 | 2.1805 | 0.98 | -0.02 | 19.90 | ||
| J0755+2342 | 1.8249 | 1.6702 | 1.29 | 0.29 | … | ||
| J0756+1648 | 2.8656 | 1.9730 | 1.05 | 0.05 | … | ||
| J0812+3208 | 2.7105 | 2.6257 | 1.02 | 0.02 | 20.47 | ||
| J0820+0819 | 2.5191 | 1.9545 | 1.22 | 0.22 | … | ||
| J0831+4025 | 2.3300 | 2.0841 | 1.33 | 0.33 | … | ||
| J0840+4942 | 2.0763 | 1.8502 | 0.97 | -0.03 | 20.32 | ||
| J0856+3350 | 1.7256 | 1.6545 | 1.16 | 0.16 | … | ||
| J0912-0047 | 2.8593 | 2.0710 | 1.49 | 0.49 | 20.43 | ||
| J0927+5823 | 1.9100 | 1.6350 | 0.01 | -0.99 | 20.18 | ||
| J0938+3805 | 1.8274 | 1.8266 | 0.58 | -0.42 | … | ||
| J0958+4222 | 2.6558 | 2.0650 | 1.51 | 0.51 | … | ||
| J1009+5450 | 2.0616 | 1.8922 | 1.09 | 0.09 | … | ||
| J1019+5246 | 2.1701 | 2.0181 | 1.43 | 0.43 | … | ||
| J1029+1039 | 1.7946 | 1.6221 | 1.04 | 0.04 | … | ||
| J1049-0110 | 2.1153 | 1.6580 | 1.13 | 0.13 | 19.61 | ||
| J1054+0348 | 2.0947 | 2.0682 | 1.45 | 0.45 | … | ||
| J1056+1208 | 1.9227 | 1.6091 | 1.20 | 0.20 | 21.04 | ||
| J1057+1506 | 2.1690 | 2.0761 | 1.64 | 0.64 | … | ||
| J1111+1336 | 3.4816 | 3.2011 | 1.46 | 0.46 | … | ||
| J1224+5525 | 1.8788 | 1.6727 | 1.45 | 0.45 | … | ||
| J1310+5424 | 1.9292 | 1.8004 | 0.43 | -0.57 | 20.96 | ||
| J1312+5502 | 1.9065 | 1.8604 | 0.91 | -0.09 | … | ||
| J1341+5818 | 2.0542 | 1.7407 | 1.10 | 0.10 | … | ||
| J1357+3450 | 2.9214 | 2.1316 | 0.86 | -0.14 | … | ||
| J1610+4724 | 3.2169 | 2.5078 | 1.15 | 0.15 | 21.02 | ||
| J1709+3258 | 1.8891 | 1.8300 | 0.82 | -0.18 | 20.69 | ||
| J2100-0641 | 3.1376 | 3.0920 | 1.50 | 0.50 | 20.38 | ||
| J2123-0050 | 2.2623 | 2.0582 | 1.39 | 0.39 | … | ||
| J2125+0029 | 1.9505 | 1.7510 | 1.11 | 0.11 | … | ||
| J2222-0946 | 2.9263 | 2.3545 | 0.89 | -0.11 | 19.94 | ||
| J2244+1429 | 1.9546 | 1.8153 | 1.32 | 0.32 | 19.81 | ||
| J2340-0053 | 2.0845 | 2.0541 | 0.74 | -0.26 | 19.76 |
5.2. Constraining the Extinction and Reddening
The value of found in the previous section indirectly reveals the average flux absorbed by the cMSDLAs sample via dust reddening. In this section we use to estimate the average extinction () and reddening ().
Total extinction at a given wavelength is defined as:
| (2) |
We also wish to constrain the reddening , but we do not have wavelength coverage of the B and V bands in the absorber rest frame. Instead, we take a reddening value in the ultraviolet and then use an assumed extinction law to convert into .
The control sample of QSOs with no absorption systems give an intrinsic flux where no light is absorbed by dust. The sample of cMSDLAs represent systems where flux is lost to dust absorption . We model the flux of the QSO continuum as the power-law seen in Equation 1. For two wavelengths and , the reddening may be written as
To evaluate the reddening, we set and to values representative of the emission-free windows in our analysis of the quasar continuum. The analysis typically covers Å in the quasars’ rest-frame. Converting from the median QSO redshift of to the median absorber redshift of gives Å and Å. For , we infer mag.
To convert to , we must assume an extinction law. Observations to date suggest that DLAs exhibit SMC-like extinction (York et al., 2006; Wild & Hewett, 2005) and we adopt this as our default extinction law (and test this assumption in the following sub-section). With the SMC law, we infer mag and an average -band extinction mag where we assumed . The latter is the favored value for the Galaxy, but also roughly holds for the SMC. This value is systematically higher than any previously estimated for the DLAs (Murphy & Liske, 2004; Ellison et al., 2005; Vladilo et al., 2008) as expected for a sample of absorbers pre-selected to have larger metal column densities.
| Object(s) | Reference | |
|---|---|---|
| candidate MSDLAs | ||
| SMC | Gordon et al. (2003) | |
| Milky Way | Bohlin et al. (1978) | |
| 248 DLAs | to | Vladilo et al. (2008) |
With our predicted values for extinction and reddening, we can estimate the dust-to-gas ratio for the cMSDLAs. The cMSDLAs have a median H I column density of log = 20.85 dex giving a median dust-to-gas ratio of for the SMC extinction law. We ignore the contribution of molecular hydrogen because it is expected to be a negligible contribution to the total amount of hydrogen ( 4). A comparison to dust-to-gas ratios in the literature can be seen in Table 4. Our value for the dust-to-gas ratio of cMSDLAs is very similar to the SMC value (Gordon et al., 2003), with a difference of only 0.1 dex. Vladilo et al. (2006) suggests that the dust-to-gas ratio scales with metallicity. We have metallicity values for 22 of the cMSDLAs, giving a median metallicity of [M/H] . This roughly follows the expected trend of dust-to-gas ratio vs. metallicity suggested by Vladilo et al. (2006). We conclude, therefore, that the dust-to-gas properties of the MSDLAs are generally consistent with that observed in the SMC. We also note that these inferences are subject to the assumed extinction law.
5.3. The Possibility of the 2175 Å Bump
To test the assumption of an SMC-like extinction law, we have searched for the 2175 Å bump characteristic of a Galactic extinction law. The exact nature of the 2175 Å bump is unclear. It is thought to arise from the fine structure transitions of Polycyclic Aromatic Hydrocarbon (PHC) molecules in the Milky Way Galaxy (Allamandola & Hudgins, 2003). The detection of the 2175 Å bump in the cMSDLAs would infer the existance of PHCs at high redshift (Wang et al., 2004). A visual inspection for a broad absorption feature at 2175 Å in the MMT spectra for each of the cMSDLAs yields no identifiable features. Malhotra (1997) was the first to attempt this sort of analysis. She created a composite spectrum of 96 Mg II absorbers and claimed a detection of the 2175 Å bump. Subsequent studies, however, have not confirmed this result (Ménard et al., 2005). Vladilo et al. (2008) and Vladilo et al. (2006) carried out similar searches using DLA samples. Vladilo et al. (2008) found no conclusive evidence for a 2175Å bump in their data while Vladilo et al. (2006) found evidence for a 2175Å bump in 1 out of 8 possible systems pre-selected to have very strong metal absorption. Although rare in DLAs, it is important to search for the 2175Å bump to test our use of an SMC-like extinction law. A composite spectrum of the cMSDLAs (shifted into the absorber rest frame) with a significantly higher signal-to noise ratio might yield evidence for a 2175 Å bump.
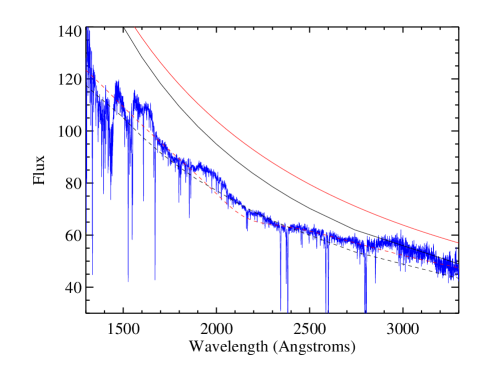
We constructed a composite spectrum of all our cMSDLAs by shifting each of their SDSS spectra into the DLA rest-frame, binning the pixels with 0.5 Å bins, and finding the weighted mean for all the pixels in each bin. We attempt to compensate for variation in the brightness of each QSO by having each individual spectrum scaled so that the median flux between 1000 and 1800 Å (QSO rest-frame) equals 100. The composite SDSS spectrum of the cMSDLAs can be seen in Figure 8. Examining this composite spectrum does yield a possible broad absorption feature at 2135 Å. This identification is questionable because of the high amount of irregularity in the continuum of the composite spectrum. This irregularity is caused by overlapping QSO broad emission lines from the individual spectra getting smeared out in the composite. The relatively low number of systems stacked in the composite spectrum is not enough to completely smooth out the emission lines intrinsic to the QSOs, where normally a composite of hundreds of systems would be needed. Two extinction law models are created, one for a MW-like extinction law and another for a SMC-like extinction law, which are overplotted with the composite cMSDLA spectrum. For each extinction model, a continuum is modeled with a power-law () which is then artificially reddened with the respective extinction law to match the composite spectrum. These models can be seen in Figure 8. The results of these fits are inconclusive. We conclude that the assumption of an SMC-like extinction law is justified although not required by our data.
5.4. Extinction Per Unit Column Density of Iron in Candidate MSDLAs
Previous works have asserted that gas in the DLAs and the ISM of local galaxies conforms to a nearly constant extinction per column density of metals in the dust phase (Vladilo et al., 2006). We can further explore this assertion with out sample of DLA systems. Specifically, the extinction per unit column density of iron in the dust phase, , is given by:
| (5) |
where is the dust phase column density of iron and is the fraction of total iron atoms in the dust. The value of is often estimated by assuming Fe/Zn has an intrinsic, solar relative abundance, i.e. , assuming Zn has a negligible depletion into dust grains. If the extinction properties of dust are the same throughout the universe, one would expect that across a range of redshifts and metallicities. If this is true, then is expected to be similar for any sight line, whether in our the Galaxy or in high redshift DLAs (Vladilo et al., 2006).
We proceed assuming a solar iron-to-zinc abundance ratio (Asplund et al., 2009) for the cMSDLAs and that all of the iron is in the dust phase (). Of the 43 cMSDLAs, twenty-two have previous metallicity measurements with an average zinc column density of dex. With mag, we obtain mag cm2 for the cMSDLA sample. This result is comparable to the value estimated by Vladilo et al. (2006) for a set of similar systems. It further supports their assertion that dust in the DLAs exhibits a roughly average extinction per column density of metals. In turn, this result stresses that the MSDLAs are excellent candidates to examining reddening by the ISM of high galaxies.
5.5. Dust Absorption for Individual Systems
While we have measured the average extinction and reddening of the cMSDLAs, we would like to measure absorption by dust in each individual system. This is challenging because the intrinsic QSO continua are unknown and likely exhibit large scatter. The previous analysis shows that is depressed for the cMSDLAs and the power-law used to model the QSO continuum does provide a lower limit on the intrinsic flux which can be used. We use the previous power-law fits to extrapolate the QSO continuum further into the blue, specifically in the region between the QSO’s Ly and Ly emission lines. Departures from a strict power-law may indicate dust extinction and, in principle, could yield the extinction law for individual galaxies at far-UV wavelengths. In practice, however, our uncertainty on the intrinsic spectrum and (more importantly) absorption by the Ly forest complicates the analysis. Nevertheless, this presents a test of our previous analysis from the power-law slopes measured outside the Ly forest ( 5.1).
The continuum of a QSO redward of Å is well characterized by a single power-law . In the far-UV, however, there is believed to be a break in this power-law to a second power-law . We define the difference in exponents between these two power-laws as . Composite QSO HST spectra by Telfer et al. (2002) gives with a break at 1250 Å. A similar analysis by Zheng et al. (1997) gives =0.970.16 with a break at 1050 Å. For our analysis, we adopt a value of =1.0 with a break at the QSO’s Ly emission line (1216 Å).
For each quasar, we create a model continuum by fitting to emission-free regions in the SDSS spectrum ( 5.1). The shape of the continuum redward of 1216Å is described by a power-law with the exponent . This initial power-law breaks blueward of 1216Å and becomes a second power-law with , such as:
| (6) |
Our model QSO continuum is derived from the SDSS spectrum because it is assumed to have accurate flux and covers redder wavelengths where extinction is reduced. By extrapolating the model continuum into the blue, we aim to place a lower limit on the dust absorption in each system. We use the wavelengths between the QSO’s Ly and Ly emission lines to measure the dust absorption (1070 to 1170 Å). In this way the results are not contaminated by the QSO’s emission lines. To estimate the contribution of the Ly forest to the absorbed flux, we used values for the average absorption by the Ly forest (DA) provided by Kirkman et al. (2005):
| (7) |
The flux in the region of extrapolated QSO continuum between the QSO’s Ly and Ly emission lines is then multiplied by DA to scale it down to the estimated flux after Ly forest absorption. To avoid contamination from the DLA’s Ly absorption line, each line is individually masked out. Furthermore, the MMT spectrum blueward of 3190Å is avoided because of excessive noise. The mean flux of the Ly to Ly region in both the SDSS and MMT spectra is then compared with the mean flux of the same region in the model continuum. If the mean flux of the model continuum is higher than the mean flux of the actual continuum, we attribute the lower than expected flux to absorption by dust in the DLA.
The fraction of observed flux compared to flux predicted by the model QSO continuum is termed d and is calculated as follows,
| (8) |
where is the average observed flux between 1070 and 1170Å and is defined as:
| (9) |
Finally, is the average flux of the model QSO continuum between 1070 to 1170 Å and is given by
| (10) |
(1-DA) is the predicted fractional throughput of flux after absorption by the Ly forest. The individual results for d can be seen in Table 3. If the parameter d truly scales with the amount of dust in a system, one would expect it is correlated with the system’s measured metal column density.
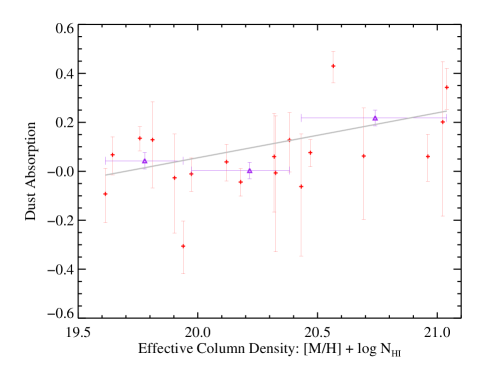
For the latter, we introduce an effective column density that characterizes the total metal column density for the absorber. We plot d vs. in Figure 9. A regression line fit to the data gives a slope of 0.185 0.046 (statistical error). A bootstrap analysis of 10,000 random samplings of the dataset indicates a positive slope at 95% confidence limit. The positive correlation between d and serves as evidence that MSDLAs contain detectable, if not significant, amounts of dust.
Future work will focus on these systems. By obtaining spectrophotometry from optical to near-IR wavelengths, we can constrain the intrinsic slope of the quasar and better estimate the underlying extinction law.
6. Summary and Concluding Remarks
We obtained MMT/BCS spectra of 41 QSO sightlines where previous observations found high metal column densities. We classify these absorption systems as candidate (c)MSDLAs. 49 absorbers with strong Ly lines (Å) were identified, 43 of which correspond to the targeted cMSDLAs. The redshift for all absorption systems was determined visually by finding the centroid of low ion metal transitions. The H I column density ( ) for all absorption systems was measured by visually fitting a Voigt profile to the absorber’s Ly line. Out of 49 absorbers, 42 met the DLA criterion ( atoms cm-2) including all but two of the targeted cMSDLAs. The MSDLAs and cMSDLA show higher systematic H I column densities than comparable systems, in line with the expectation that selecting systems with high metal column density will also select systems with high H I column density.
Using the measured H I column densities and previously measured metal column densities, the metallicity [M/H] for each system was calculated. MSDLAs and cMSDLAs exhibit systematically higher metallicities than DLAs that are not metal strong. This suggests that MSDLA sightlines might probe towards the centers of galaxies where metallicity is greater, assuming a metallicity gradient. Perhaps MSDLAs represent a population of high redshift galaxies that became chemically enriched earlier in their evolution than others. Using these new calculations, we examined and extended the metallicity vs. Si II 1526 EW relation discussed by Prochaska et al. (2008). If this correlation is set by a underlying mass/metallicity relation, then the MSDLAs may represent the highest mass, gas-rich galaxies at high .
We searched for signatures of dust in the cMSDLAs by studying the reddening of the background quasars. A power-law fit to the continuum of the SDSS spectra yielded individual power-laws (parameterized by ) that model the continuum of each QSO. The quasars behind cMSDLAs have lower ’s then a control sample () indicating significant extinction by dust in the cMSDLAs. Assuming an SMC-like extinction law, we estimate mag and for these systems. The dust-to-gas ratio for the cMSDLAs was estimated to be , similar to the ratio for the SMC and roughly following the expected trend of the dust-to-gas ratio scaling with metallicity. The ratio of extinction to dust phase iron column density was estimated to be .
The MSDLAs represent a unique subset of DLAs which are more chemically enriched, massive, dusty, and possibly evolved then ordinary DLAs. As such, they are excellent targets for future studies of extinction, nucleosynthesis, and searches for stellar light and molecular emission lines at high .
References
- Adelman-McCarthy et al. (2008) Adelman-McCarthy, J. K., et al. 2008, ApJS, 175, 297
- Allamandola & Hudgins (2003) Allamandola, L. J., & Hudgins, D. M. 2003, in Solid State Astrochemistry, ed. V. Pirronello, J. Krelowski, & G. Manicò, 251–316
- Asplund et al. (2009) Asplund, M., Grevesse, N., Sauval, A. J., & Scott, P. 2009, ArXiv e-prints
- Bohlin et al. (1978) Bohlin, R. C., Savage, B. D., & Drake, J. F. 1978, ApJ, 224, 132
- Boisse et al. (1998) Boisse, P., Le Brun, V., Bergeron, J., & Deharveng, J.-M. 1998, A&A, 333, 841
- Ellison et al. (2005) Ellison, S. L., Hall, P. B., & Lira, P. 2005, AJ, 130, 1345
- Erb et al. (2006) Erb, D. K., Shapley, A. E., Pettini, M., Steidel, C. C., Reddy, N. A., & Adelberger, K. L. 2006, ApJ, 644, 813
- Ge & Bechtold (1997) Ge, J., & Bechtold, J. 1997, ApJ, 477, L73+
- Gordon et al. (2003) Gordon, K. D., Clayton, G. C., Misselt, K. A., Landolt, A. U., & Wolff, M. J. 2003, ApJ, 594, 279
- Hamann et al. (2008) Hamann, F., Kaplan, K. F., Rodriguez Hidalgo, P., Prochaska, J. X., & Herbert-Fort, S. 2008, ArXiv e-prints
- Herbert-Fort et al. (2006) Herbert-Fort, S., Prochaska, J. X., Dessauges-Zavadsky, M., Ellison, S. L., Howk, J. C., Wolfe, A. M., & Prochter, G. E. 2006, PASP, 118, 1077
- Jenkins (2009) Jenkins, E. B. 2009, ApJ, 700, 1299
- Kirkman et al. (2005) Kirkman, D., et al. 2005, MNRAS, 360, 1373
- Krumholz et al. (2009) Krumholz, M. R., Ellison, S. L., Prochaska, J. X., & Tumlinson, J. 2009, ApJ, 701, L12
- Lu et al. (1996) Lu, L., Sargent, W. L. W., Barlow, T. A., Churchill, C. W., & Vogt, S. S. 1996, ApJS, 107, 475
- Malhotra (1997) Malhotra, S. 1997, ApJ, 488, L101+
- Ménard et al. (2005) Ménard, B., Zibetti, S., Nestor, D., & Turnshek, D. 2005, in IAU Colloq. 199: Probing Galaxies through Quasar Absorption Lines, ed. P. Williams, C.-G. Shu, & B. Menard, 86–91
- Möller et al. (2004) Möller, P., Fynbo, J. P. U., & Fall, S. M. 2004, A&A, 422, L33
- Murphy et al. (2007) Murphy, M. T., Curran, S. J., Webb, J. K., Menager, H., & Zych, B. J. 2007, ArXiv Astrophysics e-prints
- Murphy & Liske (2004) Murphy, M. T., & Liske, J. 2004, MNRAS, 354, L31
- Nagamine et al. (2004) Nagamine, K., Springel, V., & Hernquist, L. 2004, MNRAS, 348, 421
- Noterdaeme et al. (2008) Noterdaeme, P., Ledoux, C., Petitjean, P., & Srianand, R. 2008, A&A, 481, 327
- O’Meara et al. (2007) O’Meara, J. M., Prochaska, J. X., Burles, S., Prochter, G., Bernstein, R. A., & Burgess, K. M. 2007, ApJ, 656, 666
- Ostriker & Heisler (1984) Ostriker, J. P., & Heisler, J. 1984, ApJ, 278, 1
- Pei et al. (1991) Pei, Y. C., Fall, S. M., & Bechtold, J. 1991, ApJ, 378, 6
- Péroux et al. (2006) Péroux, C., Kulkarni, V. P., Meiring, J., Ferlet, R., Khare, P., Lauroesch, J. T., Vladilo, G., & York, D. G. 2006, A&A, 450, 53
- Petitjean et al. (2000) Petitjean, P., Srianand, R., & Ledoux, C. 2000, A&A, 364, L26
- Pettini et al. (1994) Pettini, M., Smith, L. J., Hunstead, R. W., & King, D. L. 1994, ApJ, 426, 79
- Pontzen et al. (2008) Pontzen, A., et al. 2008, MNRAS, 390, 1349
- Prochaska et al. (2008) Prochaska, J. X., Chen, H.-W., Wolfe, A. M., Dessauges-Zavadsky, M., & Bloom, J. S. 2008, ApJ, 672, 59
- Prochaska et al. (2003a) Prochaska, J. X., Gawiser, E., Wolfe, A. M., Castro, S., & Djorgovski, S. G. 2003a, ApJ, 595, L9
- Prochaska et al. (2003b) Prochaska, J. X., Gawiser, E., Wolfe, A. M., Cooke, J., & Gelino, D. 2003b, ApJS, 147, 227
- Prochaska et al. (2005) Prochaska, J. X., Herbert-Fort, S., & Wolfe, A. M. 2005, ApJ, 635, 123
- Prochaska et al. (2003c) Prochaska, J. X., Howk, J. C., & Wolfe, A. M. 2003c, Nature, 423, 57
- Prochaska et al. (2006) Prochaska, J. X., O’Meara, J. M., Herbert-Fort, S., Burles, S., Prochter, G. E., & Bernstein, R. A. 2006, ApJ, 648, L97
- Prochaska & Wolfe (1996) Prochaska, J. X., & Wolfe, A. M. 1996, ApJ, 470, 403
- Prochaska & Wolfe (2001) —. 2001, ApJ, 560, L33
- Prochaska & Wolfe (2009) —. 2009, ApJ, 696, 1543
- Prochaska et al. (2007) Prochaska, J. X., Wolfe, A. M., Howk, J. C., Gawiser, E., Burles, S. M., & Cooke, J. 2007, ApJS, 171, 29
- Prochaska et al. (2001) Prochaska, J. X., et al. 2001, ApJS, 137, 21
- Savage & Mathis (1979) Savage, B. D., & Mathis, J. S. 1979, ARA&A, 17, 73
- Savage & Sembach (1996) Savage, B. D., & Sembach, K. R. 1996, ARA&A, 34, 279
- Telfer et al. (2002) Telfer, R. C., Zheng, W., Kriss, G. A., & Davidsen, A. F. 2002, ApJ, 565, 773
- Vladilo et al. (2006) Vladilo, G., Centurión, M., Levshakov, S. A., Péroux, C., Khare, P., Kulkarni, V. P., & York, D. G. 2006, A&A, 454, 151
- Vladilo et al. (2008) Vladilo, G., Prochaska, J. X., & Wolfe, A. M. 2008, A&A, 478, 701
- Wang et al. (2004) Wang, J., Hall, P. B., Ge, J., Li, A., & Schneider, D. P. 2004, ApJ, 609, 589
- Wild & Hewett (2005) Wild, V., & Hewett, P. C. 2005, MNRAS, 361, L30
- Wolfe et al. (2005) Wolfe, A. M., Gawiser, E., & Prochaska, J. X. 2005, ARA&A, 43, 861
- York et al. (2006) York, D. G., et al. 2006, MNRAS, 367, 945
- Zheng et al. (1997) Zheng, W., Kriss, G. A., Telfer, R. C., Grimes, J. P., & Davidsen, A. F. 1997, ApJ, 475, 469
![[Uncaptioned image]](/html/1004.3319/assets/x10.png)
![[Uncaptioned image]](/html/1004.3319/assets/x11.png)
![[Uncaptioned image]](/html/1004.3319/assets/x12.png)