A Leptonic-hadronic model for the afterglow of gamma-ray burst 090510
Abstract
We model multiwavelength afterglow data from the short Gamma-Ray Burst (GRB) 090510 using a combined leptonic-hadronic model of synchrotron radiation from an adiabatic blast wave. High energy, MeV, emission in our model is dominated by proton-synchrotron radiation, while electron-synchrotron radiation dominates in the X ray and ultraviolet wavelengths. The collimation-corrected GRB energy, depending on the jet-break time, in this model could be as low as erg but two orders of magnitude larger than the absolute ray energy. We also calculated the opacities for electron-positron pair production by rays and found that TeV rays from proton-synchrotron radiation can escape the blast wave at early time, and their detection can provide evidence of a hadronic emission component dominating at high energies.
Subject headings:
gamma-ray burst: individual (GRB090510) – relativistic processes – shock waves1. Introduction
Gamma-Ray Burst science has entered a new era with launch of the Fermi -ray space telescope. The main instrument, Large Area Telescope (LAT), is more sensitive than any previous instrument in the 20 MeV – 300 GeV range (Atwood et al., 2009), whereas the Fermi Gamma-ray Burst Monitor (GBM) observes the whole unocculted sky in the 8 keV – 40 MeV range (Meegan et al., 2009). With the advent of the Burst Alert Telescope (BAT), X-Ray Telescope (XRT) and UV-Optical Telescope (UVOT) onboard the Swift satellite (Gehrels et al., 2004) it is now possible to obtain simultaneous multiwavelength data in the optical to multi-GeV -ray energy range from GRBs.
GRB 090510 is the first GRB to provide data from simultaneous observtions by Fermi (Abdo et al., 2010) and Swift (Hoversten et al., 2009), as well as by a couple of other satellites. At a redshift (Rau et al., 2009) the isotropic-equivalent -ray energy release from this short GRB ( s) is erg with a fluence of erg cm-2 in the 10 keV – 30 GeV range (Abdo et al., 2010). Fermi LAT detected long-lived emission up to s after trigger ( 00:23:00 UT, 2009 May 10) in the MeV range. While such high-energy emission, that is temporally extended beyond the keV – MeV emission, was first detected in GRB 940217 by the Compton Gamma-Ray Observatory (Hurley et al., 1994), this feature is common to most GRBs detected with Fermi LAT. Swift XRT and UVOT collected data from GRB 090510 between s and ks before an Earth Occultation (EO), and again after ks (Hoversten et al., 2009). Swift BAT collected most data within s (15 – 350 keV), and sparsely between s and s (Hoversten et al., 2009).
Smooth temporal evolution of the flux, , of the long-lived emission in Fermi LAT (), and Swift XRT ( before EO) and UVOT ( before EO) observations strongly suggest an afterglow origin (De Pasquale et al., 2010). Synchrotron radiation by shock-accelerated electrons in a decelerating GRB blast wave (Mészáros & Rees, 1997; Sari et al., 1998) have successfully explained much of the broadband afterglow data at radio, optical, and X-ray frequencies in the pre-Fermi era. However fitting combined Fermi and Swift data from GRB 090510 with simple -synchrotron model results in unusual parameter values, and most importantly it is difficult to reconcile the temporal relations (De Pasquale et al., 2010). More complex scenarios have been proposed to model GRB 090510 data such as a radiative fireball in an pair dominated environment (Ghirlanda et al., 2009; Ghisellini et al., 2009), adiabatic fireball in a low density medium and small magnetic field (Kumar & Barniol Duran, 2009a, b; Gao et al., 2009), and two component jet (Corsi et al., 2009).
Here we present a combined leptonic- and hadronic- afterglow model to fit multiwavelength data from GRB 090510. Inclusion of ion acceleration and radiation in the GRB blast wave is a natural and simple extension of the -synchrotron blast wave model, and has been discussed by a number of authors (Böttcher & Dermer, 1998; Totani, 1998a; Zhang & Mészáros, 2001; Wang et al., 2009; Razzaque et al., 2010). We show that LAT emission in the MeV range is dominated by synchrotron radiation from protons accelerated in the external forward shock of a decelerating blast wave. (Note that Razzaque et al. (2010) considered proton-synchrotron radiation from a coasting blast wave.) The XRT and UVOT light curves can be reasonably reproduced by synchrotron radiation from electrons accelerated in the same external forward shock. We present the - and ion- synchrotron afterglow model in Sec. 2, compare this model with GRB 090510 afterglow data in Sec. 3, and discuss our results in Sec. 4.
2. Synchrotron afterglow model
With a coasting bulk Lorentz factor of and an isotropic-equivalent kinetic energy erg, the deceleration time scale for an adiabatic blast wave in a medium of uniform density cm-3 is (Blandford & McKee, 1976; Sari et al., 1998)
| (1) |
Later the bulk Lorentz factor evolves as
| (2) |
where is measured in seconds. At the deceleration time , . The radius of the blast wave, , is given by
| (3) |
The jet-break time at which (Sari et al., 1999), where is the jet opening angle, is given by
| (4) |
The fractions of energy injected in a forward shock (Blandford & McKee, 1976) that channel into electrons111Refererring to both electrons and positrons. and into ions can be calculated from their shock-accelerated spectra. We assume an electron injection spectrum222Comoving frame variables are denoted with primes. for . Here and are the minimum and saturation Lorentz factors, respectively, for the electrons. In case of ions, we assume an injection spectrum for and for . Here is a break in the spectrum and is the saturation ion Lorentz factor. The fraction of shock energy carried by the electrons is
| (5) |
and that by the ions is
| (6) |
Here and are the number fractions of electrons and ions that are accelerated by the shock, respectively, with an equal pre-shock number density .
A fraction of the shock energy is assumed to generate magnetic field, and the magnetic field behind the forward shock is given by (Sari et al., 1998)
| (7) |
In the regime of our interest , the Compton parameter and the energy loss by the electrons is dominated by synchrotron radiation (Sari & Esin, 2001).
The saturation Lorentz factor for electrons is calculated by equating the acceleration time to the synchrotron cooling time in the field (eq. [7]) as
| (8) |
Here is the acceleration efficiency for electrons. The cooling Lorentz factor, found by equating the synchrotron cooling time to the dynamic time , is given by
| (9) |
For ions, of atomic mass and charge , the saturation Lorentz factor is calculated by equating the acceleration time to the shorter of the dynamic time and synchrotron cooling time as
| (10) |
The transition takes place at
| (11) |
Note that the cooling Lorentz factor for ions can be larger than the saturation Lorentz factor (eq. [10]).
To calculate synchrotron spectra at different epoch and light curves at different frequencies arising from a forward shock, it is sufficient to calculate different spectral break frequencies and flux normalization along with their time evolution (e.g. Sari et al., 1998; Chevalier & Li, 2000; Panaitescu & Kumar, 2000; Granot & Sari, 2002).
The characteristic synchrotron frequencies for the electrons with the minimum, saturation and cooling Lorentz factors respectively are given by
| (12) |
A transition from the fast-cooling () to slow-cooling () takes place at
| (13) |
In both the fast- and slow- cooling cases the maximum -synchrotron flux is given by (e.g. Sari et al., 1998)
| (14) |
Here is the luminosity distance. Note that the synchrotron self-absorption frequency is in the radio band (e.g. Panaitescu & Kumar, 2000) and we ignore that while modeling optical to GeV data.
The synchrotron break frequencies for the ions of minimum and cooling Lorentz factors can be expressed as scaling relations to the corresponding break frequencies for electrons as
| (15) |
and for the ions of saturation Lorentz factor (eq. [10]) as
| (16) |
Note that the ion-synchrotron spectrum is always in the slow-cooling regime () as opposed to the -synchrotron spectrum which can be in the fast-cooling regime early and changes to the slow-cooling regime later. The maximum ion synchrotron flux is
| (17) |
for and .
3. Modeling GRB 090510 afterglow data
Figure 1 shows light curves at different energies from the combined leptonic-hadronic model of a decelerating adiabatic blast wave in constant density medium. With an initial , the blast wave decelerates at s (eq. [1]) for the parameters used here: , cm-3.
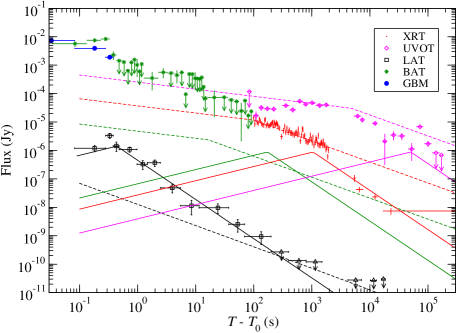
We model LAT emission in the 100 MeV – 4 GeV range in Fig. 1 from -synchrotron radiation () for which . In order to reproduce the flux decay index in this range for a slow-cooling spectrum, one requires . The corresponding spectral index is . For , the -synchrotron flux scales as . A constraint on MeV as early as s requires that (eq. [15]) with . These requirements together with the flux level (eq. [17]) needed to reproduce LAT data constrain the -synchrotron radiation component. The fraction of jet energy needed in shock-accelerated protons (eq. [6]) is for and . The rise of the MeV LAT flux at s could be consistent with the rise before the blast wave enters the self-similar regime (Sari, 1997). The -synchrotron flux in the optical to X-ray is much below the XRT and UVOT data.
We reproduce the XRT light curve, averaged over 0.3 – 10 keV range, with decay index before the EO at ks as from -synchrotron radiation. The required electron index is for in the fast-cooling case, which is valid for a time s (eq. [13]). Note that the spectral index , is close to that of from -synchrotron radiation. In order to produce keV at the beginning of XRT observation at s, we require (eq. [12]). Together with parameter required to produce the XRT flux level, we calculate the fraction of jet energy in electrons to be (eq. [5]) with .
Electron-synchrotron flux in the UVOT range is in the frequency range and scales as . Although the observed flux fitted with (De Pasquale et al., 2010) is different, we note that the expected value of is consistent with UVOT data in the s – 1.43 ks interval, and with the upper limit at s.
It is clear that the observed X-ray and UVOT flux decay indices and , respectively, after the EO at ks (De Pasquale et al., 2010) are softer than the -synchrotron emission. If the jet break takes place in between ks – 5.1 ks, then the expected decay index for is which is intermediate between and since . Because of the idealized nature of the afterglow model and evolution of the blast wave during and after the jet break (e.g. Sari et al., 1999), the observed flux steepening after the EO could still be due to a jet break. For the jet opening angle is (eq. [4]). If the jet-break takes place at ks, then .
As shown in Fig. 1 the BAT flux is quite noisy and can not be reproduced by either - or - synchrotron emission. A similar conclusion was drawn by De Pasquale et al. (2010) based solely on -synchrotron afterglow model. Sporadic emission in the BAT range could be due to central engine activity, working intermittenly at a much reduced emission level than the initial outburst.
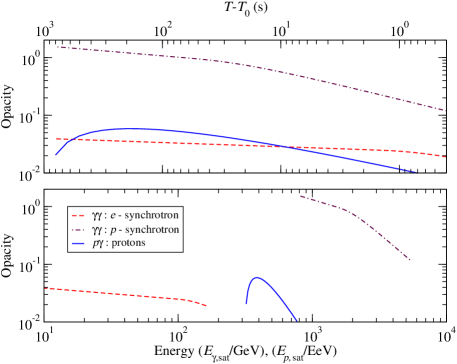
During the early deceleration phase, the soft photon density in the GRB blast wave may be large enough to induce pair production and photohadronic () interactions by protons, and subsequent cascade formation. The target photon density can be calculated as from the synchrotron flux, where .
We calculate the pair production and pion production opacities from their respective cooling time scales and the dynamic time scale for the decelerating blast wave model of GRB 090510. The opacities for the rays with saturation energies, both from the - and - synchrotron emission, and for the protons with saturation energies in Fig. 2. The top panel shows the time dependence (from right to left) of the opacities at the saturation energy reached at that time. The bottom panel shows the opacities vs. the saturation energies reached within the same time interval. Thus the whole time interval of the top panel is squeezed to fit into each of the curves in the bottom panel.
The saturation energies for the -synchrotron rays scale with time as GeV (eq. [12]) for the same model parameters used in Fig. 1. For the -synchrotron, the saturation -ray energy is TeV (eq. [16]) for s (eq. [11]). Thus the -ray saturation energies decrease with time while the opacities increase due to a flux increase of the target photons. However the opacities are small to initiate a substantial pair cascade and accompanying radiation. The same is true for photopion cascade (see, however, Asano et al., 2009), although a small fraction of protons above EeV () can escape as cosmic rays by converting to neutrons. It is interesting to note that the saturation proton energy decreases with time as EeV because of a decreasing bulk Lorentz factor (eq. [2]), even though the saturation Lorentz factor increases with time as (eq. [10]).
4. Discussion and Conclusions
We have fitted the LAT and XRT light curves from - and - synchrotron emissions, respectively, before the EO from an adiabatic blast wave in a constant density medium (Fig. 1). The photon index for MeV emission is for the proton index , and is consistent within of the measured value of the power-law component in the 0.9 s – 1.0 s time interval (Abdo et al., 2010). At earlier time, 0.6 s – 0.8 s, where the power-law component is significant and harder, the agreement is within . However emission below keV in that time interval, which we do not model, may contribute to the hardening of the power-law component. Our model is compatible with photospheric emission which can dominate in the GBM and BAT range (e.g. Razzaque & Mészáros, 2006; Gao et al., 2009; Toma et al., 2010).
The isotropic-equivalent -ray energy release from GRB 090510 is 2–4 orders of magnitude larger than the typical range of - erg for short GRBs, derived from pre-Fermi era data (Nakar, 2007). Our model requires even larger, erg, of isotropic-equivalent energy release in the jet (see, however, Freedman & Waxman, 2001; Eichler & Jontof-Hutter, 2005). Thus the jet of GRB 090510 must be strongly beamed for our model to be viable. Depending on the jet opening angle derived in Sec. 3 from our model fit, the absolute jet energy is in between erg if the jet break takes place between 1.4 – 5.1 ks. For a jet break at ks, the absolute energy release is erg. Note that the inferred absolute energy of the Fermi-LAT GRB sample is generally high, reaching erg in some cases (Cenko et al., 2010). We also note that the microphysical parameter that we derive for GRB 090510 using the combined - and - synchrotron model, is much lower than the typically assumed value for short GRBs in the range - which is derived from long GRB data in the pre-Fermi era using -synchrotron model only (Nakar, 2007). Finally, a confirm detection of large-amplitude and short-time variability, synchronized to the keV - MeV emission, in LAT data will argue against their afterglow origin (see, e.g., Dermer & Mitman, 1999) as we modeled here.
A crucial test for the hadronic emission model in the afterglows of GRBs at redshift , thus avoiding absorption in the extragalactic background light (Razzaque et al., 2009; Finke et al., 2010), may come from ground-based TeV telescopes such as MAGIC, VERITAS, HESS and HAWC. An extrapolation of the LAT flux in the GeV range, where -synchrotron radiation flux is negligible and internal opacity is small (Fig. 2), should produce similar spectra as in LAT and lower flux from -synchrotron radiation. On the contrary, a synchrotron-self-Compton model (e.g. Dermer et al., 2000; Zhang & Mészáros, 2001) is expected to produce a spectral hardening and flux increase in the TeV range.
I thank Fermi LAT and GBM, and Swift team members, especially M. De Pasquale, C. D. Dermer, J. D. Finke, N. Gehrels, S. Guiriec, V. Pelassa and F. Piron, for providing data and useful comments. This work is supported by the Office of Naval Research and NASA Fermi Cycle II GI program.
References
- Abdo et al. (2009) Abdo, A. A. et al. 2009, ApJ, 706, L138
- Abdo et al. (2010) Abdo, A. A. et al. 2010, ApJ, submitted
- Asano et al. (2009) Asano, K., Guiriec, S., & Mészáros, P. 2009, ApJ, 705, L191
- Atwood et al. (2009) Atwood, W. B., et al. 2009, ApJS, 697, 1071
- Blandford & McKee (1976) Blandford, R. D., & McKee, C. F. 1976, Physics of Fluids, 19, 1130
- Böttcher & Dermer (1998) Böttcher, M., & Dermer, C. D. 1998, ApJ, 499, L131
- Cenko et al. (2010) Cenko, S. B., et al. 2010, arXiv:1004.2900
- Chevalier & Li (2000) Chevalier, R. A. & Li, Z.-Y. 2000, ApJ, 536, 195
- Corsi et al. (2009) Corsi, A., Guetta, D., & Piro, L. 2009, arXiv:0911.4453
- De Pasquale et al. (2010) De Pasquale, M., et al. 2010, ApJ, 709, L146
- Dermer & Mitman (1999) Dermer, C. D., & Mitman, K. E. 1999, ApJ, 513, L5
- Dermer et al. (2000) Dermer, C. D., Chiang, J., & Mitman, K. E. 2000, ApJ, 537, 785
- Eichler & Jontof-Hutter (2005) Eichler, D. & Jontof-Hutter, D. 2005, ApJ, 635, 1182
- Freedman & Waxman (2001) Freedman, D. L. & Waxman, E. 2001, ApJ, 547, 922
- Gao et al. (2009) Gao, W.-H., Mao, J., Xu, D., & Fan, Y.-Z. 2009, ApJ, 706, L33
- Gehrels et al. (2004) Gehrels, N., et al. 2004, ApJ, 611, 1005
- Finke et al. (2010) Finke, J. D., Razzaque, S., & Dermer, C. D. 2010, ApJ, 712, 238
- Ghirlanda et al. (2009) Ghirlanda, G., Ghisellini, G., & Nava, L. 2009, arXiv:0909.0016
- Ghisellini et al. (2009) Ghisellini, G., Ghirlanda, G., Nava, L., & Celotti, A. 2009, arXiv:0910.2459
- Granot & Sari (2002) Granot, J., & Sari, R. 2002, ApJ, 568, 820
- Hoversten et al. (2009) Hoversten, E. A., Krimm, H. A., Grupe, D., Kuin, N. P. M., Barthelmy, S. D., Burrows, D. N., Roming, P., & Gehrels, N. 2009, GCN Report, 218, 1
- Hurley et al. (1994) Hurley, K., et al. 1994, Nature, 372, 652
- Kumar & Barniol Duran (2009a) Kumar, P., & Barniol Duran, R. 2009, MNRAS, L340
- Kumar & Barniol Duran (2009b) Kumar, P., & Barniol Duran, R. 2009, arXiv:0910.5726
- Meegan et al. (2009) Meegan, C., et al. 2009, ApJ, 702, 791
- Mészáros & Rees (1997) Mészáros, P., & Rees, M. J. 1997, ApJ, 476, 232
- Nakar (2007) Nakar, E. 2007, Phys. Rep., 442, 166
- Panaitescu & Kumar (2000) Panaitescu, A. & Kumar, P. 2000, ApJ, 543, 66
- Rau et al. (2009) Rau, A., McBreen, S., & Kruehler, T. 2009, GRB Coordinates Network, 9353, 1
- Razzaque et al. (2004) Razzaque, S., Mészáros, P., & Zhang, B. 2004, ApJ, 613, 1072
- Razzaque & Mészáros (2006) Razzaque, S., & Mészáros, P. 2006, ApJ, 650, 998
- Razzaque et al. (2010) Razzaque, S., Dermer, C. D., & Finke, J. D. 2010, The Open Astronomy Journal (accepted) arXiv:0908.0513
- Razzaque et al. (2009) Razzaque, S., Dermer, C. D., & Finke, J. D. 2009, ApJ, 697, 483
- Sari (1997) Sari, R. 1997, ApJ, 489, L37
- Sari et al. (1998) Sari, R., Piran, T. & Narayan, R. 1998, ApJ, 497, L17
- Sari et al. (1999) Sari, R., Piran, T. & Halpern, J. P. 1999, ApJ, 519, L17
- Sari & Esin (2001) Sari, R., & Esin, A. A. 2001, ApJ, 548, 787
- Toma et al. (2010) Toma, K., Wu, X.-F., & Meszaros, P. 2010, arXiv:1002.2634
- Totani (1998a) Totani, T. 1998a, ApJ, 502, L13
- Wang et al. (2009) Wang, X.-Y., Li, Z., Dai, Z.-G., & Mészáros, P. 2009, ApJ, 698, L98
- Zhang & Mészáros (2001) Zhang, B., & Mészáros, P. 2001, ApJ, 559, 110