Peculiar early-type galaxies in the SDSS Stripe82
Abstract
We explore the properties of ‘peculiar’ early-type galaxies (ETGs) in the local Universe, that show (faint) morphological signatures of recent interactions such as tidal tails, shells and dust lanes. Standard-depth (s exposure) multi-colour galaxy images from the Sloan Digital Sky Survey (SDSS) are combined with the significantly (2 mags) deeper monochromatic images from the public SDSS Stripe82 () to extract, through careful visual inspection, a robust sample of nearby (), luminous () ETGs, including a subset of peculiar systems. % of ETGs exhibit signs of disturbed morphologies (e.g. shells), while % show evidence of dust lanes and patches. An analysis of optical emission-line ratios indicates that the fraction of peculiar ETGs that are Seyferts or LINERs (19.4%) is twice the corresponding values in their relaxed counterparts (10.1%). LINER-like emission is the dominant type of nebular activity in all ETG classes, plausibly driven by stellar photoionisation associated with recent star formation. An analysis of UV-optical colours indicates that, regardless of the luminosity range being considered, the fraction of peculiar ETGs that have experienced star formation in the last Gyr is a factor of higher than that in their relaxed counterparts. The spectro-photometric results strongly suggest that the interactions that produce the morphological peculiarities also induce low-level recent star formation which, based on the recent literature, are likely to contribute a few percent of the stellar mass over the last Gyr. Peculiar ETGs preferentially inhabit low-density environments (outskirts of clusters, groups or the field), either due to high peculiar velocities in clusters making merging unlikely or because shell systems are disrupted through frequent interactions within a cluster crossing time. The catalogue of galaxies that forms the basis of this paper can be obtained at: http://www.mssl.ucl.ac.uk/ska/stripe82/skaviraj_stripe82.dat or on request from the author.
keywords:
galaxies: elliptical and lenticular, cD – galaxies: peculiar – galaxies: interactions – galaxies: evolution – galaxies: formation1 Introduction
Given their dominance of the stellar mass density in the local Universe (Bernardi et al. 2003a), understanding the formation and subsequent evolution of early-type galaxies (ETGs) is a key element of the modern galaxy evolution effort. Their obedience to simple optical scaling relations, such as the Fundamental Plane (e.g. Jorgensen et al. 1996; van Dokkum & Franx 1996; Saglia et al. 1997) and the colour-magnitude relation (e.g. Bower et al. 1992; Ellis et al. 1997; Stanford et al. 1998; Gladders et al. 1998; van Dokkum et al. 2000), indicates that the bulk of the stellar populations in these galaxies has formed at high redshift (), possibly over short timescales of Gyr (Thomas et al. 1999). The mass assembly at late epochs () is better probed using rest-frame UV data (Yi et al. 2005; Kaviraj et al. 2007a, 2007b, 2008; Schawinski et al. 2007a), which is more sensitive to the small fractions of young stars that are expected to form in early-types in the standard model (e.g. Cole et al. 2000; Hatton et al. 2003; Kaviraj et al. 2005; De Lucia et al. 2006; 2007), plausibly through repeated minor merger activity (Kaviraj et al. 2009; Kaviraj et al. 2010).
In the context of the standard model, in which mergers play an important role in the buildup of stellar mass in present-day ETGs (e.g. Cole et al. 2000; Hatton et al. 2003; De Lucia et al. 2006), there is a need to study the role of galaxy interactions and to explore the star formation that accompanies these events. The role of mergers in the nearby Universe has recently been explored through studies of close pairs (e.g. Patton et al. 2000; Le Fèvre et al. 2000; Patton et al. 2002; Lin et al. 2004; Bell et al. 2006; McIntosh et al. 2008; Bundy et al. 2009; Darg et al. 2010a,b) and quantitative estimates of structural morphology (e.g. Conselice et al. 2003). The tell-tale signatures of recent interactions and their impact on the ETG population can be most efficiently studied by exploring ETGs that exhibit morphological peculiarities and many important studies have contributed to a sizeable literature on peculiar ETGs. Early-type galaxies which exhibit systems of shells (see e.g. Malin & Carter 1980; 1983; Malin et al. 1983; Schweizer et al. 1990; Schweizer & Seitzer 1992; Sikkema et al. 2007) have long been recognised as remnants of recent merging, most probably through minor mergers with various orbital confiurations (see e.g. Quinn 1984; Prieur 1988; Hernquist & Spergel 1992). The presence of dust lanes in spheroidal systems - NGC 5128 being the archetype in the local Universe (see e.g. Graham 1979) - is thought to be the result of accretion of cold material from gas-rich companions within the last few Gyrs (see Hawarden et al. 1981; and references therein).
With the advent of the Sloan Digital Sky Survey (SDSS; Abazajian et al. 2009), representative samples of local ETGs have been culled and their star formation histories (SFHs) explored using photometric and spectroscopic diagnostics of star formation activity (e.g. Bernardi et al. 2003a; Kaviraj et al. 2007b, Kaviraj 2008). A key aspect of such work is the identification of galaxy morphologies from survey images. Given the prodigious output of modern observational surveys such as the SDSS, a useful strategy to tackle the large volumes of data is often to use proxies for galaxy morphology, such as colour (since early-types dominate the red sequence) or pipeline parameters such as the concentration index (since early-types have more strongly peaked light profiles than spirals). Significant efforts have been made to exploit the SDSS pipeline to separate the galaxy population into its constituent morphological types and study the properties of early-type systems (see e.g. Eisenstein et al. 2001; Bernardi et al. 2003a,b,c; Park & Choi 2005).
While pipeline classification of morphologies is reasonably efficient, there has been a realisation that the most accurate method of estimating galaxy morphology remains direct visual inspection of galaxy images (e.g. Fukugita et al. 2007; Schawinski et al. 2007; Lintott et al. 2008). While inspection of standard SDSS images does allow us to identify early-type and late-type systems with reasonable accuracy, at least in the redshift range (see e.g. Lintott et al. 2008), a drawback is the relatively low exposure time ( seconds) and the resultant lack of depth. Deep images inevitably show richer morphological detail and, in particular for early-type galaxies, often reveal signatures of recent merging such as fans, shells and tidal debris (van Dokkum 2005).
In this study we aim to combine standard SDSS imaging with that in the SDSS ‘Stripe82’, a stripe along the celestial equator in the Southern Galactic Cap that has been imaged multiple times, both to allow the stacked data to reach fainter magnitudes and as part of the SDSS Supernova Survey (Frieman et al. 2008). The public Stripe82 imaging (released with the SDSS DR7) offers an -band co-addition of 122 runs, with individual areas of the deg2 stripe area having been covered between 20 and 40 times (Abazajian et al. 2009). The Stripe82 imaging reaches 2 mags deeper than single SDSS scans (which have magnitude limits of , and mags in the , and -bands respectively). The -band coadds used in this paper thus have a nominal depth of mags.
The novelties of this paper are two-fold. First, we simultaneously inspect standard multi-colour images from the SDSS DR7 and their deeper Stripe82 counterparts to both identify ETGs and flag members of the ETG population that show morphological signatures of recent interactions (e.g. shells, tidal tails and dust lanes). Second, we explore the spectro-photometric properties of the peculiar ETG population (exploiting optical emission lines and UV-optical colours) and study their local environments.
The catalogue presented here is expected to have higher purity in the morphological classifications than its predecessors, with the added advantage of identifying ETGs that exhibit morphological signatures of recent interactions. It provides a useful reference sample of peculiar ETGs from the SDSS, with a homogeneous set of spectro-photometric products available from the SDSS pipeline, which is suitable for follow up using current and future instruments. Forthcoming companion papers will explore the structural peculiarities such as shell systems and dust lanes in more detail and correlate them with the star formation and chemical enrichment histories of the individual galaxies.
2 Galaxy sample and visual inspection
We begin by describing the process of visual inspection carried out on the sample of galaxies explored in this study. To maximise the accuracy of the morphological classifications, we restrict ourselves to bright galaxies () in the nearby Universe ().The total number of galaxies in the parent sample is 902.
Each galaxy is morphologically classified by simultaneous
inspection of its multi-colour standard-depth image and its deeper
monochromatic Stripe82 counterpart. Note that the images used in
this study are those provided by the public SDSS DR7 release. The
objects are carefully assigned to three main morphological
classes: early-type galaxies (ETGs), late-type galaxies (LTGs) and
‘Sa-like’ systems which are bulge-dominated galaxies with faint
spiral features that are visible in the Stripe82 imaging but
invisible in the standard-depth images. The ETG population is
further sub-divided into the following categories:
(1) Relaxed ETGs
Early-type galaxies that do not exhibit any signs of morphological
disturbances at the depth of the Stripe82 images.
(2) ETGs with tidal features
Early-type galaxies that exhibit shells, fans and tidal tails
(typically in the Stripe82 images). Note that this
category includes a small number of systems that are in the early
stages of relaxation after a merger and could be early-type
progenitors.
(3) ETGs with dust features
Galaxies that show the presence of dust patches and dust lanes
(typically in the multi-colour standard-depth imaging).
Note that, in what follows, we refer to categories (2) and (3) collectively as ‘peculiar ETGs’. The classification process is repeated until the numbers in the ETG, LTG and Sa categories begin to converge and the numbers in these categories between classification runs are within 1% of each other. In our case, such convergence was achieved after four such runs. Note also that between runs 3 and 4 the sample of peculiar ETGs and Sa-like systems did not change.
We find that % of the Stripe82 galaxy population are classified as ETGs. At the depth of the Stripe82 and DR7 images, % of ETGs show tidal features, while 7% show evidence for dust lanes and patches.
In Figure 1 we present examples of galaxies classified as relaxed ETGs (top three rows). For comparison we also show objects classified as LTGs (bottom three rows). The standard-depth multi-colour image is shown in the left-hand column and its deeper Stripe82 counterpart is shown on the right. Figures 2 and 3 present typical examples of peculiar ETGs that exhibit tidal features such as shells. Notice that the features are invisible in the standard DR7 images. Figure 4 presents examples of galaxies which exhibit dust lanes. The presence of dust features is often accompanied by morphological disturbances, indicating that the dust may have been deposited by a recent interaction event.
In Figure 5 we present a subset of the ETGs with tidal features that appear to be in the early stages of relaxation into an early-type remnant. Note that, while galaxies in this morphological subclass have clear bulges, the ‘early-stage’ nature of the merger remnant can often make it difficult to pin down the morphology of the final remnant robustly. For example, the galaxy in the bottom row of Figure 5, in addition to a strong bulge component, may also be in the process of building a disk. Note that the bulge-dominated nature of this object is strongly supported by pipeline measures of morphology such as the SDSS fracdev parameter, which measures the contribution of a bulge profile to the overall light profile of the galaxy; in principle fracdev=0 indicates a pure disk, while fracdev=1 indicates a pure bulge, although prior experience indicates that high fracdev values do not exclude the possibility of a (visually detected) disk-like component. The galaxy in question has fracdev=1 in all SDSS filters.
Recent work (e.g. Springel & Hernquist 2005; Robertson et al. 2006; Hopkins et al. 2009) has shown that disks can be rebuilt in (major) mergers where the initial gas fractions are high (). Feedback from star formation and supernovae act to pressurise the interstellar medium, redistributing gas spatially and to larger radii where it does not feel the internal torques induced by the merger. As a result this gas does not lose angular momentum and contribute to fuelling the starburst, allowing it to then reform a disk. It is possible that the galaxy in the bottom row of Figure 5 is an example of such a system that is the product of a gas-rich major merger.
2.1 Comparison to previous studies of morphologically disturbed early-types
It is useful to compare our results to previous surveys of morphologically disturbed ETGs in the local Universe. The detection of tidal features is clearly dependent on the depth of the imaging in question or, more specifically, on the surface brightness (SB) limits reached by the survey. In the 1980s and 1990s two deep studies of early-type galaxies were performed by Malin & Carter (1983) and Schweizer & Seitzer (1992). Both studies reached surface brightness (SB) limits of mag arcsec-2, which translates to mag arcsec-2 for a purely old stellar population. The Malin & Carter study detected tidal features, shells and ripples in roughly 17% of their elliptical galaxy sample (which was comprised of 137 objects). The SB limit of the standard exposure SDSS -band images is mag arcsec-2 (see the SDSS project book111http://www.astro.princeton.edu/PBOOK/strategy/strategy.htm) which yields an estimate of mag arcsec-2 for the deeper SDSS Stripe82 images used in this study. Given the similar SB limits, it is not surprising that the fraction of ETGs labelled as morphological disturbed in this paper are similar to the fractions reported by Malin & Carter (1983).
The deepest survey of ETGs in the local Universe has been performed by van Dokkum (2005), who studied the red sequence population observed by the MUSYC (Gawiser et al. 2006) and NOAO Deep Wide-Field (Jannuzi et al. 2004) surveys down to SB limits of mag arcsec-2 (the point source limits were 27 mags). The striking result from this study was that % of the ETGs on the optical red sequence showed signs of disturbed morphologies. In other words, it seems likely that morphological disturbances may be ubiquitous in the ETG population and their successful detection is driven simply by the depth of the imaging available. The peculiar ETG population catalogued here is therefore biased towards disturbed ETGs with more prominent morphological disturbances.
3 Emission line diagnostics: star formation and AGN activity
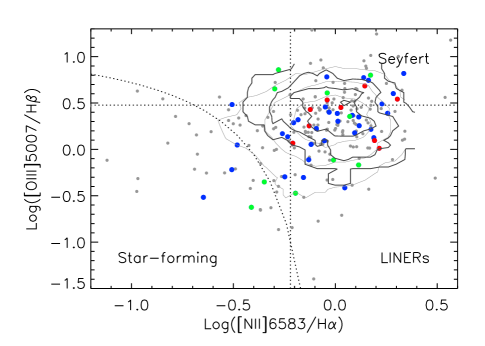
We begin our spectro-photometric analysis by exploring the emission line diagnostics of our galaxy sample. Optical emission line ratios are commonly used to determine the presence of (Type II) AGN and separate the AGN population into its various types using a ‘BPT’ diagram (e.g. Baldwin et al. 1981; Kauffmann et al. 2003a). Figure 6 shows the BPT diagram for the Stripe82 galaxies. Note that galaxies only appear in this plot if the S/N in all emission lines is . Grey points indicate ETGs that are relaxed. ETGs with tidal distortions are shown using blue points, ETGs with dust features are shown using red points and ETGs which show both dust features and tidal distortions are indicated using green points. The dark contours indicate the distribution of peculiar ETGs while the grey contours indicate the distribution of relaxed ETGs. Objects that lie below the curved line are classified as ‘Star-forming’. Seyferts and LINERs occupy separate sections on the right-hand side of the plot while ‘Composites’ (which host both star formation and AGN activity) occupy the intermediate regions of the diagram222Note that Composites are also sometimes called ‘Transition Region’ objects.. Table 1 summaries the AGN properties of the Stripe82 sample.
It is worth noting that the fraction of ETGs that are actively star-forming is typically very small. Only 1.3% of relaxed ETGs fall on the star-forming locus, while the equivalent value for the peculiar ETG population is 4.5%. Our results are consistent with Schawinski et al. (2007), who find a similar value for the fraction of star-forming ETGs (4.3%). Table 1 indicates that, not unexpectedly, the star-forming fraction in the peculiar ETG population is a few factors higher than that in their relaxed counterparts, presumably due to star formation associated with the interaction events that produce the observed morphological disturbances. The small fraction of actively star-forming ETGs suggests that the peak star formation rates in these events is low, consistent with what might be expected from gas-poor major mergers or, more plausibly, minor mergers, that are predicted to be the principal driver of star formation in ETGs at late epochs (Kaviraj et al. 2009; Kaviraj et al. 2010). We revisit this issue in Section 4, where the UV colour is used as a more detailed probe of the recent star formation (RSF) in the ETG sample.
We find that the fraction of objects classified as ‘AGN’ (i.e. Seyferts + LINERs) doubles in the peculiar ETGs compared to that in their relaxed counterparts. However, it is worth noting that the overwhelming bulk of the emission in both relaxed and peculiar ETGs is LINER-like. This type of activity can be driven by low-intensity emission from AGN, stellar photoionisation or shocks propagating through the gas. Recent work by Stasińska et al. (2008) has shown that the presence of diffuse LINER-like emission from stellar photoionisation can be indistinguishable from AGN activity. The source of the emission is better probed using integral-field-spectroscopy (IFS) data which can be used to explore the spatial extent of the emission and discriminate between central emission (indicative of an AGN) or spatially extended (diffuse) emission from the stellar population in the galaxy. Using IFS data Sarzi et al. (2010) have explored the nature of the ionised gas emission in the SAURON sample of galaxies, originally studied by Sarzi et al. (2006). Their results indicate that only in a small fraction of objects that have radio and X-ray cores is the nebular emission consistent with a central AGN. In particular, the source of the emission-line activity in galaxies that carry signatures of RSF is likely to be OB stars or a PAGB phase associated with the young stellar component. In light of these results, it seems plausible that the increased LINER activity observed in peculiar ETGs is primarily driven by stellar photoionisation associated with the RSF that is induced by recent interactions that give rise to these objects. The enhanced star formation in peculiar ETGs is indicated both by the higher fraction of peculiar ETGs that are classified as ‘Star-forming’ in the BPT diagnostics above and by an excess of UV-blue colours in the population, as discussed in Section 4 below.
| Relaxed ETGs | Peculiar ETGs | f(pec)/f(rel) | |
|---|---|---|---|
| Star-forming | 1.3% | 4.5% | 3.5 |
| Composites | 1.3% | 1.5% | 1.1 |
| Seyferts | 1.6% | 3.0% | 1.9 |
| LINERs | 9.2% | 16.4% | 1.8 |
4 Colours and recent star formation
We now turn to the photometric properties of the Stripe82 galaxy population. We explore both the optical colours of our sample (using photometry from the SDSS) and their UV colours (using photometry from the recent GALEX space telescope, see Martin et al. 2005). Recent work has shown that the UV spectrum is very sensitive to small amounts of RSF. This makes the UV especially useful in identifying ETGs that may have had small amounts of RSF contributing a few percent of their stellar mass over the last Gyr (Kaviraj et al. 2007b; Kaviraj et al. 2008) and makes it particularly pertinent to the study of the peculiar ETG population in our sample.
In Figure 7 we present the optical colour-magnitude relation (CMR; top) of the Stripe82 galaxy sample and the colour histograms (bottom) for the relaxed and peculiar ETG populations. The relaxed ETGs are shown using small black circles while the various classes of peculiar ETGs are indicated using colours. Galaxies with Seyfert or LINER-like emission are indicated using boxes. Late-type galaxies are indicated in grey. Median values of the histograms are indicated using the red lines. We find that the relaxed and peculiar ETG populations have very similar optical colour distributions with the peculiar ETGs bluer, on average, by less than 0.05 mags. We use a Mann-Whitney (MW; Walpole & Myers 1985) U-test to quantitatively compare the colour distributions of the relaxed and peculiar ETGs and test the hypothesis that they have the same median. For the colour, the MW test yields a nearly-normal test statistic Z -0.5 and a probability of achieving a value greater than Z. Thus, at the 5% significance level we cannot reject the hypothesis that the two distributions have the same median.
Figure 8 shows the UV CMR for the Stripe82 galaxy population (top) and colour histograms for the ETG population, split into its relaxed and peculiar subsets (bottom). Note that the GALEX filter is centred around 2300Å. In contrast to the optical analysis above, several differences become visible between the UV colours of the two ETG sub-populations. The top panel of this figure indicates that, in the magnitude range , the colour distribution of the relaxed ETGs is virtually indistinguishable from that of their peculiar counterparts. However, in the range the peculiar ETGs become distinctly bluer in the colour, which drives the overall offset in the two histograms in the bottom panel of this figure. This difference in behaviour can be quantified by noting that the slope of the CMR for the relaxed ETGs is -0.27 while that for the peculiar ETGs is -0.61 i.e. twice the value for their relaxed counterparts. The difference in the median of the two ETG subclasses, driven by the blueward trend of the less luminous galaxies, is mags.
An MW test in the colour distributions of the relaxed and peculiar ETG populations yields a p-value of 0.02, indicating that, unlike in the case for , the medians of these two distributions are different at the 5% significance level. To further confirm this result we estimate the standard deviation in the medians using bootstrapping and compare these to the difference in the medians themselves. The standard deviation of the () median for relaxed ETGs is 0.05 mags, while the corresponding value for their peculiar counterparts is 0.09 mags. The sum of these standard deviations (0.14 mags) is a few factors smaller than the difference in the medians themselves (0.6 mags), which supports the results of the MW test and indicates that the colour distributions of the relaxed and peculiar ETGs are indeed different.
4.1 Tracing recent star formation using the UV colour
The UV offers an alternative route to exploring the RSF in early-type galaxies. While emission lines such as H trace ‘instantaneous’ star formation activity, the UV spectrum is an integral of flux from the hot, massive, main sequence stellar population in galaxies which survive for 1 Gyr. Furthermore, the photometric nature of the indicator means that a robust detection of UV flux can be made in all ETGs within (including those on the red sequence), while emission lines are typically useful only if the S/N is satisfactorily large (), which makes it difficult to study weakly star forming ETGs using SDSS emission lines such as H.
At low redshift care needs to be taken in interpreting the UV flux from early-type galaxies because there is a potential contribution from old, horizontal branch stars that leads to the ‘UV upturn’ phenomenon around 1500Åin some nearby giant ellipticals (see e.g. Yi et al. 1997; Yi et al. 1999). However, using the colour of one of the strongest UV upturn galaxies as a guide, Kaviraj et al. (2007b) have argued that objects bluer than are highly likely to harbour some RSF i.e. their UV colours cannot be satisfied simply by invoking UV upturn flux.
In Table 2 we use this threshold to estimate the fraction of relaxed and peculiar ETGs that have experienced some RSF over the last Gyr. We find that, not unexpectedly, in all magnitude ranges, the fraction of peculiar ETGs that have experienced RSF is a factor of 1.5 higher than that in their relaxed counterparts. The RSF fraction declines (in all categories) as we restrict ourselves to more luminous galaxies as a result of the downsizing phenomenon (e.g. Cowie et al. 1996).
| Relaxed ETGs | Peculiar ETGs | All ETGs | |
|---|---|---|---|
| 34% | 54% | 38% | |
| 29% | 46% | 34% | |
| 26% | 41% | 31% |
The bluer colours of the peculiar ETGs in the UV and higher fraction of objects with RSF in these galaxies is consistent with the higher fraction of ‘Star-forming’ and LINER-like objects in the emission-line BPT diagnostics. If the source of the LINER emission is stellar photoionisation then, taken together, these results strongly suggest that the interaction events that produce the morphological peculiarities are also responsible for the higher levels of star formation and nebular activity that is found in the peculiar ETG population. It is worth noting that these results are consistent with those of Schweizer et al. (1990) and Schweizer & Seitzer (1992), who detected enhanced H absorption and slightly bluer colours in ETGs with more pronounced fine structure, and interpreted this as evidence for lower mean ages. While the robustness of the analysis in this paper clearly benefits from the added sensitivity of the UV to RSF, it is reassuring that our results are qualitatively consistent with those in the literature.
In light of the emission-line analysis and the UV/optical colours, the properties of the peculiar ETGs offer useful insights into the ‘dryness’ of typical mergers that take place in the ETG population at low redshift. The lack of impact of the RSF on the optical colours and the virtually negligible fraction of ‘star-forming’ ETGs in the BPT diagnostics indicates that the intensity of star formation in these events is low and that the encounters are not particularly gas-rich in comparison to the stellar mass of the remnant. This is supported by the UV colours of the peculiar ETGs which, although offset from those of the relaxed ETGs, are largely contained in the green valley and not the UV blue cloud. It is likely, therefore, that the mergers that drive the star formation (and evolution) of the ETG population at low redshift produce low-level star formation events, consistent with the small mass fractions of young stars (a few percent) that have been measured in previous work (e.g. Kaviraj et al. 2008). The processes at work are likely to involve either dry major mergers or minor mergers where a large spheroid accretes a small gas-rich satellite which then fuels a small burst of star formation (Kaviraj et al. 2009, 2010).
5 Local environment
Previous work has strongly suggested that peculiar ETGs preferentially inhabit regions of lower density (see e.g. Malin & Carter 1983). To explore the environments of our ETGs we cross-match our Stripe82 galaxy sample with the SDSS group catalogue constructed by Yang et al. (2007), who use a halo-based group finder to separate the SDSS into over 300,000 groups in a broad dynamical range, spanning rich clusters to isolated galaxies. We use this catalogue to identify both the masses of the parent, dark-matter (DM) haloes that host the galaxies in our sample and the halo-centric radii of these galaxies within their respective haloes.
Note that the traditional definitions of environment (‘Field’, ‘Groups’ and ‘Clusters’) are related to the underlying dark matter haloes that host the structures that these definitions refer to. ‘Cluster-sized’ haloes typically have masses greater than M⊙. ‘Group-sized’ haloes have masses between M⊙ and M⊙, while smaller haloes constitute what is commonly termed the ‘field’. Figure 9 summarises the local environment of the Stripe82 early-type galaxies in our sample. In the top panel we plot a cumulative histogram of the halo masses and in the bottom panel we plot the fractional halo-centric radii against the host halo mass. The traditional definitions of local environment are also indicated in the plot.
We find that peculiar ETGs (shown dotted) indeed have a tendency to inhabit lower density regions. Only 5% of the peculiar ETGs inhabit cluster-sized haloes, typically avoiding the core (inner 15%) of the cluster. Almost 75% of peculiar ETGs inhabit the field, while the remaining 20% inhabit the intermediate-density environment of group-sized haloes. In contrast, more than 20% of relaxed ETGs reside in cluster-sized haloes, consistent with the established result that early-types typically dominate the galaxy census in nearby clusters (see e.g. Dressler 1980).
The absence of peculiar ETGs in the densest regions of the Universe is plausibly driven by several factors. Peculiar velocities in clusters are typically high ( kms-1), making mergers less likely since interacting systems do not bind gravitationally. While fly-bys, which are presumably more common in cluster cores, may also give rise to shell structures (Thomson & Wright 1990), this requires a (hypothetical) cold thick disk i.e. a dynamically cold population of stars in nearly circular orbits to be present in the parent spheroid. The lack of shell early-types in cluster cores might indicate that most ETGs do not possess a cold, thick disk population, although the size of our sample is too small to draw a robust conclusion. A final possibility is that shell structures do form but, given frequent interactions with other galaxies in the dense cluster cores, they are disrupted within a cluster crossing time, which is around a Gyr for a typical core extent of 1 Mpc and a peculiar velocity of kms-1.
6 Summary and conclusions
We have explored the spectro-photometric properties of the early-type galaxy (ETG) population, drawn from the SDSS Stripe82 (). Standard-depth (s exposure) multi-colour () galaxy images from the SDSS DR7 have been combined with the significantly (2 mags) deeper monochromatic images from the public SDSS Stripe82 to extract, through careful visual inspection, a robust sample of nearby (), luminous () ETGs. We have identified, for the first time, a sample of peculiar ETGs from the SDSS which carry faint morphological signatures of recent interactions, such as tidal tails and dust lanes. % of the Stripe82 galaxy sample are classified as ETGs, and at the depth of the DR7 and Stripe82 images, % of the ETG population show tidal features, while 7% show evidence for extended dust features. Given the depth of the Stripe82 images used in this paper, the fraction of ETGs that exhibit tidal features compares well with what might be expected from previous work in the literature that has employed images of a similar surface brightness.
A ‘BPT’ analysis of optical emission line ratios indicates that the fraction of ETGs that are classified as ‘star-forming’ is very small - only 1.3% of relaxed ETGs fall on the star-forming locus, while the equivalent value for the peculiar ETG population is 4.5%. It is worth noting that the number of peculiar ETGs in this category is three times the corresponding value in their relaxed counterparts. In a similar vein, the fraction of peculiar ETGs that are classified as either Seyferts or LINERs (19.4%) is twice the equivalent value in their relaxed counterparts (10.1%). The dominant type of emission-line activity in all types of ETGs (relaxed or peculiar) is found to be LINER-like.
A photometric analysis indicates that the distributions of optical () colours of the relaxed and peculiar ETG populations are very similar, with a Mann-Whitney test indicating that the median () values of these two ETG subclasses are statistically indistinguishable. However, significant differences are found in their UV colours, which are considerably more sensitive to low-level recent star formation (RSF). The nominal difference in the median () of the two ETG subclasses is mags. A Mann-Whitney test indicates, that unlike the () colours, the distributions of the relaxed and peculiar ETG populations do indeed have different medians at the 5% significance level.
The bluer colours of the peculiar ETGs in the UV and higher fraction of objects with RSF in these galaxies is consistent with the higher fraction of ‘star-forming’ and LINER-like objects in the emission-line BPT diagnostics, if the source of the LINER emission is, as recent work suggests, driven by stellar photoionisation associated with the RSF. Taken together, these results indicate that the merger events that produce the morphological peculiarities also enhance the star formation and nebular activity in the peculiar ETG population. However, the negligible impact of this star formation on the optical colours suggests that the intensity of star formation in these events is low and that the encounters are not particularly gas-rich. This is supported by the UV colours of the peculiar ETGs which, although offset from those of the relaxed ETGs, are largely contained in the green valley and not the UV blue cloud. Our results point to a scenario in which the interaction events and their associated low-level star formation are driven by either (largely) dry major mergers or minor mergers where a gas-rich satellite is accreted by a massive spheroid, in agreement with the recent literature on ETGs.
A study of the local environments of the relaxed and peculiar ETG populations indicates that, in agreement with previous studies, the peculiar ETG population preferentially inhabits regions of low density (outskirts of clusters, groups and the field). In particular, peculiar ETGs are not found in the cores (the inner %) of rich clusters. This implies either that the peculiar velocities in cluster centres are too high for mergers (that produce the shells) to take place or that shell structures do form in these regions but are rapidly disrupted through frequent interactions within a cluster crossing time.
While visual inspection of survey images has become increasingly common in modern galaxy evolution studies, the work presented in this paper suggests that the depth of wide-area surveys (which are necessarily optimised for areal coverage) is often insufficient to reveal the signatures of a galaxy’s morphological history. Interactions are a key driver of galaxy evolution at all epochs. While the spectro-photometric evolution of galaxies can be efficiently mapped using contemporary data, the underlying morphological transformations that may drive that evolution could remain hidden due to insufficient exposure times. Since a complete picture of galaxy evolution ideally requires information on both aspects, deeper imaging than what is available currently is required in future surveys to enable us to construct an accurate picture of the evolution of the galaxy population over the lifetime of the Universe.
Acknowledgements
I am grateful to the referee for a number of important suggestions that added depth to the original manuscript. I acknowledge a Research Fellowship from the Royal Commission for the Exhibition of 1851, an Imperial College Junior Research Fellowship from Imperial College London, a Senior Research Fellowship from Worcester College, Oxford and support from the BIPAC institute at Oxford. Marc Sarzi, Chris Lintott, Kevin Schawinski, Scott Trager and Sukyoung Yi are thanked for useful discussions.
GALEX (Galaxy Evolution Explorer) is a NASA Small Explorer, launched in April 2003, developed in cooperation with the Centre National d Etudes Spatiales of France and the Korean Ministry of Science and Technology.
Funding for the SDSS and SDSS-II has been provided by the Alfred P. Sloan Foundation, the Participating Institutions, the National Science Foundation, the U.S. Department of Energy, the National Aeronautics and Space Administration, the Japanese Monbukagakusho, the Max Planck Society, and the Higher Education Funding Council for England. The SDSS Web Site is http://www.sdss.org/.
The SDSS is managed by the Astrophysical Research Consortium for the Participating Institutions. The Participating Institutions are the American Museum of Natural History, Astrophysical Institute Potsdam, University of Basel, University of Cambridge, Case Western Reserve University, University of Chicago, Drexel University, Fermilab, the Institute for Advanced Study, the Japan Participation Group, Johns Hopkins University, the Joint Institute for Nuclear Astrophysics, the Kavli Institute for Particle Astrophysics and Cosmology, the Korean Scientist Group, the Chinese Academy of Sciences (LAMOST), Los Alamos National Laboratory, the Max-Planck-Institute for Astronomy (MPIA), the Max-Planck-Institute for Astrophysics (MPA), New Mexico State University, Ohio State University, University of Pittsburgh, University of Portsmouth, Princeton University, the United States Naval Observatory, and the University of Washington.
References
- Abazajian & et al. (2009) Abazajian K. N., et al. 2009, ApJS, 182, 543
- Adelman-McCarthy & et al. (2008) Adelman-McCarthy J. K., et al. 2008, ApJS, 175, 297
- Baldwin et al. (1981) Baldwin J. A., Phillips M. M., Terlevich R., 1981, PASP, 93, 5
- Bell et al. (2006) Bell E. F., Naab T., McIntosh D. H., Somerville R. S., Caldwell J. A. R., Barden M., Wolf C., Rix H.-W., Beckwith S. V., Borch A., Häussler B., Heymans C., Jahnke K., Jogee S., Koposov S., Meisenheimer K., Peng C. Y., Sanchez S. F., Wisotzki L., 2006, ApJ, 640, 241
- Bernardi & et al. (2003a) Bernardi M., et al. 2003a, AJ, 125, 1817
- Bernardi & et al. (2003b) Bernardi M., et al. 2003b, AJ, 125, 1882
- Bernardi & et al. (2003c) Bernardi M., et al. 2003c, AJ, 125, 1849
- Bower et al. (1992) Bower R. G., Lucey J. R., Ellis R., 1992, MNRAS, 254, 589
- Bundy et al. (2009) Bundy K., Fukugita M., Ellis R. S., Targett T. A., Belli S., Kodama T., 2009, ApJ, 697, 1369
- Cole et al. (2000) Cole S., Lacey C. G., Baugh C. M., Frenk C. S., 2000, MNRAS, 319, 168
- Conselice et al. (2003) Conselice C. J., Bershady M. A., Dickinson M., Papovich C., 2003, AJ, 126, 1183
- Cowie et al. (1996) Cowie L. L., Songaila A., Hu E. M., Cohen J. G., 1996, AJ, 112, 839
- Darg et al. (010b) Darg D. W., Kaviraj S., Lintott C. J., Schawinski K., Sarzi M., Bamford S., Silk J., Andreescu D., Murray P., Nichol R. C., Raddick M. J., Slosar A., Szalay A. S., Thomas D., Vandenberg J., 2010b, MNRAS, 401, 1552
- Darg et al. (010a) Darg D. W., Kaviraj S., Lintott C. J., Schawinski K., Sarzi M., Bamford S., Silk J., Proctor R., Andreescu D., Murray P., Nichol R. C., Raddick M. J., Slosar A., Szalay A. S., Thomas D., Vandenberg J., 2010a, MNRAS, 401, 1043
- De Lucia et al. (2007) De Lucia G., Poggianti B. M., Aragón-Salamanca A., White S. D. M., Zaritsky D., Clowe D., Halliday C., Jablonka P., von der Linden A., Milvang-Jensen B., Pelló R., Rudnick G., Saglia R. P., Simard L., 2007, MNRAS, 374, 809
- De Lucia et al. (2006) De Lucia G., Springel V., White S. D. M., Croton D., Kauffmann G., 2006, MNRAS, 366, 499
- Dressler (1980) Dressler A., 1980, ApJ, 236, 351
- Eisenstein & et al. (2001) Eisenstein D. J., et al. 2001, AJ, 122, 2267
- Ellis et al. (1997) Ellis R. S., Smail I., Dressler A., Couche W. J., Oemler A. J., Butcher H., Sharples R. M., 1997, ApJ, 483, 582
- Frieman & et al. (2008) Frieman J. A., et al. 2008, AJ, 135, 338
- Fukugita et al. (2007) Fukugita M., Nakamura O., Okamura S., Yasuda N., Barentine J. C., Brinkmann J., Gunn J. E., Harvanek M., Ichikawa T., Lupton R. H., Schneider D. P., Strauss M. A., York D. G., 2007, AJ, 134, 579
- Gawiser & MUSYC collaboration (2006) Gawiser E., MUSYC collaboration 2006, ApJS, 162, 1
- Gladders et al. (1998) Gladders M. D., Lopez-Cruz O., Yee H. K. C., Kodama T., 1998, ApJ, 501, 571
- Graham (1979) Graham J. A., 1979, ApJ, 232, 60
- Hatton et al. (2003) Hatton S., Devriendt J. E. G., Ninin S., Bouchet F. R., Guiderdoni B., Vibert D., 2003, MNRAS, 343, 75
- Hawarden et al. (1981) Hawarden T. G., Longmore A. J., Tritton S. B., Elson R. A. W., Corwin Jr. H. G., 1981, MNRAS, 196, 747
- Hernquist & Spergel (1992) Hernquist L., Spergel D. N., 1992, ApJ, 399, L117
- Hopkins et al. (2009) Hopkins P. F., Cox T. J., Younger J. D., Hernquist L., 2009, ApJ, 691, 1168
- Jannuzi et al. (2004) Jannuzi B. T., Dey A., Brown M. J. I., Ford A., Hogan E., Miller M., Ryan E., Tiede G. P., Valdes F., NDWFS 2004 Vol. 36 of Bulletin of the American Astronomical Society. pp 1478–+
- Jorgensen et al. (1996) Jorgensen I., Franx M., Kjaergaard P., 1996, MNRAS, 280, 167
- Kauffmann & et al. (2003a) Kauffmann G., et al. 2003a, MNRAS, 346, 1055
- Kauffmann & et al. (2003b) Kauffmann G., et al. 2003b, MNRAS, 341, 33
- Kaviraj (2008) Kaviraj S., 2008, Modern Physics Letters A, 23, 153
- Kaviraj et al. (2005) Kaviraj S., Devriendt J. E. G., Ferreras I., Yi S. K., 2005, MNRAS, 360, 60
- Kaviraj & GALEX collaboration (007b) Kaviraj S., GALEX collaboration 2007b, ApJS, 173, 619
- Kaviraj et al. (2008) Kaviraj S., Khochfar S., Schawinski K., Yi S. K., Gawiser E., Silk J., Virani S. N., Cardamone C. N., van Dokkum P. G., Urry C. M., 2008, MNRAS, 388, 67
- Kaviraj et al. (2009) Kaviraj S., Peirani S., Khochfar S., Silk J., Kay S., 2009, MNRAS, 394, 1713
- Kaviraj et al. (007a) Kaviraj S., Rey S.-C., Rich R. M., Yoon S.-J., Yi S. K., 2007a, MNRAS, 381, L74
- Kaviraj et al. (2010) Kaviraj S., Tan K., Ellis R. S., Silk J., 2010, ArXiv:1001.2141
- Le Fèvre et al. (2000) Le Fèvre O., Abraham R., Lilly S. J., Ellis R. S., Brinchmann J., Schade D., Tresse L., Colless M., Crampton D., Glazebrook K., Hammer F., Broadhurst T., 2000, MNRAS, 311, 565
- Lin et al. (2004) Lin L., Koo D. C., Willmer C. N. A., Patton D. R., Conselice C. J., Yan R., Coil A. L., Cooper M. C., Davis M., Faber S. M., Gerke B. F., Guhathakurta P., Newman J. A., 2004, ApJ, 617, L9
- Lintott et al. (2008) Lintott C. J., Schawinski K., Slosar A., Land K., Bamford S., Thomas D., Raddick M. J., Nichol R. C., Szalay A., Andreescu D., Murray P., Vandenberg J., 2008, MNRAS, 389, 1179
- Malin & Carter (1980) Malin D. F., Carter D., 1980, Nature, 285, 643
- Malin & Carter (1983) Malin D. F., Carter D., 1983, ApJ, 274, 534
- Malin et al. (1983) Malin D. F., Quinn P. J., Graham J. A., 1983, ApJ, 272, L5
- Martin & GALEX collaboration (2005) Martin D. C., GALEX collaboration 2005, ApJ, 619, L1
- McIntosh et al. (2008) McIntosh D. H., Guo Y., Hertzberg J., Katz N., Mo H. J., van den Bosch F. C., Yang X., 2008, MNRAS, 388, 1537
- Park & Choi (2005) Park C., Choi Y.-Y., 2005, ApJ, 635, L29
- Patton et al. (2000) Patton D. R., Carlberg R. G., Marzke R. O., Pritchet C. J., da Costa L. N., Pellegrini P. S., 2000, ApJ, 536, 153
- Patton et al. (2002) Patton D. R., Pritchet C. J., Carlberg R. G., Marzke R. O., Yee H. K. C., Hall P. B., Lin H., Morris S. L., Sawicki M., Shepherd C. W., Wirth G. D., 2002, ApJ, 565, 208
- Prieur (1988) Prieur J.-L., 1988, ApJ, 326, 596
- Quinn (1984) Quinn P. J., 1984, ApJ, 279, 596
- Robertson et al. (2006) Robertson B., Bullock J. S., Cox T. J., Di Matteo T., Hernquist L., Springel V., Yoshida N., 2006, ApJ, 645, 986
- Saglia et al. (1997) Saglia R. P., Colless M., Baggley G., Bertschinger E., Burstein D., Davies R. L., McMahan R. K., Wegner G., 1997, in Arnaboldi M., Da Costa G. S., Saha P., eds, ASP Conf. Ser. 116: The Nature of Elliptical Galaxies; 2nd Stromlo Symposium The EFAR Fundamental Plane. pp 180–+
- Sarzi & et al. (2006) Sarzi M., et al. 2006, MNRAS, 366, 1151
- Sarzi & et al. (2010) Sarzi M., et al. 2010, MNRAS, 402, 2187
- Schawinski et al. (007b) Schawinski K., Thomas D., Sarzi M., Maraston C., Kaviraj S., Joo S.-J., Yi S. K., Silk J., 2007b, MNRAS, 382, 1415
- Schweizer & Seitzer (1992) Schweizer F., Seitzer P., 1992, AJ, 104, 1039
- Schweizer et al. (1990) Schweizer F., Seitzer P., Faber S. M., Burstein D., Dalle Ore C. M., Gonzalez J. J., 1990, ApJ, 364, L33
- Sikkema et al. (2007) Sikkema G., Carter D., Peletier R. F., Balcells M., Del Burgo C., Valentijn E. A., 2007, A&A, 467, 1011
- Springel & Hernquist (2005) Springel V., Hernquist L., 2005, ApJ, 622, L9
- Stanford et al. (1998) Stanford S. A., Eisenhardt P. R. M., Dickinson M., 1998, ApJ, 492, 461
- Stasińska et al. (2008) Stasińska G., Vale Asari N., Cid Fernandes R., Gomes J. M., Schlickmann M., Mateus A., Schoenell W., Sodré Jr. L., 2008, MNRAS, 391, L29
- Thomas et al. (1999) Thomas D., Greggio L., Bender R., 1999, MNRAS, 302, 537
- Thomson & Wright (1990) Thomson R. C., Wright A. E., 1990, MNRAS, 247, 122
- van Dokkum (2005) van Dokkum P. G., 2005, AJ, 130, 2647
- van Dokkum & Franx (1996) van Dokkum P. G., Franx M., 1996, MNRAS, 281, 985
- van Dokkum et al. (2000) van Dokkum P. G., Franx M., Fabricant D., Illingworth G. D., Kelson D. D., 2000, ApJ, 541, 95
- Walpole & Myers (1985) Walpole R. E., Myers R. H., 1985, Probability and statistics for engineers and scientists, 3rd, edn. Macmillan
- Yang et al. (2007) Yang X., Mo H. J., van den Bosch F. C., Pasquali A., Li C., Barden M., 2007, ApJ, 671, 153
- Yi et al. (1997) Yi S., Demarque P., Oemler A. J., 1997, ApJ, 486, 201
- Yi et al. (1999) Yi S., Lee Y.-W., Woo J.-H., Park J.-H., Demarque P., Oemler A. J., 1999, ApJ, 513, 128
- Yi et al. (2005) Yi S. K., Yoon S.-J., Kaviraj S., Deharveng J.-M., the GALEX Science Team 2005, ApJ, 619, L111