Hydrodynamical Simulations of Clusters with Galcons
Hydrodynamical Simulations of Galaxy Clusters with Galcons
Abstract
We present our recently developed galcon approach to hydrodynamical cosmological simulations of galaxy clusters - a subgrid model added to the Enzo adaptive mesh refinement code - which is capable of tracking galaxies within the cluster potential and following the feedback of their main baryonic processes. Galcons are physically extended galactic constructs within which baryonic processes are modeled analytically. By identifying galaxy halos and initializing galcons at high redshift (, well before most clusters virialize), we are able to follow the evolution of star formation, galactic winds, and ram-pressure stripping of interstellar media, along with their associated mass, metals and energy feedback into intracluster (IC) gas, which are deposited through a well-resolved spherical interface layer. Our approach is fully described and all results from initial simulations with the enhanced Enzo-Galcon code are presented. With a galactic star formation rate derived from the observed cosmic star formation density, our galcon simulation better reproduces the observed properties of IC gas, including the density, temperature, metallicity, and entropy profiles. By following the impact of a large number of galaxies on IC gas we explicitly demonstrate the advantages of this approach in producing a lower stellar fraction, a larger gas core radius, an isothermal temperature profile in the central cluster region, and a flatter metallicity gradient than in a standard simulation.
* accepted for publication in The Astrophysical Journal
1 Introduction
Hydrodynamical simulations of galaxy clusters, incorporating semi-analytic models for star formation and galactic feedback processes, show an appreciable level of inconsistency with observational results. This is particularly apparent in the simulated properties of intracluster (IC) gas - temperature, metallicity and entropy profiles - and the stellar mass density at high redshift (see the review by Borgani et al. 2008, and references therein). Statistical properties of clusters, such as X-ray luminosity-temperature, entropy-temperature, and mass-temperature relations, seem also to be discrepant when compared with high-precision optical and X-ray observations (e.g., Kay et al. 2007, Nagai et al. 2007, Tornatore et al. 2007, Kapferer et al. 2007; for a recent review, see Borgani et al. 2008). The mismatch between simulated and observed cluster properties (e.g., Evrard & Henry 1991, Cavaliere, Menci & Tozzi 1998, Tozzi & Norman 2001) is largely due to insufficient accounting for essential physical processes, unrealistic simplifications of the evolution of star formation and feedback processes, and inadequate level of spatial resolution.
Some of the relevant physical processes that affect cluster properties and the dynamical and thermal state of IC gas are mergers of subclusters, galactic winds, ram-pressure stripping and gravitational drag. These have been partly implemented (e.g., Kapferer et al. 2005, Domainko et al. 2005, Bruggen & Ruszkowski 2005, Sijacki & Springel 2006, Kapferer et al. 2007) with some success in predicting IC gas properties. Different combinations of these processes and the various ways they are included in simulation codes generally result in quite different gas properties. An example is star formation (SF), whose self-consistent modeling (in cluster simulations) requires a prohibitively high level of spatial resolution which cannot be achieved with the current computing resources. Because of this limitation, most current simulations use a SF prescription that follows the formation of collisionless star ‘particles’ in a running simulation (e.g., Cen & Ostriker 1992; Nagai & Kravtsov 2005), an approach which leads to an overestimation of the evolution of the SF rate (SFR) (Nagamine et al. 2004), and a higher than expected stellar to gas mass ratio. In addition, as we will show, in this particular implementation of SF the impact of the process remains spatially localized, resulting much lower mass (including metals) and energy ejection out of cluster galaxies, and consequently insufficient suppression of cooling and gas overdensity in cluster cores. This difficulty reflects the complexity of structure and SF processes, underlying the fact that a full implementation of these processes in hydrodynamical simulations is indeed a challenging task that nonetheless motivates attempts to develop a new approach in cluster simulations.
Considerations of galaxy clustering and star formation episodes at high redshift and the inclusion of heating to suppress gas cooling and condensation, lead us to identify Lyman Break Galaxies (LBGs) at as early (‘pre-heating’) sources of IC gas. Implementation of longer episodes of SF in these galaxies induces stronger winds. As a result, the amount of energy and metal-rich gas ejected to IC space is higher, as required for consistency with observations. Gas dispersal is further enhanced by ram-pressure stripping. Incorporating these baryonic processes motivated us to develop a new approach in the description of the evolution of IC gas, one that is based on the powerful adaptive mesh refinement (AMR) cosmological hydrodynamical simulation code - Enzo (Bryan & Norman 1997, O’Shea et al. 2004). We have modified and improved Enzo such that it is capable of following more realistically the hierarchical formation of structure through the inclusion of the most essential physical phenomena. This is accomplished by modeling the baryonic contents of galactic halos at high redshift by an extended ‘galaxy construct’, which we refer to as galcon. The new Enzo-Galcon code does not require additional computational resources compared to the original Enzo code. Because SF and feedback are modeled analytically, the level of resolution required to achieve improved results (compared to the standard simulation) is not extreme. This is the first time that most of the known processes are included in a hydrodynamical non-adiabatic simulation which is also capable of achieving high resolution ( 10 kpc). Initial results from the first implementation of our galcon approach were briefly described by Arieli, Rephaeli & Norman (2008, hereafter ARN).
In this paper a more complete description is given of our galcon approach, and an expanded analysis of the first simulations with the new code, including a wider range of IC gas properties than presented in ARN. In Section 2 we quantitatively describe the main baryonic processes included in our code. The galcon approach is introduced in Section 3, and results from the first Enzo-Galcon simulations are presented in Section 4, with a detailed comparison with the corresponding results from a (‘standard’) Enzo simulation using popular SF and feedback prescription. We end with a summary in Section 5.
2 Gas Dispersal Processes
The nearly cosmic metal abundances of IC gas attest to its largely galactic origin. Among the processes that were suggested to explain the ejection of metals form galaxies are winds (De Young 1978), ram-pressure stripping (Gunn & Gott 1972), galaxy-galaxy interactions (Gnedin 1998, Kapferer et al. 2005), AGN outflows (Moll et al. 2006) and supernovae in IC space (Domainko et al. 2004). Observations seem to indicate that the two most important processes that transfer interstellar (IS) media to IC space, thereby building up the IC gas mass and its metal content, are galactic winds and ram-pressure stripping (e.g. Schindler 2008). In this section we describe the procedures for implementing these processes in our numerical code.
2.1 Galactic wind
SN explosions generate shocks that drive metal-enriched galactic winds into IC space. The warm (shock-heated) IS media are further heated when winds from various galaxies merge and the velocities of the individual shocks are randomized (i.e., effectively thermalized). An observed morphological relation between the X-ray emitting gas and optical emission-line gas (Strickland et al 2000, 2002, Martin et al. 2002 & Cecil et al. 2002) provides evidence for this process. The large width of these lines shows that accelerated IS material can reach velocities of several hundreds up to few thousands of km/s (Heckman et al. 2000). These and other X-ray observations (e.g., Sanders et al. 2004, De Grandi et al. 2004 & Pratt et al. 2006) have observationally established the expected galactic origin of metals in IC gas, and that the mean metallicity is , where is solar metal abundance.
The SN rate reflects the galactic formation rate of high-mass stars. Thus, the SF history is a basic feature of any model of energy and metallicity ejection out of cluster galaxies. Observations of galactic winds (e.g., Heckman 2003) provide direct evidence for the relation between mass and energy ejection rates and the SFR, ,
| (1) |
where the parameters and are energy and mass ejection efficiencies, respectively, and is the speed of light. These efficiency factors cannot be directly predicted from simple considerations, but they can be roughly estimated from observations (e.g., Pettini et al 2001, Heckman et al. 2001), from which typical values of and are adopted (e.g., Cen & Ostriker 1993, Leitherer et al. 1992).
In the galcon approach, the SF history of each galaxy is deduced from observations and input to the simulation. This contrasts sharply with standard approaches for which the SF history is an output of the model. By fitting multiband photometric measurements with simulated galaxy spectra generated by a population synthesis model, the stellar mass density of galaxies can be deduced up to high redshift (Brinchmann & Ellis 2000, Cole et al. 2001, Cohen 2002, Dickinson et al. 2003, Fontana et al. 2003, Glazebrook et al. 2004). Several groups have estimated the global stellar mass density in the redshift range by using this technique (Hopkins & Beacom 2006, Nagamine et al. 2004, and references therein). The results strongly indicate that the SFR peaks at , in accord with some semi-analytic models (e.g. Somerville et al. 2001, Menci et al. 2002), though in other works the SFR peaks at an earlier redshift, (Hernquist & Spirngel 2003, Nagamine et al. 2004). The global SFR density can be expressed in the form (Nagamine et al. 2006)
| (2) |
where t is age of the universe, and are the characteristic SF times of disk and spheroid galaxies, respectively. The parameter A sets the scaling of the spheroid to disk stellar mass ratio, and is determined by the overall normalization of the cosmic SFR. The mass density of galactic halos can be calculated using the Press & Schechter (1974, hereafter PS) mass function
| (3) |
where is the number density (per unit mass) of halos with a mass (in a differential interval around) M, and at redshift (interval around) z. The endpoints of the galactic mass range are taken to be and as indicated by observations (e.g., Nagamine et al. 2002).
We note that our use of the Press-Schechter mass function is for the sole purpose of gauging the star SF history in the two simulated clusters. While the Tinker et al. (2008) mass function is more consistent with results of current simulations, differences between these two functions are mostly important when describing statistical properties of the cluster population. For our main purpose here, namely a comparative study of the SF history in the CR and GR clusters, these differences are insignificant.
The SFR per unit galactic mass can be determined from the latter two expressions by simply taking their ratio, . The total SFR in a galaxy with mass is
| (4) |
which we use to estimate energy and mass ejection by galactic winds. Note that we can readily consider also different forms for the function , reflecting SFR history which may be different in cluster galaxies than the cosmic average.
2.2 Ram-pressure stripping
During cluster collapse and ensuing episodes of galaxy and subcluster mergers, IS media are partly stripped by tidal interaction between galaxies. As IC gas density builds up, ram-pressure stripping becomes increasingly more effective, especially in the central, higher density region. We quantify this hydrodynamic process by determining for each galaxy (at any given time) the stripping radius, where local IC gas pressure is equal to the local galactic IS pressure. It is simply assumed that all IS gas outside this radius is stripped in a relatively short dynamical time.
Ram-pressure stripping (Gunn & Gott 1972) was modeled using a simplified analytic expression (e.g., Domainko et al. 2006, Kapferer et al. 2007) which is valid for motion of a spiral galaxy in a direction perpendicular to its disk. The criterion for stripping was based on a comparison of the external pressure force exerted by IC gas with the gravitational attraction of the disk stars. This is clearly inappropriate in galaxies whose mass is dominated by DM, especially in the outer disk (and galactic halo). We thus generalize the stripping criterion at position R to include the gravitational force by the total galactic mass interior to R,
| (5) |
where is the gravitational constant, is the local IC gas density, is the velocity of the galaxy in the cluster frame, and is the mass exterior to . This relation provides an approximate estimate of the stripped mass, , and the stripping radius, , if the galactic gas density profile is known (see section 3.1 for further details).
Gas located outside the stripping radius is driven by ram pressure out of the galaxy. Stripping truncates the gaseous disk but is not expected to modify the profile of gas interior to ; neither does it appreciably affect the dynamics of the stellar and DM components of a galaxy (Kenny & Koopmann 1999, Kenny, Van Gorkom & Vollmer 2004).
3 The Enzo-Galcon code
Various SF prescriptions have been used to form new collisionless star ‘particles’ in cosmological simulations (e.g., Cen & Ostriker 1992; Katz, Weinberg, & Hernquist 1996, Springel & Hernquist 2003; Nagai & Kravtsov 2005). The basic approach in these recipes is that star groups are formed only in regions with density higher than some constant threshold density. However, current cosmological simulations are limited to a level of spatial resolution of not less than a few kpc, whereas star groups are formed on much smaller length scales (10-100 pc). Furthermore, simulations are also limited by mass resolution, thus only large star clusters can be formed, a result which is inconsistent with observations of much smaller star groups. To be more realistic, simulations need to attain higher spatial and mass resolutions, which obviously necessitate prohibitively high computing resources (for this task). Other related physical processes, such as galactic winds and ram-pressure stripping, are sufficiently complex and cannot be realistically modeled using the current heuristic SF and feedback mechanisms.
Current cluster simulations also fail to preserve galaxy-size halos due to substantial overmerging during cluster formation (Klypin et al. 1999). In practice, even when using higher spatial and mass resolutions this problem is only somewhat less severe, and simulated clusters still have only a small number of identified galaxies. In principle, AMR codes are capable of preserving the less massive halos from overmerging if they solve the dynamics of DM and gas in the relevant volume with an adequate level of refinement. However, halos are not pre-defined objects during the run, and their locations and sizes can only be deduced efficiently off-line. Thus, the volume that needs to be refined at each time step is unknown, making this approach impractical to perform in current AMR codes. These drawbacks are probably the main reasons for the discrepancy between results of cosmological simulations and observations (e.g., Borgani et al. 2008).
The inadequacy of spatial and mass resolution in current cosmological simulation codes poses a challenge that motivated us to seek a new direction in attaining an improved description of the evolution of clusters. More specifically, the fact that our main interest is the evolution of IC gas - rather than an improved numerical description of galactic structure - led us to develop a semi-analytic model for the galaxy as a whole. We replace the baryonic contents of the under-resolved galaxies with a physically extended galaxy subgrid model - a galcon. As is demonstrated below, the introduction of galcons allows us to substantially simplify analytic modeling of SF, wind, and ram-pressure stripping processes. Galcons are initialized at the center of DM halos, and the implementation of these processes is affected by simple analytic models, allowing full control of the evolution of the stellar and gaseous contents of galaxies. Due to their extended morphology, mass and energy ejecta from galcons are deposited at large galactic radii, directly mixing there with IC gas. This prescription is very different from previous models in which ejecta were deposited at the galactic center, with little likelihood of ever leaving the galaxy. Moreover, since galcons are fully identified systems, their positions and dimensions are known at each time step. This allows us to use a second refinement criterion, in addition to the regular density refinement criterion, which refines cells that contain DM or gas densities higher than a given value. The other criterion is geometrical: At each timestep cells that are placed inside the outer radius of each galcon, and those that are located in a layer surrounding each galcon, are refined to the highest attainable level of resolution. This ensures that all halos are adequately resolved, improving the description of both the dynamics and hydrodynamics in these regions, thereby preventing the overmerging of halos at later times. This seems to be the first time that a geometrical refinement criterion based on simulation object is used in a hydrodynamical simulation.
Our cluster simulations are based on the powerful Enzo adaptive mesh refinement (AMR) code (Bryan & Norman 1997; Bryan 1999; Norman & Bryan 1999; Bryan, Abel & Norman 2001, O’Shea et al. 2004). Enzo is a grid-based hybrid code (hydro + N-body) which uses the AMR algorithm of Berger & Collela (1989) to improve spatial resolution in regions of large gradients, such as in gravitationally collapsing objects. The method is attractive for cosmological applications because (1) it is spatially-and time-adaptive, (2) it uses accurate and well-tested grid-based methods for solving the equations of hydrodynamics, and (3) it can be well optimized and parallelized. The central idea behind AMR is to solve the evolution equations on a grid, adding finer meshes in regions that require enhanced resolution. Mesh refinement can be continued to an arbitrary level, based on criteria involving any combination of overdensity (DM and/or baryon), Jeans length, cooling time, etc., enabling us to tailor the adaptivity to the problem of interest. The code can follow the evolution of the following physics models: Collisionless DM using the particle-mesh N-body technique; gravity, using FFTs on the root grid and multigrid relaxation on the subgrids; cosmic expansion; gas dynamics, using the piecewise parabolic method (PPM); multispecies nonequilibrium ionization and H2 chemistry, using backward Euler time differencing, and radiative heating and cooling, using subcycled forward Euler time differencing.
Customizing Enzo with galcons enables us to follow the hierarchical formation of a cluster, and description of its DM and IC gas properties, more realistically by including the most important physical phenomena, yet attaining a high level of spatial resolution even in the central region of the cluster. This is achieved by performing a high resolution cosmological simulation, starting at some initial redshift (usually ) and proceeding up to a redshift in the range . At galactic DM halos, basic elements of the protocluster, are located by one of the halo finding techniques (Eisenstein & Hut 1998), and the baryon density profiles are examined. Then, the baryonic mass inside these halos is replaced by a galcon with the same density profile and total mass (so that an unphysical instantaneous change in the simulated density distribution does not occur). After the replacement, the simulation is continued to redshift zero, with galcons traveling in a sea of DM particles and gas, enriching IC gas with energy, mass, and metals. Note that Metzler & Evrard (1994) had already attempted to incorporate galactic winds in a simplified description of galaxies, but in their SPH simulations galaxies were treated as point particles, and the wind prescription was overly simplified.
3.1 Models
A key aspect of our approach is based on SF and feedback in galcons. Strong observational evidence that the SFR peaked at the redshift range , combined with the knowledge that high-redshift galaxies were then already well developed, lead us to introduce galcons at this epoch of protocluster evolution. A hydrodynamical non-adiabatic Enzo simulation is evolved with no SF until a redshift at the above range; at this replacement redshift, the run is stopped and galactic halos with total mass in the range are identified. This is the mass range of high redshift galaxies, mainly LBG, as indicated by observations (e.g., Nagamine et al. 2002).
The baryonic density profile of each halo is truncated at , the radius where the density is 200 times the background level, and the baryonic content is then analyzed. First, the outer radius () of the region containing 90% of baryonic mass is determined; this will be the radius of the region where feedback energy and mass are deposited. This choice of radius ensures that most of the galaxy baryonic gas is included in the galcon, while avoiding discontinuity in the mass profile when inserting the galcon into the galactic center. The gas mass density is then fit by a -profile, , where is a core radius, and is the central density. This profile describes well the baryonic contents of high redshift galaxies.
Both stellar and gaseous components are included in galcons, and since their spatial distributions are expected to be initially very similar, it is reasonable to take for both the same -profile parameters, but with different central densities. Adding up the stellar and gaseous contents of each halo yields the total baryonic mass, , and the initial central galcon baryon density
| (6) |
where . Initialized with the velocity of the halo, the galcon is inserted into the center of the halo and initialized with an extended spherical density distribution using the fitting parameters that were found earlier.
To determine the initial gaseous-to-stellar mass ratio, , at the gas and stellar mass densities have to be calculated. The total baryonic mass density can be evaluated by multiplying the mass derived from the Press & Schechter (1974) mass function by the universal baryonic density
| (7) |
where is the number density of halos with a given mass and redshift, and the integration limits are the same as in Eq. 3. The star mass density can be evaluated by integrating the cosmic SFR density from Eq. 2
| (8) |
where and are the times when SF began and the replacement time, respectively. Since the cosmic SFR density dramatically decreases at , we simplify somewhat by taking .
The gas-to-star mass ratio in galaxies at can now be determined
| (9) |
Taking =6, and assuming that the peak in the cosmic SFR density is at , we compute . This result is used to set the initial central density of the galcon stellar and gaseous components such that its extended density distribution has the form
| (10) |
where and are the stellar and gas central densities.
Having initiated galcons as described above, we can now follow the mass and energy ejection processes that enrich IC gas - galactic winds and ram-pressure stripping. While both processes reduce the mass of IS gas, only winds reduce the total mass of (already formed) stars. Winds affect only the stellar component of galcons by reducing the stellar mass. Ram pressure stripping continuously reduces the galcon outer gas radius. Because galactic winds are SN driven, their elemental abundances are higher than in IS gas, by a factor of . The enrichment by each of these processes is separately followed.
Galcons are treated in the code as collisionless particles, but with an extended density distribution as described earlier. In the current phase of the work we do not include any enhancement in the SFR due to mergers of galcons. However, since the code includes a full treatment of the dynamics of DM, galcons, and density fields, mergers do occur in the simulation. An explicit description of mergers and their impact will be studied in the second phase of our work.
At each time step () the code calculates the current SFR of each galcon according to eq. 2, based on which the energy and mass ejected by the wind are determined by
| (11) |
The ejected stellar mass contains a blend of heavy metals which incrementally increases the metallicity of IC gas by an amount which is proportional to galcon mass ejecta. The transfer of mass and energy to IC gas is implemented by isotropically distributing the ejecta over a thin layer (which typically has the size of the maximal resolution length) surrounding the outer galcon radius. Note though that the dependence on the thickness of this layer is relatively weak since we achieve a resolution of 9 kpc, obviously much smaller than a typical IC gas core radius of kpc. In our initial work outflows are taken to be isotropic; this assumption can be relaxed in follow-up work to include the possibility of bipolar or some other non-isotropic flow.
Accurate determination of the metallicity of the ejecta requires a detailed description of the initial mass function (IMF), the SF process, and metal yields of different SN types. Since the primary objective of this work is to investigate the overall impact of the galactic feedback processes on IC gas, irrespective of the detailed stellar processes involved in ejecting metals into IS gas, we simplify our model by considering the overall SFR from the entire disk (as described in section 2.1).
SN ejecta from the galactic disk quickly interact through shocks and mix with the surrounding IS gas, so that the wind contains a blend of heavy metals from stars and IS gas. However, the fraction of gas in the ejecta cannot be accurately determined. We assume that most of the wind ejecta come from the stellar component whose metallicity is approximately solar; accordingly, we subtract the energy and mass that is carried by the wind from the galcon stellar content and increase the metallicity of IC gas by an amount which is proportional to the galcon mass ejecta. Also, since the level of SN activity is roughly linearly proportional to the local star density, the wind does not modify the spatial stellar profile. Thus, we only adjust the central density of the stellar component to reflect the loss of stellar material,
| (12) |
where , and are the current galcon stellar mass and its value in the previous time step, respectively.
As discussed in section 2.2, stripping is modeled by ejecting the gaseous mass located outside of the stripping radius into IC gas. Eq. 5 is used to compute the mass to be stripped at the current time step
| (13) |
where is the outer radius of the gaseous sphere at the current time step. Knowing the radial () profile of the gas, this mass is used to find the stripping radius . Gas located outside this radius is then removed from the galcon and deposited isotropically into IC space. As noted already, stripping only truncates the gas outer radius without modifying its mass profile; thus, the outer radius of the galcon gas component is now truncated at the stripping radius, but the scale radius and central density are unchanged.
4 First Galcon simulations
We have performed two sets of high resolution simulations with AMR and radiative cooling (Sutherland & Dopita 1993). The first - referred to as the galcon run (GR) - included the above physical processes and the galcon algorithm, whereas the second, an Enzo run with no galcons - the comparison run (CR) - included only the SF and feedback recipe of Cen & Ostriker (1992). We carry out a detailed comparison of results from these two runs in order to quantify the improvements in the description of the evolution of IC gas in our new galcon code. The root grid in both runs includes cells which cover a comoving volume of with two nested inner grids. The highest refined grid covers a comoving volume of divided into cells; this can be further refined by up to 5 levels, with a maximum 9 kpc resolution.
The simulations were initialized at assuming a CDM model with , , , and ( in units of 100 ). The CR run was evolved continuously to . The GR run was stopped at , and a halo-finding algorithm (Eisenstein & Hut 1998) was used to locate 89 galactic halos with mass in the range within a volume which eventually collapsed to form the cluster. The baryonic contents of these halos were analyzed and replaced by galcons, as described in section 3.1. The GR run was then resumed and evolved to with the additional physical processes as described in the previous section. Results from these two runs are presented in the next two subsections.
4.1 Basic cluster properties
The two simulated (GR and CR) clusters are rich, , with very similar global properties, which are summarized in Table 1. Clearly, the near equality in the global properties of the clusters stems from the identically followed DM dynamics which govern cluster formation and evolution. Significant differences are expected and seen in the the baryonic mass components, particularly in the central regions.
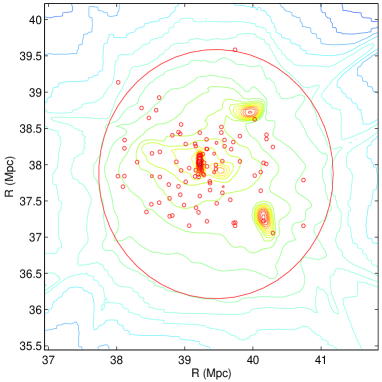
First, a significant difference is seen in the number of cluster galaxies; within the virial radius of the GR cluster 89 galaxies were identified (Fig. 1), as compared with only 6 galaxies in the CR cluster. The drastically lower number of identified galaxies in the CR cluster is a result of inadequate force resolution and consequently unphysical merging of galaxy DM halos (the “overmerging problem”; Moore et al. 1996, Klypin et al. 1999.). It is argued that a proper force resolution of kpc, and mass resolution are required for galaxy mass halos to survive in the dense cluster core (Klypin et al. 1999). In our Enzo simulations this mass resolution requirement is met, but the 9 kpc comoving force resolution is apparently too coarse for preventing overmerging. On the other hand, by replacing the baryon contents of galaxies with galcons at z=3, when the proper force resolution is four times better - and the mass distribution determined to a higher degree of detail - we effectively force retention of ‘memory’ of this state in latter stages of the cluster evolution in a way that is essentially resolution-independent. During the N-body dynamics phase of the calculation, the extended mass distribution of galcons is deposited to the mesh where it helps anchor the DM halo, despite less than optimal force resolution. Even so, some galcons did merge, but their number remained much higher than in the CR cluster whose halos merged successively to form higher mass systems. The fact that the galcon approach requires substantially lower resolution for overcoming the overmerging problem constitutes a significant advantage over other simulation codes, an advantage that has important consequences for IC gas properties, as demonstrated below.
| GR cluster | CR cluster | |
| Total Mass | 5.44 | 5.43 |
| DM mass | 4.89 | 4.88 |
| Gas mass | 0.504 | 0.434 |
| Stellar mass | 0.045 | 0.106 |
| 1.71 | 1.71 |
4.2 DM and galcon velocity distributions
While the main focus of our first galcon simulations have been IC gas properties, it is very much of interest to compare the galcon velocity distribution with that of DM. The relatively large number of identified galcons makes it feasible to determine the velocity anisotropy profile also for the cluster galaxies in our GR simulation. Since galcons are essentially collisionless, their kinematics would be expected to resemble that of DM. Any differences in the phase space distributions of galaxies and DM, especially in the central region where galaxy density is high and - under the action of gravitational drag (e.g., Rephaeli & Salpeter 1980) - the galaxy distribution may show some indication of a weak degree of collisional evolution, which could be manifested in a faster approach to isotropy. For this and other reasons it is of interest to compare the velocity anisotropy of these two matter components
| (14) |
where and are the 1-dimensional tangential and radial velocity dispersions (in a spatially spherically symmetric system). The late assemblage of clusters, and their relatively long crossing times, would suggest that (even DM) velocities are not likely to isotropize in the outer regions of clusters where matter components (especially recently accreted DM and galaxies) are not well-mixed.
The spatial distributions of DM and galaxy velocities in clusters are of great interest for characterization of cluster morphology and dynamical evolution. For example, the comparison of velocity anisotropy profiles of these two (mostly) collisionless components can reveal details of their true phase space character. The ability to investigate this and other issues has improved significantly with the more extensive observational databases that are now available - large samples of both positions and velocities of member galaxies, DM and total mass profiles deduced from joint gravitational lensing and X-ray maps. In a recent work, Host et al. (2009) used X-ray observables of IC gas for inferring the radial profile of the velocity anisotropy of the cluster DM based on assuming a universal relation between DM velocity dispersion and gas temperature, calibrated using numerical simulations. Applying this approach to both low and intermediate redshift samples, they found that the DM velocity anisotropy is significantly different than zero, indicating that DM is effectively collisionless. Lemze et al. (2009) used a model-independent method to solve the Jeans equation, simultaneously incorporating the observed velocity dispersion profile and galaxy number counts, to study the velocity anisotropy of the cluster Abell 1689. In accord with previous results, velocities were found to be mostly radial in the outer region of the cluster and mostly tangential in the central region.
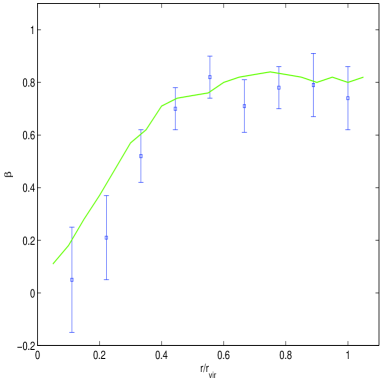
Numerical N-body simulations of collisionless DM also show that velocities are anisotropic in the outer region, with greater than zero in the central region, and increasing to near the virial radius (e.g., Colin et al. 2000, Hansen & Stadel 2006, Host et al. 2009). Similar behavior is seen in figure 2, where is plotted as function of radial distance from the center of our simulated GR cluster. The corresponding values of for the galcons, shown by the squares (with their associated uncertainty intervals), follow the DM curve above . There is some indication that galcon velocities are somewhat more isotropic in the central region, a trend that is in accord with theoretical expectation. It will be interesting to see if this behavior will also be found in future simulations with a larger number of galcons.
Also indicative of the degree of relaxation is the smoothness of the anisotropy profile. The presence of significant sub-clumps and ongoing merger activity would likely result in a non-smooth profile; as can be seen in figure 2, the GR cluster has a relatively smooth profile indicating that the cluster is well relaxed. These preliminary results demonstrate the enhanced capability of probing the structure and evolution of clusters with our Enzo-Galcon code.
4.3 Star formation and heating
SF history is a central driver of gas feedback processes. It is therefore very important to verify that our GR simulation yields an acceptable stellar mass fraction, and produces the required gas heating to overcome overcooling. As stated before, we adopt the functional redshift behavior of the observationally deduced cosmic SFR (see Eq. 2) to calculate the SFR of each galcon at a given z. However, each galcon has a different initial mass, which varies during the evolution of the galaxy it represents. Therefore, SFR in galcons is calculated based on the total mass of its parent halo at each redshift, and is only indirectly determined by the global cosmic SFR. Figure 3 shows a comparison between the resultant cosmic SFR in the GR and CR clusters with the observational data.
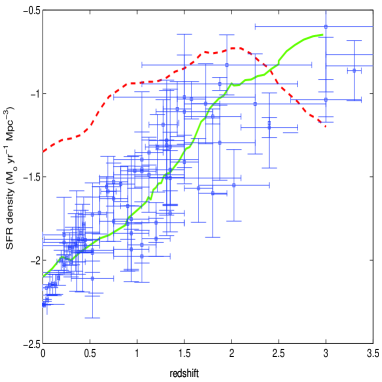
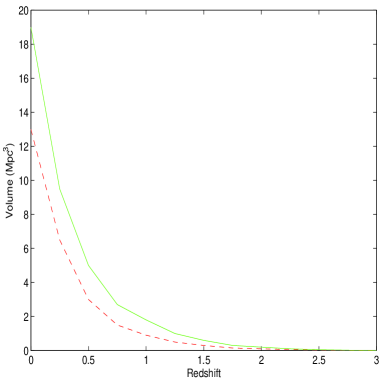
As is quite obvious from Figure 3, the cosmic SFR density of the GR cluster is consistent with the observational data at all redshifts (in the interval considered here). The resultant SFR density in the CR cluster behaves differently and does not fit well the observations. The SFR density is lower than the observed values at higher redshift and higher at lower redshifts. Moreover, the peak of the SFR density is around , significantly later than the observationally deduced peak redshift of . In the CR simulation the prescription of Cen & Ostriker (1992) is implemented to form new star particles. Generally, groups of stars are formed in regions where the density is higher than a threshold value, or when cooling times are shorter than a characteristic timescale. As mentioned earlier, accurately resolving the full cluster volume requires prohibitively large computing resources. Therefore, it is likely that gas clumps are not treated realistically, leading to very imprecise estimation of the stellar mass. This can be assessed by calculating the volume over which feedback occurs at each redshift. As can be seen from Figure 4, the feedback process in the CR cluster is limited to a smaller region than in the GR cluster at all redshifts. Consequently, the CR cluster contains a higher fraction of cool gas, and therefore also increased SFR and stellar mass. The enhanced SFR leads to a high star-to-gas mass ratio of 22%, about twice higher than the observationally deduced value (e.g., Balogh et al. 2001; Wu & Xue 2002).
On the other hand, energy feedback due to wind in the GR cluster succeeds in supplying a sufficient amount of thermal energy to heat the cold gas, thereby preventing the formation of too many stars. As a result, mass of the cold component is only 9.5%, as compared to the hot IC gas mass. In contrast with the localized nature of SF and feedback in the CR cluster, in the galcon approach SF is much less local, and energy is deposited directly to a region immediately outside the galaxy. Thus, energy spreads out more easily, heating IC gas more efficiently. In addition, the strength of the feedback in the galcon approach is directly determined by the mass of the galaxy, since the feedback is proportional to the SFR. Thus, as required, feedback is enhanced in the cluster central region. These two features underline the significant differences between the two respective SF models. The capability of the galcon approach to correctly reproduce both the proper cosmic SFR history and the amount of stars in the cluster highlights its advantages, and demonstrates the importance of a more realistic description of the the relevant physical processes.
4.4 Gas density and temperature
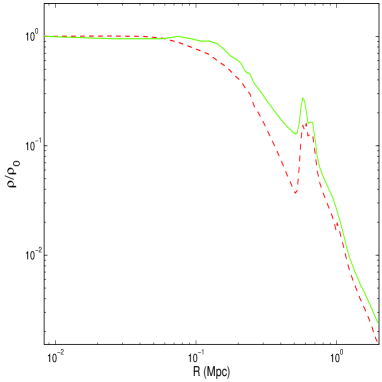
Clearly, IC gas properties are strongly affected by the nature of physical processes that occurred during cluster collapse and evolution. In Figure 5 IC gas density profiles in the two clusters are compared. The density profiles are similar at large radii, including a steep hump at 600kpc, indicating the location of a very massive clump. The profiles flatten toward the center, but the GR cluster has a substantially larger core of 180 kpc, as compared to a relatively small core of kpc in the CR cluster. Gas core radii of massive isothermal clusters, similar to our simulated clusters, are typically in kpc (e.g., Sun M. et al. 2009). While the core of the GR cluster is at the low end of this range, the core of the CR cluster unrealistically small. The shape of the density profile in the central region is mainly determined by the fraction of IC gas that cooled down and converted into stars. The absence of sufficient feedback in the CR cluster results in excessive mass of cool gas in the inner core. Strong cooling results in a small core as well as an unrealistically high number of stars, whereas in the GR cluster feedback is stronger and more efficiently spread, resulting in suppression of overcooling, and in a larger core.
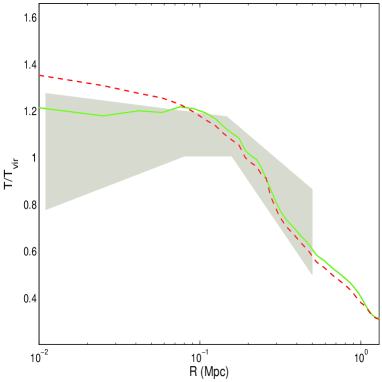
Other baryonic properties differ substantially in the two clusters; perhaps the most prominent difference is shown in the temperature distribution, which is plotted in figure 6. Neither the clusters has a cool core. Non cooling-flow clusters have an isothermal flat core and the temperature profile declines rapidly outside the core (e.g., Snowden et al. 2008, Pratt et al. 2007). As can be seen in figure 6, both clusters do show a rapid decline in the temperature profile at radii larger than 200 kpc. However, only the GR cluster has a flat isothermal core, while in the CR cluster the temperature continues a moderate rise toward the center. The difference between the two profiles is more pronounced when compared to observational results. In figure 6 we show the mean temperature profile with its uncertainty region as deduced from XMM-Newton observations of 15 nearby clusters (Pratt et al. 2007). The mean profile of this sample shows an isothermal behavior in the central region, although it slightly decreases due to 4 cool-core clusters that are also included in the sample.
In the CR cluster a local SF prescription is used to create star groups in cells with high density and low temperature. The feedback from these star groups enriches and heats their immediate surroundings, spreading only over a small central region. As a result, most of the gas outside this region cools and converts to stars. This results in a small gaseous core. In contrast, in the galcon approach galaxies are treated more globally, with a wind and energy feedback prescription that spreads energy over an extended region. This feature is the main ingredient leading to the formation of an isothermal core in the GR cluster. Energy feedback in our new approach is deposited directly into the gaseous layer surrounding the galaxy. The galcon feedback successfully spreads out heat energy into IC gas resulting in a large core in the GR cluster. As a result, the temperature profile of the GR overlaps with the observational data.
4.5 Gas metallicity
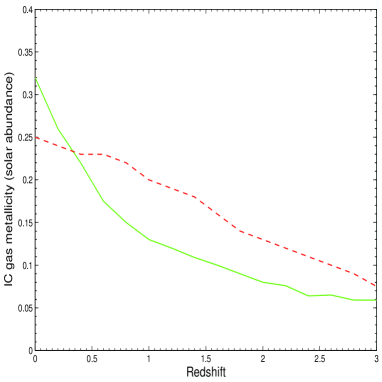
One of the unique advantages of the new approach is its capability to trace not only the total metallicity in the IC gas, but also the unique metallicity enrichment history and its spatial distribution as result of each physical process that is included in the code. Fig 7 shows the evolution of metallicity in the two clusters. Recent high-resolution Chandra observations of a large sample of clusters (Balestra et al. 2007, Maughan et al. 2008) have shown a significant increase in the metallicity towards lower redshifts, as seen in the GR cluster. These results imply that the average IC metallicity at the current epoch is at least twice higher than its initial value around the time of cluster formation. The slope of the metallicity evolution in the GR cluster is consistent with these results. This behavior also agrees with that predicted by Ettori (2005) based on models of SFR and subsequent evolution of SN feedback. In contrast, the metallicity evolution in the CR is much weaker. This relatively flat behavior is probably caused due to the over-estimated SFR of star particles in the CR cluster at higher redshifts (see figure 3. As discussed above, the SFR in the CR cluster at its formation () is substantially higher than expected, and a higher fraction of metals is ejected into IC space already at higher redshifts, flattening the metallicity evolution.
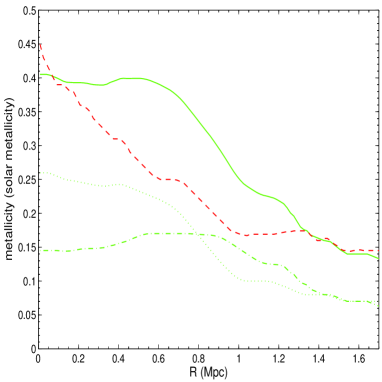
Metallicity in the GR cluster (Fig 8) is due to enrichment by both winds and ram pressure stripping, with the former process being more effective at higher redshifts, since it is driven by shocks from SN that are then more prevalent. At early periods of cluster evolution a higher fraction of galaxies are outside the cluster core, where metals are preferentially deposited. As the cluster evolves, galaxies are more centrally distributed, so metals are more effectively spread in the central region. This results in an approximately constant metallicity across the cluster. On the other hand, because gas stripping depends on the local IC gas density, which builds up as the cluster evolves, the contribution to the metallicity is larger at lower , and is more concentrated in the high density core, resulting in a substantial metallicity gradient.
The total metallicity in the GR cluster is roughly constant out to 700 kpc; it decreases at larger radii, with a mean value of 0.32, which is in the observationally determined range, (e.g., Baldi et al. 2007). The mean metallicity in the CR cluster is 0.25, somewhat lower than typical. Moreover, its steep decline already in the central region is also inconsistent with observations, which show a nearly constant metallicity in the central few hundred kpc (Hayakawa et al. 2006, Pratt et al. 2006), with the exception of a small galactic-size region at the cluster center where the metallicity is higher (Snowden et al. 2008). A much shallower gradient is observed in cooling flow clusters (e.g., De Grandi et al. 2004), but our simulated clusters have no cooling flows. We conclude that in our GR simulation - which includes galactic winds and ram pressure stripping - both the metallicity evolution, the level of metallicity and its spatial profile are consistent with observations, whereas neither property is well reproduced in the CR cluster.
In summary, feedback in our the new approach is shown to be very efficient in spreading energy deposition over the central region of the cluster, resulting in SF history and IC gas properties that are more consistent with observations.
4.6 Gas entropy profile
The gas entropy is a basic quantity that could yield additional insight on the thermal evolution of the gas beyond what can be learned separately from the density and temperature. Defined as
| (15) |
where is the Bolzmann constant and is the gas number density, the entropy is the simplest combination of and that is invariant under adiabatic processes in the gas. Both the level and radial profile of the entropy are useful for determining the effectiveness and distribution of non-gravitational heating of IC gas. Spherical accretion models of non-radiative clusters (Tozzi & Norman 2001, Borgani et al. 2002, Voit et al. 2005) predict a power law profile, for . Within
a gradual flattening of the profile (with a large scatter in the central value of ) has been determined (Pratt et al. 2006, Donahue et al. 2006, Vikhlinin et al. 2006). If further confirmed by more sensitive, high resolution measurements that do indeed allow detailed modeling of both the density and temperature profiles in the inner core regions, the apparent entropy flattening - referred to as entropy ‘floor’ - could possibly be a result of heating processes that occurred in the early stages of the (hierarchical) cluster formation, or perhaps due to substantial enhancement of feedback processes late in the formation stage.
In many cluster simulations cluster cores are too compact, and with increasing temperature profile towards the center. This is likely due to inadequate implementation of the processes of galactic winds and ram pressure stripping, which are less important in the outer regions of clusters, so their impact in not seen in outer cluster regions, where simulations succeed in reproducing the entropy profile at (e.g., Nagai et al. 2006). This possibly is the reason why most simulations fail to reproduce the central entropy profile - it flattens too quickly at a level that is higher than indicated by observations. The high entropy floor problem occurs in both AMR and SPH codes, but is known to be less severe in SPH simulations (e.g., Voit et al. 2005), in which the temperature profile increases only slightly towards the center. We note that in a recent analysis of X-ray and lensing measurements of A1689 Lemze et al. (2008) have found the ‘entropy floor’ to be even lower than the previously determined level, further increasing the discrepancy between simulations and observations.
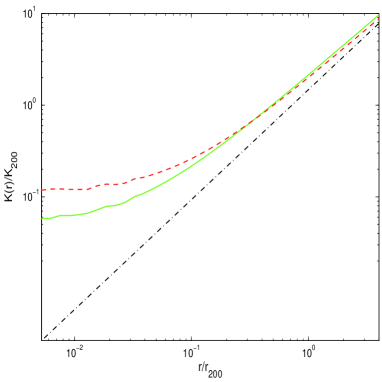
We compare the behavior of the entropy profiles in our two simulated clusters in Fig 9. In order to best clarify the behavior of the entropy, we subtracted the massive clump placed at kpc from the center from both clusters. As can be expected from the previously shown density and temperature profiles, flattening of the entropy profile in CR cluster occurs at larger radius as compared to that of the GR cluster. The combination of a larger gas core radius and the isothermal temperature profile in the GR cluster yields a relatively low entropy floor. The entropy continues to decrease even below ; it gradually flattens only below , in accord with the trend indicated by observations (e.g., Cavagnolo et al. 2009).
5 Conclusion
In this paper we described our galcon approach to simulating baryonic processes in clusters using the new Enzo-Galcon AMR code. As we have demonstrated, the combination of galcons with improved semi-analytic modeling of the relevant baryonic processes yields a powerful code that is capable of reproducing the basic properties of clusters. This novel approach successfully describes SF and the basic properties of IC gas, by a more realistic implementation of galactic wind and ram-pressure stripping of metal-enriched IS media into IC space.
With improved measurement quality in all the major frequency bands (microwave, optical, and X-ray), there is a great need to expand simulation codes, both in the range of physical processes that are taken explicitly into account, and in the capability to attain higher spatial resolution. Towards this goal we will use a new and improved version (1.5) of the Enzo code. We expect that the combined Enzo-Galcon code will make it possible to resolve scales to a typical accretion radius, or kpc, an important milestone that is required for a more meaningful physical description of the interaction of a cluster galaxy with ambient DM and IC gas. With the upgraded code we will be able to identify a much larger number of halos, to replace galactic halos with galcons as the cluster evolves (rather than doing so only once at an early time), to include additional feedback sources (such as AGN), to identify galactic merger sites, and to improve our prescription for how mass and energy are deposited into IC space. We will also have better capability to simulate more realistically the properties of DM since the identification of a relatively large number of galaxies, and the ability to follow their feedback processes, translate also to a more physical description of the impact of galaxies and their feedback on the DM, especially in the central cluster region. By comparing similar properties of galaxies, IC gas, and DM, we are likely to gain additional insight on all these important cluster components.
We thank Alexei Kritsuk and Brian O’Shea for many useful discussions, and Andrew Hopkins for providing the observational SFR data. Work at Tel Aviv University is supported by US-IL Binational Science foundation grant XXX/09. The simulations were performed on the Data Star system at the San Diego Supercomputer Center using LRAC allocation TG-MCA98N020. This work has been partially supported by NSF grants AST-0708960 and AST-0808184 to MLN.
References
Allen S.W. & Fabian A.C. 1998, MNRAS 297, 63.
Arieli Y. & Rephaeli Y. 2003, New Astron. 8, 517A.
Arnaud M. & Evrard A.E. 1999, MNRAS 305, 631.
Baldi A. et al. 2007, ApJ. 666, 835.
Balestra I. et al. 2007, Astron. Astrophys. 462, 429.
Balogh M.L. et al. 2001, MNRAS 326, 1228.
Berger M. J. & Colella P. 1989, J. Comput. Phys., 82, 64.
Boleman, J., Dogiel, V. A. & Ptuskin, V. S., 1993 Astron. Astrophys. 267, 372.
Borgani S. et al. 2002, astro-ph/0310794.
Borgani S. et al. 2008, SSRv 134, 269.
Borgani S. et al. 2008, SSRv 134, 379.
Bruggen M. & Ruszkowski M. 2005, astro-ph/0512148.
Bryan G. L. & Norman M. L. 1997, in ASP Conf. Ser. 123, Computational Astrophysics, ed. D. A. Clarke & M. Fall (San Francisco: ASP), 363.
Bryan G. L. & Norman M. L. 1999, in Workshop on Structured Adaptive Mesh Refinement Grid Methods, ed. N. Chrisochoides (IMA Volumes in Mathematics 117), 165.
Bryan G. L. Abel T. & Norman M. L. 2001, in Supercomputing 2001 (IEEE, http://www.sc2001.org/papers/).
Castillo-Morales A. & Schindler S. 2003, Astron. Astrophys. 403, 433.
Cavagnolo K.W et al. 2009, Ap. J. Supp. 182, 12.
Cavaliere A., Menci N. & Tozzi P. 1998, ApJ. 501, 493.
Cavaliere A., Lapi A. & Menci N. 2002, ApJ. 581, L1.
Cen R. & Ostriker J.P. 1992, Ap. J. Lett. 399, L113.
Chandrasekhar S. 1943, ApJ. 97, 255.
Colin P., Klypin A. & Kravtsov A.V. 2000, ApJ. 539, 561.
Connolly A.J. et al. 1997, ApJ. 486, L11.
de Blok W.J.G. et al. 2001, Astron. J. 122, 2396.
De Young D.S. 1978, ApJ. 223, 47.
Domainko, W., et al. 2006, Astron. Astrophys. , 452, 795.
Efstathiou G., Davis M. White S. D. M., & Frenk C. S. 1985, ApJ. , 57, 241.
Eisenstein D. J. & Hut P. 1998, ApJ. , 498, 137.
Ettori S., De Grandi S. & Molandi S. 2002, Astron. Astrophys. 391, 841.
Ettori S. 2005, MNRAS 362, 110.
Fabian A. et al. 2000, MNRAS 318, L65.
Finoguenov A., Reiprich T. & Bohringer H. 2001, Astron. Astrophys. 368, 769.
Frenk C.S. et al. 1999, ApJ. 525, 554.
Fukazawa Y., Kawano N. & Kawashima K. 2004, ApJ. 606, L109.
Gavazzi R. et al. 2003, Astron. Astrophys. 403, 11.
Genadin N.Y. 1998, MNRAS 294, 407.
Giavalisco M. et al. 2004, ApJ. 600, L103.
Gunn J.E. & Gott J.R. 1972, ApJ. 176, 1.
Hansen S.A & Moore B. 2006, New Astron. 11, 333.
Harnquist L. & Springel V. 2003, MNRAS 341, 1253.
Hayakawa A. et al. 2004, ApJ. 56, 743.
Helsdon S.F. & Ponman T.J. 2000, MNRAS 315, 356.
Hopkins A.M. & Beacom J.F. 2006, ApJ. 651, 142.
Holden B. et al. 2002, Astron. J. 124, 33.
Host et al. 2009, ApJ. 690, 358.
Jing Y.P. & Suto Y. 2000, ApJ. 529, 69.
Kay et al. 2007, MNRAS 377, 317.
Kapferer W. et al. 2005, astro-ph/0503559.
Kapferer W. et al. 2007, Astron. Astrophys. 466, 813.
Katz N., Weinberg D.H. & Hernquist L. 1996, Ap. J. Supp. 105, 19.
Klypin A., Gottlober S. & Kravtzov A.V. 1999, ApJ. 516, 530.
Klypin A. et al. 2001, ApJ. 554, 903.
Learche I. & Schlickeiser R. 1980, ApJ. 239, 1089.
Lemze D. et al. 2008, MNRAS 386, 1092.
Lemze D. et al. 2009, astro-ph/0810.3129.
Lilly S.J. et al. 1996, ApJ. 460, L1.
Madau P. et al. 1996, MNRAS 283, 1388.
Maughan B.J et al. 2008, Ap. J. Supp. 174, 117.
Markevitch M. 1998, ApJ. 504, 27.
McNamara B.R. et al. 2000 ApJ. 534, L135.
Menci N. et al. 2002, ApJ. 575, 18.
Metzler C.A. & Evrard A.E. 1994, ApJ. 437, 564.
Moore B. et al. 1998, ApJ. 499, 5.
Nagai D., Vikhlinin A. & Kravtsov A.V. 2007, ApJ. 655, 98.
Nagamine K. 2002, ApJ. 564, 73.
Nagamine K. et al. 2004, ApJ. 610, 45.
Navarro J. F., Frenk C. S. & White S. D. M. 1997, ApJ. 490, 493.
Nevalainen J., Markevitch M. & Forman W. 2000, ApJ. 532, 694.
Norman M. L. & Bryan G. L. 1999, in Numerical Astrophysics: Proc. Int. Conf. on Numerical Astrophysics 1998 (NAP98), ed. S. M. Miyama, K. Tomisaka, & T. Hanawa ( Dordrecht: Kluwer), 19.
Novicki M.C., Sornig M. & Henry J.P. 2002, Astron. J. 124, 2413.
Pettini et al. 2001, ApJ. 554, 981.
Pettini et al. 2002, ApJ. 569, 742.
Ponman T.J., Cannon D.B. & Navarro J.F. 1998, astro-ph/9810359.
Ponman T.J., Sanderson J.R. & Finogunenov A. 2003, MNRAS 343, 331.
Pratt et al. 2007, Astron. Astrophys. 461, 71.
O’shea B. et al. 2004, astro-ph/0403044.
Ouchi M. et al. 2004, astro-ph/0309655.
Rasia E. G. & Moscardini L. 2003, astro-ph/0309405.
Rephaeli Y. 1979, ApJ. 227, 364.
Rephaeli Y. & Salpeter 1980, ApJ. 240, 20.
Rephaeli Y., Gruber D. & Arieli Y. 2005, ApJ. , submitted.
Sand D.J. et al. 2002, ApJ. 574, 129.
Sanders J.S. et al. 2004, MNRAS 349, 952.
Schindler S. et al. 2005, astro-ph/0504068.
Sijacki D. & Springel V. 2006, MNRAS 366, 397.
Somerville R.S., Primack J.R. & Faber S.M. 2001, MNRAS 320, 504.
Spergel D.N. et.al. 2006, astro-ph/0603449.
Steidel C.C. et al. 1996, ApJ. 462, L17.
Strong A.W. & Mattox, J. R. 1996 Astron. Astrophys. 308, L21.
Strong A.W. & Moskalenko I.V. 1998, astro-ph/9807150.
Sun M. et al. 2009, ApJ. 693, 1142.
Syer D. & White S.D.M. 1998, MNRAS 293, 337.
Tornatore L. et al. 2007, MNRAS 382, 1050.
Torres D. 2004, astro-ph/0407240.
Tozzi P. & Norman C. 2001, ApJ. 546, 63.
Valageas P. & Silk J. 1999, Astron. Astrophys. 350, 725.
van den Bosh F.C. & Swaters R.A. 2001, MNRAS 325, 1017.
Voit G.M. 2005, Rev. Mod. Phys. 77, 207.
Wu X.P. & Xue Y.J. 2002, ApJ. 569, 112.
Zirakashvili, V. N., Breitschwerdt, D., Ptuskin, V. S. & Volk, H. J. 1996, Astron. Astrophys. 311, 113.
Zeldovich, Y. B. 1970, Astron. Astrophys. , 5, 84.