Structural behavior of PbyBi1.95-ySr1.49La0.4Cu1.15O6+δ for 0y0.53
Abstract
In the Bi cuprates, the presence of a near 15 superstructure is well known. Usually, this superstructure is suppressed by the substitution of lead, but there have been reports of a phase separation in so called and phases. This paper shows in high detail time how and why the phase separation develops and what happens to the quasi-15 superstructure upon lead substitution. For this purpose, the lanthanum- and lead-substituted single-layered superconductor Bi2+zSr2-zCuO6+δ has been investigated by scanning tunneling microscopy and low-energy electron diffraction. The La content was kept constant at slightly under-doped concentration while the Pb content was changed systematically. Thermodynamic considerations show that a phase mixture of and phases is inevitable.
pacs:
74.72.-h, 64.70.dg, 68.37.Ef, 61.05.jhI Introduction
For surface-sensitive experiments probing the high-temperature superconductivity of the hole-doped cuprates, single crystals of the bismuth cuprate family are the preferred choices because of the natural cleaving plane between two abreast van der Waals binded BiO layers. Preferentially used in experiments is the compound Bi2+zSr2-zCaCu2O8+δ (BISCO or Bi2212) with two CuO2 layers per unit cell. Since a strong interlayer interaction of next nearest CuO2 planes leads to split bands in this Bi2212 (see, e.g., Refs. Kordyuk et al. (2002) and Asensio et al. (2003)), other members of the family have come into the focus of research. Bi2+zSr2-zCuO6+δ (Bi2201) with only one CuO2 layer per unit cell is often regarded as the most ideal experimental manifestation of the single undisturbed CuO2 plane. By controlling the extra oxygen () and varying the amount of Bi in Sr positions (), the hole doping can be tuned around optimum doping. Furthermore unlike for Bi2212, nearly the whole range of hole dopings can be achieved due to substituting Sr by La: Bi2+zSr2-z-x LaxCuO6+δ (La-Bi2201).
Structurally the Bi cuprates are far from ideal crystals. Since they consist of alternating rocksalt and perovskite building blocks they are prone to superstructures which release the stress. For instance Bi2212 and La-Bi2201 exhibit a pronounced structural imperfection – an incommensurate superstructure in and directions. This superstructure is sometimes called “Bi-type superstructure” Zhiqiang et al. (1993), or is referred by its in-plane periodicity as the “near 15 superstructure”. For La-Bi2201, it can be shown that this superstructure can be monoclinic or orthorhombic Martovitsky et al. (2007) – depending on the La content. However, the question of the driving force for the superstructure in the Bi cuprates gave rise to basically two models, the “extra oxygen model” and the “misfit-model” (see, e.g., Refs. Zhiqiang et al. (1993) and Zhiqiang et al. (1997); Zandbergen et al. (1988, 1990)). Besides the strive for a structurally pure crystal, the suppression of this near 15 superstructure is highly desirable for other reasons. It has a periodicity around 27 Å, comparable to the in-plane superconducting coherence length of approximately 30 Å (see, e.g., Refs. Palstra et al. (1988) and Vedeneev et al. (1999)); and for experiments probing the reciprocal space, the superstructure hides intrinsic features. This attribute is exemplified in angular-resolved photoemission spectroscopy. Diffraction replica of the outgoing electrons are produced,Aebi et al. (1994); Ding et al. (1996) which mask the true electronic structure.
The suppression of the quasi-15 superstructure by substituting a certain fraction of Bi by Pb is a method often used for the Bi cuprates, leading to PbyBi2+z-ySr2-z-xLaxCuO6+δ [(Pb,La)-Bi2201], PbyBi2+z-ySr2-zCuO6+δ (Pb-Bi2201), and PbyBi2+z-ySr2-zCaCu2O8+δ (Pb-Bi2212). Besides the suppression of the superstructure, the substitution by Pb is also known to enhance , i.e. , from about 29 K for optimally doped La-Bi2201 to about 38 K for optimally doped (Pb,La)-Bi2201. However, examinations of Bi2201 (Ref. Zhiqiang et al. (1993)) and also La-Bi2201,Zhiqiang et al. (1997) showed that at intermediate Pb concentrations, a “Pb-type” superstructure replaces the quasi-15 superstructure. For the two-layer material Pb-Bi2212, it was reported Chong et al. (1997) that at a comparable intermediate Pb level, a phase separation in so-called and phases occurs. The phase was found to have high corrugation and to be Pb poor, whereas the phase was found to have low corrugation and to be Pb rich.Hiroi et al. (1998) Therefore, this topology was examined in Bi2-yPbySr2CaCu2O8+δ by using a focused electron beam (30 nm in diameter) which was produced by a high-resolution electron microscope. For the one-layer material Pb-Bi2201, a quite similar phase separation was recently shown.Nishizaki et al. (2007) The present study deals with well-characterized single crystals of a systematic series of the lead- and lanthanum-substituted single-layer (Pb,La)-Bi2201, where the Pb concentration was varied continuously between 0 and 0.53 f.u. The lanthanum content was kept constant. These crystals were probed by low energy-electron diffraction (LEED) and topographical scanning tunneling microscopy (STM). Hiroi et al. Hiroi et al. (1998) proposed a phase diagram for Pb-Bi2212 to describe the appearance of and phases upon varying the Pb content. It will be shown, that the one-layer (Pb,La)-Bi2201 probed here also shows intermediate phases and has a similar phase diagram. In this paper, the disappearance of the near 15 superstructure, the appearance of intermediate * and * phases, and of the final and phases are discussed in detail for (Pb,La=0.4)-Bi2201. Based on the results a general advanced phase diagram will be proposed.
II Experimental
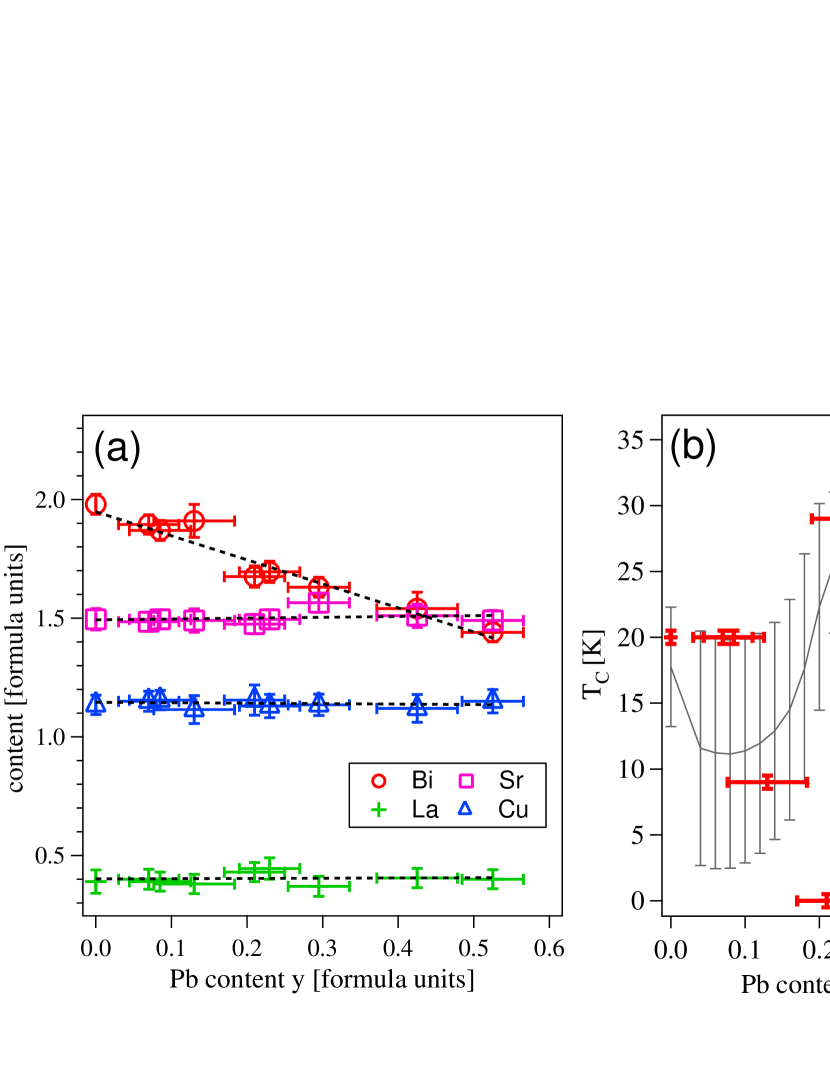
Single crystals of (Pb,La)-Bi2201 were grown using the flux method. For the flux, Bi is used in typical additional amounts of 10 % of the total Bi formula unit. The dependence between nominal and actual La composition is similar as in Yang et al.Yang et al. (1998) The starting mixture is composed of the oxides of Bi2O3, CuO, LaO, PbO, and the carbonate SrCO3, which are 99.98 % pure. To get a homogeneous mixture, the constituents were dissolved in ethanol and then ground. After this, it was calcined at 800∘C. For crystals containing lead, first the oxides Bi2O3, CuO, and the carbonate SrCO3 are mixed. After the calcination, LaO and PbO are added. Then, the composition is heated in a zirconium-oxide crucible above the liquidus temperature, which is, dependent on the exact composition, between 950 and 1050∘C. This temperature is maintained for 1 to 2 h to thermally homogenize the melt. After the homogenization, the system is cooled. In the temperature range roughly between 800 and 880 ∘C, the system is cooled gradually at a rate of 1–2 K/h to allow the formation of only a few crystallization nuclei. It is then rapidly cooled to room temperature (RT) with a typical rate between 10 and 20 K/h. After preparing single crystals out of the crucible, the crystals were characterized by ac-susceptibility measurements, to obtain the transition temperature , and energy dispersive x-ray analysis to determine the actual chemical composition. Figure 1(a) shows the obtained chemical composition dependent on the Pb content. By the line fits (dotted lines), the series can be described as PbyBi1.95-ySr1.49La0.4Cu1.15O. Figure 1(b) shows the dependent on the Pb content. The thick crosses indicate the individual samples, whereas the black line represents the average of many samples. Only for the sample with , does the differ significantly from the area spanned by the standard error of the averaged curve. Topological scanning tunneling microscopy was done using a systematic series of these crystals. All measurements were conducted at room temperature in ultra-high vacuum at a pressure of mbar immediately after cleavage in situ. The analysis of the surface structure was performed by a commercial Omicron STM (VT 25 SPM). The tips were either made from electrochemically etched tungsten wire or pinched-off PtIr wire.
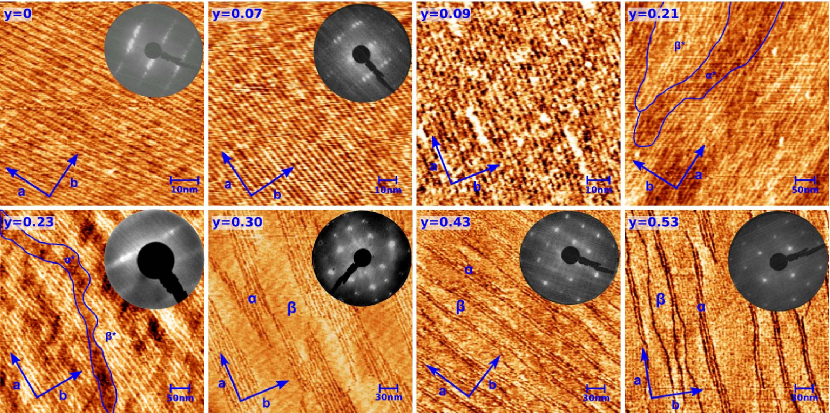
In the STM image for the Pb-free samples (Fig. 2, ), the quasi-15 superstructure is visible as a striped modulation. This can also be seen clearly by the extra spots in the LEED pattern. The substitution with y=0.07 f.u. leads to some brighter dots in the STM image. These brighter dots represent a higher unoccupied density of states and are oriented along the superstructure. With reference to other STM measurements for Pb-Bi2201 (Ref. Mashima et al. (2006)) and for Pb-Bi2212,Kinoda et al. (2003) it is assumed that these brighter dots are the substituted Pb atoms. The superstructure is present in the STM image and as well in the LEED picture. When slightly increasing the Pb substitution () the brighter dots, which were already visible in the sample, cluster along the present superstructure. These linear objects maximize their mutual separation which seemingly corresponds to the most energetically favorable position. In the STM image for a sample with Pb substitution of , the density of these linear objects is significantly increased compared to the sample with . It is remarkable that these objects themselves cluster, denoted as the * phase. The clustered objects are separated by a second phase, denoted here by *. This phase has a lower density of bright linear objects with washboard like appearance. Since the bright objects may represent ordered Pb atoms, the * phase is a low Pb phase, compared to the * phase. At substitution of , the linear objects within the * phase are more pronounced. The near 15 superstructure is still detectable by the blurred lines in the LEED pattern but weak. The sample with Pb content of shows smooth and bright areas without any linear structure. It is assumed that this phase is Pb rich, which is supported by a report of Hiroi et al.,Hiroi et al. (1998) where this topology was examined in Pb-Bi2212 by using a focused electron beam (30 nm in diameter) which was produced by a high-resolution electron microscope. Similar as in the report of Hiroi et al., beneath the flat phase, a second, washboard-like phase shows up. This phase consists of linearly ordered, equidistantly spaced bright objects. The extra spots in the LEED picture are gone, indicating that a quasi-15 superstructure is no longer detectable. Increasing the Pb substitution further to, e.g., or results in no new topological features. The STM image consists of the and the phase. The fraction of the phase decreases enhancing the fraction of the phase, when the proportion of Pb is increased. The near 15 superstructure remains absent in the LEED picture. Furthermore, the LEED spots get sharper and the incoherently scattered background between the spots is reduced.
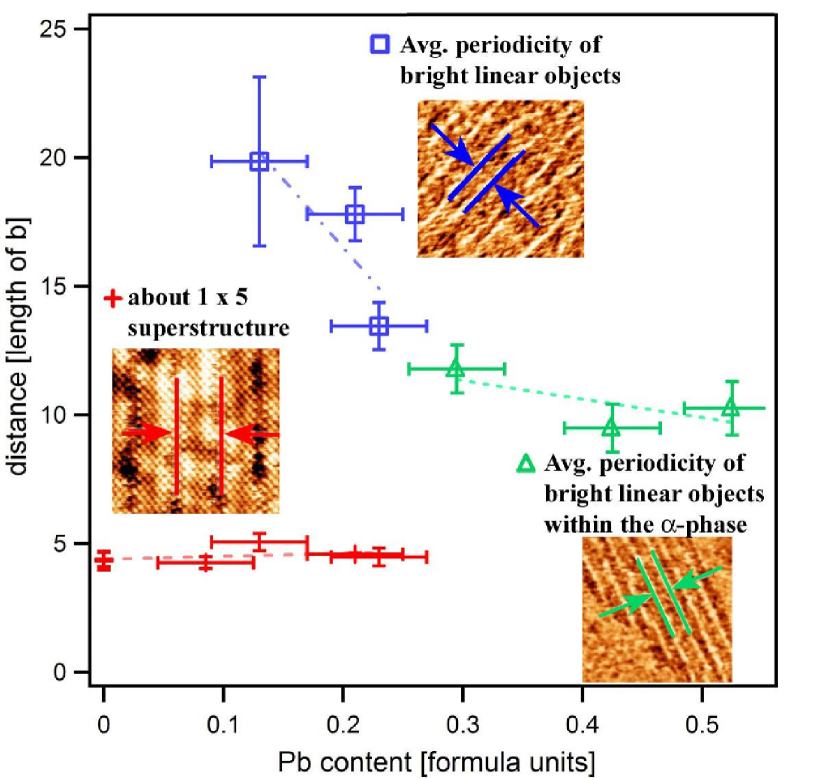
In Fig. 3, the quantitative analysis of the found distances by the (near 15) superstructure and the bright objects are shown. To do this the periodicity was averaged over many patterns. For computing the length in units relative to , the absolute length was divided by 5.4 Å. From this graph it is clear that the near 15 superstructure remains nearly constant and vanishes upon the appearance of the - and -phase separation. Please note that this is in contradiction to other results on Pb-Bi2201,Nishizaki et al. (2007) where the superstructure wavelength increases upon increasing the Pb level. Here, the distance between the bright objects reduces when increasing the Pb substitution level and its length scale seems to evolve into a constant value of quasi-110.
III Discussion
From the data, it is evident that a multitude of morphologies exist. Therefore, the most relevant mechanisms responsible for the morphologies, dependent on Pb substitution, need to be addressed. The ideal structure of Bi2201, as depicted in Fig. 4(a), can be seen as built from a perovskite block, containing the CuO6 octaeder and the Sr atoms, expanded in direction by a rocksalt component, built by the SrO and BiO layer. Three parameters affect the structural distortion in this system, these are the extra oxygen, the substituted lanthanum, and the misfit of the BiO plane to the perovskite block.
The extra oxygen and the lanthanum are dopant atoms, meaning that they change the binding conditions in the CuO2 plane. This is due to the Pauling-type contraction of the CuO binding, which decreases the planar binding length with increasing hole doping.Röhler (2005) It is worth noting that although the Pb substitution is changed, the hole doping is constant in the probed series. The hole concentration is given as at Pb content (Ref. Schneider et al. (2005)) while for Pb content it is ,Ariffin et al. (2009) where denotes the lanthanum content. This means that changing the Pb content from 0 to 0.4 f.u. at constant lanthanum of would result only in a marginal hole concentration difference of about 0.015 holes per Cu atom. By keeping the hole concentration approximately on the same level, the CuO bond length was kept constant. The perovskite block can therefore be regarded as static in the whole probed series and cannot be the reason for the change in morphology. Thus, the driving force in the change in morphology is suggested to be the mismatch of the (Bi,Pb)O layer and the static perovskite block.
Following this line of argument, the phase corresponds to the case, where the (Bi,Pb)O plane is perfectly adapted on the perovskite block. The STM patterns suggest that this adoption will occur at about 0.5 f.u. of Pb substitution. Upon increasing Pb substitution, the (Bi,Pb)O layer has its average size determined by the Pb to Bi ratio. Therefore, to account for the morphologies here, we can design a pseudo-binary phase diagram dependent on the Pb substitution . Similar morphologies in the two-layer material suggest that the diagram only needs to be slightly modified to account for Pb-Bi2212. The phase diagram is depicted in Fig. 4(b). The vertical axis marks the temperature and starts at room temperature. The Pb substitution level is on the horizontal axis.
At low Pb substitution, the denoted phase is present. This phase is the lead-free crystal with lanthanum substitution of 0.4, which exhibits the quasi-15 superstructure. It crystallizes at about 880∘C. The optimally adapted smooth phase is realized at around Pb content and crystallizes approximately at 830∘C. The shown phase diagram is further characterized by a eutectic or peritectic point. As the arrow implies, the exact position of this point is not certain. Further studies might be necessary to find its exact position. This uncertainty is of minor importance with regard to the morphology as seen in STM up to a Pb concentration of approximately . In principle, the optimally adapted phase could be peritectic as drawn or eutectic. Peritectic means here that the phase cannot be directly reached by cooling the melt. In the eutectic case, the critical point would be at the same Pb concentration as , which would mean that the phase can be reached directly by cooling from the melt. It should be noted that there is no phase in the diagram.
We begin with a crystallization process from the melt at point 1 in Fig. 4(c), corresponding to a low Pb concentration. Lowering the temperature at this composition splits the system at the liquidus into two phases: one part crystallizes in the phase [at point A in Fig. 4(c)] whereas the rest of the system follows the liquidus toward the eutectic point. A gradual reduction in the temperature will enable the phase to grow at the cost of the melt. This growth can continue until point C is reached and the concentration in is identical to the starting composition (point B). Lowering the temperature further leaves the system stable within the phase until point D is reached. At this point, the phase decomposes from the phase. Because the system is strongly supercooled [ in Fig. 4(c)], the decomposition of the phase will be sudden. The Pb atoms crystallize at local inhomogeneities (see, and 0.09 in Fig. 2). These local inhomogeneities are, for example, given by the superstructure. Therefore, in the STM images bright spots are visible, which are located near the superstructure.
Increasing the starting Pb concentration (point 2) will increase the amount of condensed Pb near the superstructure. As composition 2 is reached, the phase can be stabilized without supercooling. But the stabilization without supercooling will only be possible under adiabatic conditions. Two topologies will be typically formed (see and in Fig. 2). One topology is the very locally stabilized phase (* phase) and the other topology is quite similar to the washboard like structure from supercooling (* phase). The existence of large quantities of the phase is dependent on the cooling rate and the Pb level. The lower threshold for the occurrence of large fractions of the phase in the crystals is at around for the applied growth conditions (see in Fig. 2). At this composition, the character of the phase becomes clear. The phase is a phase mixture produced by the part of the system which crystallizes at point into the phase and decomposes upon cooling further in and phases. This explanation of the phase as a phase mixture is quite interesting, as it means that in a sample at any lead concentration between and , two (metastable) phase mixtures develop.
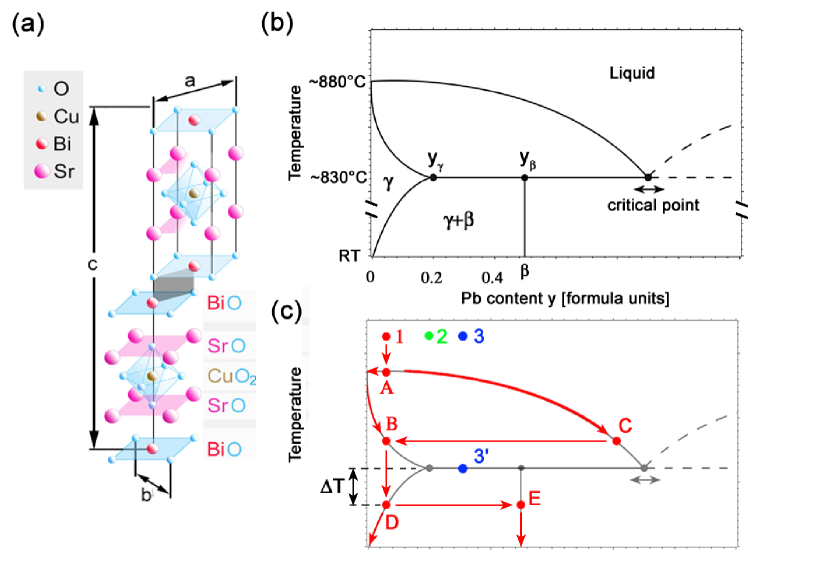
From point 3’ in Fig. 4(c) on the eutectic line, which is reached from point 3 by cooling, the Pb-rich phase grows until point yβ, where upon cooling the pure phase crystallizes. All material not crystallizing in this way moves from point 3’ to the left along the eutectic line to the point and further upon cooling to RT along the phase boundary. The excess Pb not used in crystallization along the first way determines the fraction of phase in the phase forming the pseudo-phase . The decomposition between and makes and phases align themselves perpendicular to the growth direction (see also Ref.,Hiroi et al. (1998)), which is for Bi2201 in the direction. The washboard-like structure in the -phase mixture should order at local inhomogeneities, present in the already crystallized phase.
From this explanation of the observed morphologies by general thermodynamic interpretations, clear conclusions can be drawn. First of all, a multitude of topological morphologies due to lead substitution will occur for any crystal-growth method, e.g., for the flux method, as in our case, but also for the traveling solvent floating-zone method (see, e.g., Ref. Nishizaki et al. (2007)). Furthermore, as already reported by Hiroi et al.,Hiroi et al. (1998) a quite similar phase diagram leads to similar morphologies for the double CuO2-layered Pb-Bi2212. In other words, in most conventional cases, up to the Pb level examined here, the occurrence of a minority washboard-like phase cannot be avoided in Pb-substituted bismuth cuprates.
The large average spacing between the -phase regions leads to short reciprocal vectors in the direction. For a Pb concentration of 0.4, for instance, it is 132 (Ref. Dudy et al. (2007)) but this of course varies with the amount of lead and with the cooling rate. As shown in Fig. 3, the bright linear objects forming the washboard-like structure within the phase converge to an average distance of about 10b for high Pb concentrations of around 0.4. It can be suggested that these distances represent the so-called additional Pb-type modulation, visible in electron-diffraction experiments by Zhiqiang et al. Zhiqiang et al. (1993, 1997) Its oscillation strength reduces considerably with increasing Pb content, as the phase becomes the minority phase with only few linear objects within a typical -phase area.
We should now discuss how the above-mentioned modulations influence the LEED pictures. While in Fig. 2 for and , the quasi-15 shows up as clear, separated spots in LEED, for the disturbed morphology leads to a diffuse LEED pattern along the direction. For and , the fundamental reflexes are of dominating intensity. The diffuse intensity between these main spots is ascribable to the short-scaled reciprocal vectors from the - phase separation, which is not individually resolvable anymore. For , the spots are sharp and the diffused part is minimized although the alpha phase is still present. This can be understood as follows: the phase only occupies a small fraction of the surface and the number of bright linear objects in it is just between one and three, giving therefore low oscillation strength from the 110 periodicity. Also, the spacing between the -phase regions is beyond 132 yielding reciprocal vectors and outside the coherence length of the LEED experiment. However, other experiments probing the reciprocal space, e.g., angle resolved photoemission, could be influenced by these structural details.
In addition, it is reasonable to suggest that the superconducting properties are affected by highly inhomogeneous samples. This structural impurity might therefore be the reason for the discontinuity of the superconducting temperature between 0 and 0.3 f.u. of lead (see Fig. 1). In this region, a mixture of different crystalline phases exists which are highly inhomogeneous (as can be seen in Fig. 2, , 0.21, and 0.23). This disturbed transition phase of the crystal might have an influence on the formation of Cooper pairs in the CuO2 layer since any structure shorter than the coherence length is detrimental.
IV Conclusion
We have studied in detail the morphology of PbyBi1.95-ySr1.49La0.4Cu1.15O6+δ for by LEED and STM. Upon increasing the Pb substitution, the well-known quasi-15 superstructure vanishes and other phases occur. Above , a flat Pb-rich phase and a washboard-like phase are formed. Their formation can be clearly traced back to thermodynamic origins and can therefore be regarded as inevitable for Pb-substituted Bi cuprates, independent of the growth method. The - and -phase related features do not show up as expected in LEED for high Pb content. It is shown that based on the STM results this LEED picture is not sufficient for claiming structural purity or complete superstructure suppression.
Acknowledgements.
We gratefully acknowledge the assistance of H. Dwelk and S. Rogaschewski in the characterization of the crystals. We thank V.P. Martovitsky for stimulating discussions. We thank Z. Galazka and C. Ó Coileáin for critical reading of the manuscript. For processing the STM data, we used the WSXM software package (Ref. Horcas et al. (2007)).References
- Kordyuk et al. (2002) A. A. Kordyuk, S. V. Borisenko, T. K. Kim, K. A. Nenkov, M. Knupfer, J. Fink, M. S. Golden, H. Berger, and R. Follath, Phys. Rev. Lett. 89, 077003 (2002).
- Asensio et al. (2003) M. C. Asensio, J. Avila, L. Roca, A. Tejeda, G. D. Gu, M. Lindroos, R. S. Markiewicz, and A. Bansil, Phys. Rev. B 67, 014519 (2003).
- Zhiqiang et al. (1993) M. Zhiqiang, F. Chenggao, S. Lei, Y. Zhen, Y. Li, W. Yu, and Z. Yuheng, Phys. Rev. B 47, 14467 (1993).
- Martovitsky et al. (2007) V. P. Martovitsky, A. Krapf, and L. Dudy, JETP Lett. 85, 292 (2007).
- Zhiqiang et al. (1997) M. Zhiqiang, X. Gaojie, Z. Shuyuan, T. Shun, L. Bin, T. Mingliang, F. Chenggao, X. Cunyi, and Z. Yuheng, Phys. Rev. B 55, 9130 (1997).
- Zandbergen et al. (1988) H. Zandbergen, W. Groen, F. Mijlhoff, G. van Tendeloo, and S. Amelinckx, Physica C 156, 325 (1988).
- Zandbergen et al. (1990) H. Zandbergen, W. Groen, A. Smit, and G. van Tendeloo, Physica C 168, 426 (1990).
- Palstra et al. (1988) T. T. M. Palstra, B. Batlogg, L. F. Schneemeyer, R. B. van Dover, and J. V. Waszczak, Phys. Rev. B 38, 5102 (1988).
- Vedeneev et al. (1999) S. I. Vedeneev, A. G. M. Jansen, E. Haanappel, and P. Wyder, Phys. Rev. B 60, 12467 (1999).
- Aebi et al. (1994) P. Aebi, J. Osterwalder, P. Schwaller, L. Schlapbach, M. Shimoda, T. Mochiku, and K. Kadowaki, Phys. Rev. Lett. 72, 2757 (1994).
- Ding et al. (1996) H. Ding, A. F. Bellman, J. C. Campuzano, M. Randeria, M. R. Norman, T. Yokoya, T. Takahashi, H. Katayama-Yoshida, T. Mochiku, K. Kadowaki, G. Jennings, and G. P. Brivio, Phys. Rev. Lett. 76, 1533 (1996).
- Chong et al. (1997) I. Chong, Z. Hiroi, M. Izumi, J. Shimoyama, Y. Nakayama, K. Kishio, T. Terashima, Y. Bando, and M. Takano, Science 276, 770 (1997).
- Hiroi et al. (1998) Z. Hiroi, I. Chong, and M. Takano, J. Solid State Chem. 138, 98 (1998).
- Nishizaki et al. (2007) T. Nishizaki, K. Kudo, N. Okumura, and N. Kobayashi, Physica C 460-462, 156 (2007).
- Yang et al. (1998) W. L. Yang, H. H. Wen, Y. M. Ni, J. W. Xiong, H. Chen, C. Dong, F. Wu, Y. L. Qin, and Z. X. Zhao, Physica C 308, 294 (1998).
- Mashima et al. (2006) H. Mashima, N. Fukuo, Y. Matsumoto, G. Kinoda, T. Kondo, H. Ikuta, T. Hitosugi, and T. Hasegawa, Phys. Rev. B 73, 060502 (2006).
- Kinoda et al. (2003) G. Kinoda, T. Hasegawa, S. Nakao, T. Hanaguri, K. Kitazawa, K. Shimizu, J. Shimoyama, and K. Kishio, Phys. Rev. B 67, 224509 (2003).
- Röhler (2005) J. Röhler, Int. J. Mod. Phys. B 19, 255 (2005).
- Schneider et al. (2005) M. Schneider, R.-S. Unger, R. Mitdank, R. Müller, A. Krapf, S. Rogaschewski, H. Dwelk, C. Janowitz, and R. Manzke, Phys. Rev. B 72, 014504 (2005).
- Ariffin et al. (2009) A. K. Ariffin, C. Janowitz, B. Müller, L. Dudy, P. Sippel, R. Mitdank, H. Dwelk, A. Krapf, and R. Manzke, J. Phys.: Conf. Ser. 150, 052084 (2009).
- Dudy et al. (2007) L. Dudy, B. Müller, B. Ziegler, A. Krapf, H. Dwelk, O. Lübben, R.-P. Blum, V. Martovitsky, C. Janowitz, and R. Manzke, Solid State Commun. 143, 442 (2007).
- Horcas et al. (2007) I. Horcas, R. Fernández, J. M. Gómez-Rodríguez, J. Colchero, J. Gómez-Herrero, and A. M. Baro, Rev. Sci. Instrum. 78, 013705 (2007).