Uncertainties in the p-process: supernova dynamics versus nuclear physics
Abstract
We examine how the uncertainties involved in supernova dynamics as well as in nuclear data inputs affect the p-process in the neutrino-driven winds. For the supernova dynamics, we find that the wind termination by the preceding dense ejecta shell, as well as the electron fraction (; at K) play a crucial role. A wind termination within the temperature range of K greatly enhances the efficiency of the p-process. This implies that the early wind phase, when the innermost layer of the preceding supernova ejecta is still km from the center, is most relevant to the p-process. The outflows with result in the production of the p-nuclei up to with interesting amounts. Furthermore, the p-nuclei up to can be produced if is achieved. For the nuclear data inputs, we test the sensitivity to the rates relevant to the breakout from the pp-chain region (), to the rates on heavy nuclei, and to the nuclear masses along the p-process pathway. We find that a small variation of the rates of triple- and of the reaction on 56Ni leads to a substantial change in the p-nuclei production. We also find that 96Pd () on the p-process path plays a role as a second seed nucleus for the production of heavier p-nuclei. The uncertainty in the nuclear mass of 82Zr can lead to a factor of two reduction in the abundance of the p-isotope 84Sr.
Subject headings:
nuclear reactions, nucleosynthesis, abundances — stars: abundances — stars: neutron — supernovae: general1. Introduction
The astrophysical origin of the proton-rich isotopes of heavy elements (p-nuclei) is not fully understood. The most successful model to date, the photo-dissociation of pre-existing neutron-rich isotopes (-process) in the oxygen-neon layer of core-collapse supernovae (or in their pre-collapse stages), cannot explain the production of some light p-nuclei including 92,94Mo and 96,98Ru (Woosley & Howard, 1978; Prantzos et al., 1990; Rayet et al., 1995; Rauscher et al., 2002; Hayakawa et al., 2008). The recent discovery of a new nucleosynthetic process, the p-process, has dramatically changed this difficult situation (Fröhlich et al., 2006a, b; Pruet et al., 2006; Wanajo, 2006). In the early neutrino-driven winds of core-collapse supernovae, capture on free protons gives rise to a tiny amount of free neutrons in the proton-rich matter. These neutrons induce the reactions on the -waiting point nuclei along the classical rp-process path (64Ge, 68Se, and 72Kr), which bypass these nuclei (with the -decay half-lives of 1.06 min, 35.5 s, and 17.1 s, respectively). Wanajo (2006) has shown that the p-nuclei up to , including 92,94Mo and 96,98Ru, can be produced by the p-process in the neutrino-driven winds within reasonable ranges of the model parameters.
All the recent hydrodynamic studies of core-collapse supernovae with neutrino transport taken into account suggest that the bulk of early supernova ejecta is proton rich (Janka, Buras, & Rampp, 2003; Liebendörfer et al., 2003; Buras et al., 2006; Kitaura, Janka, & Hillebrandt, 2006; Fischer et al., 2010; Hüdepohl et al., 2010). This supports the p-process taking place in the neutrino-driven winds of core-collapse supernovae. However, different works end up with somewhat different outcomes. Fröhlich et al. (2006a) showed that the p-nuclei up to were produced with the one-dimensional, artificially induced explosion model of a star, while Pruet et al. (2006) obtained up to with the two-dimensional, artificially induced explosion model of a star. On the contrary, Wanajo et al. (2009, also S. Wanajo et al., in preparation) found negligible contribution of the p-process to the production of p-nuclei with the one-dimensional, self-consistently exploding model of a star (electron-capture supernova, Kitaura, Janka, & Hillebrandt, 2006; Hüdepohl et al., 2010). These diverse outcomes indicate that the p-process is highly sensitive to the physical conditions of neutrino-driven winds.
Besides the supernova conditions, there could be also uncertainties in some key nuclear rates, in particular of reactions, because no attention was paid to neutron capture reactions on proton-rich nuclei before the discovery of the p-process. Uncertainties in some reactions relevant to the breakout from the pp-chain region (), which affect the proton-to-seed ratio at the onset of p-processing, might also influence the nucleosynthetic outcomes. There are still a number of isotopes without experimental nuclear masses on the p-process pathway (Weber et al., 2008).
Our goal in this paper is to examine how the variations of supernova conditions as well as of nuclear data inputs influence the global trend of the p-process. The paper is organized as follows. In § 2, a basic picture of the p-process is outlined. A semi-analytic neutrino-driven wind model and an up-to-date reaction network code are described, which are used in this study (§ 3). We take the wind-termination radius (or temperature), the neutrino luminosity, the neutron-star mass, and the electron fraction as the key parameters of supernova conditions (§ 4). In previous studies (Fröhlich et al., 2006a, b; Pruet et al., 2006; Wanajo, 2006), some of these parameters were varied to test their sensitivities, but only for limited cases. In particular, the effect of wind termination has not been discussed at all in previous studies. As the key nuclear reactions, we take triple-, 7BeC, 10BC (all relevant to the breakout from the pp-chain region), and the reactions on 56Ni, 60Zn, and 64Ge (§ 5). Sensitivities of the masses of the nuclei along the p-process path are also discussed. We then discuss the possible role of the p-process as the astrophysical origin of the p-nuclei (§ 6). A summary of our results follows in § 7.
2. Basic Picture of the p-Process
The “p-process” was first identified in Fröhlich et al. (2006a), and the term was introduced by Fröhlich et al. (2006b) and is synonymous with the “neutrino-induced rp-process” in the subsequent works (Pruet et al., 2006; Wanajo, 2006). This is a similar process to the classical rp-process first proposed by Wallace & Woosley (1981). The p-process is, however, essentially a new nucleosynthetic process exhibiting a number of different aspects compared to the classical rp-process. The p-process starts with the seed nucleus 56Ni (not 64Ge, the first -waiting-point nucleus in the classical rp-process pathway), assembled from free nucleons in nuclear quasi-equilibrium (QSE) during the initial high temperature phase (; where is the temperature in units of K). The p-process is therefore a primary process, which needs no pre-existing seeds. When the temperature decreases below (defined as the onset of a p-process in this study) and QSE freezes out, the p-process starts.
Neutrino capture on free protons, , in a proton-rich neutrino-driven wind gives rise to a tiny amount of free neutrons ( in mass fraction). These neutrons immediately induce the exchange reaction, , and in part radiative neutron capture, , on the seed nucleus 56Ni and subsequent heavier nuclei with decay timescales of a few ms, well below the expansion timescale of the wind and well below the -decay lifetimes of these nuclei. The nuclear flow proceeds with combination of radiative proton captures, , and neutron captures, the latter replacing the role of -decays in the classical rp-process.
A large number of free protons relative to that of 56Ni at , which allows for neutron capture on the seed nuclei, is required to initiate the p-process. High entropy and short expansion timescale of the ejecta make the triple- process, bridging from light () to heavy () nuclei, less effective and help to leave a large number of free protons at the onset of the p-process. It should be noted, however, that proton-rich matter freezing out from nuclear statistical equilibrium (NSE) mainly consists of 56Ni and free protons (Seitenzahl et al., 2008). This is a fundamental difference from a (moderately) neutron-rich NSE, where no free neutrons exist at freezeout. This makes the requirements for entropy and expansion timescale less crucial, compared to the case of r-process, allowing for the p-process taking place with typical wind conditions (Fröhlich et al., 2006a; Pruet et al., 2006; Wanajo, 2006).
Unlike the r-process, the p-process is not terminated by the exhaustion of free protons, but by the temperature decrease below (defined as the end of a p-process), where proton capture slows due to the Coulomb barrier. The end of p-processing is thus a proton-rich freezeout. For this reason, the proton-to-seed ratio, (the number per nucleon for free protons divided by that for nuclei with ) at does not necessary serve as a useful guide for the strength of the p-process as the neutron-to-seed ratios are in the case of the r-process. Rather, the number ratio of free neutrons created by (for ) relative to the seed nuclei (at ), , can be a useful (but still crude) measure for the p-process as proposed by Pruet et al. (2006). Note that each neutron capture by is immediately followed by one or two radiative proton captures, increasing the atomic masses by one or two units. Similar to eq. (2) in Pruet et al. (2006), we define
| (1) |
where (equal to the mass fraction of free protons, ) and are the values at . The net number of captured per free proton for , , is defined as
| (2) |
where is the rate for . The seed, a double magic nucleus 56Ni, remains the most abundant heavy nucleus throughout the p-process. Therefore, only a fraction of 56Ni is consumed for the production of heavier nuclei. For this reason, is enough for the production of nuclei with , as we will see in the subsequent sections.
The p-process flow passes through the even-even nuclei up to and gradually deviates toward the region. As the flow proceeds toward higher nuclei, and as the temperature decreases, competes with , owing to the latter having a Coulomb barrier in its exit channel. When is large enough, the flow eventually approaches the -stability line, and even crosses into the neutron-rich region. The latter happens when the net number of captured per free proton after the p-process, defined as
| (3) |
is not negligible compared to . The end point of the p-process is thus determined by the supernova dynamics, which enters into Eq. (3) through ( is the radius from the center), rather than by the nature of nuclear physics as in case of the classical rp-process.
3. Neutrino-Driven Wind Model and Reaction Network
The thermodynamic trajectories of neutrino-driven outflows are obtained using a semi-analytic, spherically symmetric, general relativistic model of neutrino-driven winds. This model has been developed in previous r-process (Wanajo et al., 2001; Wanajo, 2007) and p-process (Wanajo, 2006) studies. Here, we describe several modifications added to the previous version.
The equation of state for ions (ideal gas) and arbitrarily degenerate, arbitrarily relativistic electrons and positrons is taken from Timmes & Swesty (2000). The root-mean-square averaged energies of neutrinos are taken to be 12, 14, and 14 MeV, for electron, anti-electron, and the other types of neutrinos, respectively, in light of a recent self-consistently exploding model of a star (Kitaura, Janka, & Hillebrandt, 2006; Hüdepohl et al., 2010; Müller, Janka, & Dimmelmeier, 2010). These values are consistent with other recent studies for more massive progenitors (Fischer et al., 2010), but substantially smaller than those taken in previous works (e.g., 12, 22, and 34 MeV in Wanajo et al., 2001). The mass ejection rate at the neutrino sphere is determined such that the outflow becomes supersonic (i.e., wind) through the sonic point.
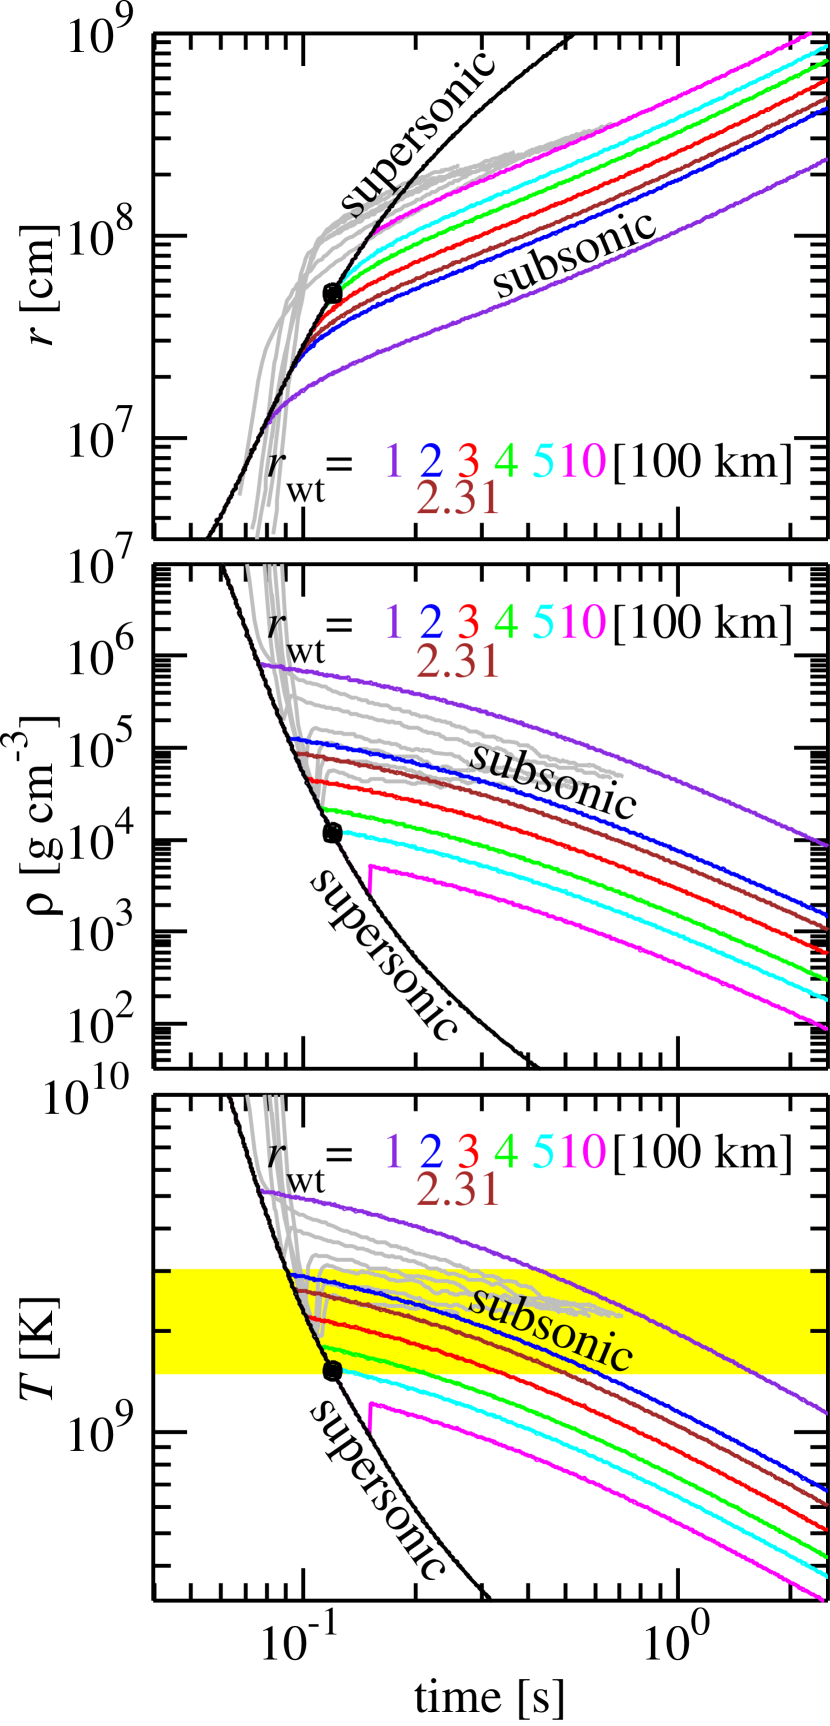
The neutron star mass is taken to be for our standard model. The radius of the neutrino sphere is assumed to be as a function of the neutrino luminosity (taken to be the same for all the flavors), where , , and . This roughly mimics the evolution of in recent hydrodynamic simulations (e.g., Buras et al., 2006; Arcones et al., 2007). The wind solution is obtained with ( km) for the standard model. The time variations of radius from the center, density , and temperature for the standard model are shown in Figure 1 (black line).
The time variations of , , and after the wind-termination by the preceding supernova ejecta are calculated as follows. This phase is governed by the evolution of the preceding slowly outgoing ejecta, independent of the wind solution. In light of recent hydrodynamical calculations (e.g., Arcones et al., 2007), we assume the time evolution of the outgoing ejecta to be and , where is the post-bounce time. With these relations, we have
| (4) | |||||
| (5) | |||||
| (6) | |||||
| (7) |
for , where , , , , and are the time, velocity, radius, density, and temperature, respectively, just after the wind-termination. Equation (7) represents the time variation of velocity after the wind-termination. In case that is larger than that at the sonic point, , the Rankine-Hugoniot shock-jump conditions are applied at to obtain , , and (see, e.g., Arcones et al., 2007; Kuroda, Wanajo, & Nomoto, 2008). Equations (6) and (7) are obtained from equation (4) with the steady-state condition, i.e., constant (see Panov & Janka, 2009). Note that equations (6) and (7) gives and for . In order to obtain in equations (4)-(7) for a given trajectory with , the time evolution of at the neutrino sphere is assumed to be , where s (Wanajo, 2006). With this relation, the post-bounce time is determined to be , where is the local time in each wind trajectory ( at the neutrino sphere). The curves for various as a function of obtained from equations (4)-(6) are shown in Figure 1.
The wind trajectories from a hydrodynamical result by Buras et al. (2006, s after bounce, gray lines), used in Pruet et al. (2006), are compared with our models. Their wind trajectories were obtained by mapping the two-dimensional model of an exploding star to a one-dimensional grid at s after bounce. In Figure 1, the time coordinate for each trajectory is shifted to roughly match the one of our models. We find that their model also exhibits a wind termination at km. The temperature and density histories are, however, close to our models with km. This is due to their higher neutrino luminosity ( erg s-1) during the relevant core-bounce time, a factor of two higher than assumed in our models shown in Figure 1. This leads to a larger radius for a given wind temperature (see § 4.2 and Table 1).
The nucleosynthetic abundances in the neutrino-driven outflows are calculated in a post-processing step by solving an extensive nuclear reaction network code. The network consists of 6300 species between the proton- and neutron-drip lines predicted by the recent fully microscopic mass formula (HFB-9, Goriely et al., 2005), all the way from single neutrons and protons up to the isotopes. All relevant reactions, i.e. , , , , , , and their inverses are included. The experimental data, whenever available, and the theoretical predictions for light nuclei () are taken from the REACLIB111http://nucastro.org/reaclib.html. compilation. All the other reaction rates are taken from the Hauser-Feshbach rates of BRUSLIB 222http://www.astro.ulb.ac.be/Html/bruslib.html. (Aikawa et al., 2005) making use of experimental masses (Audi, Wapstra, & Thibault, 2003) whenever available or the HFB-9 mass predictions (Goriely et al., 2005) otherwise. The photodisintegration rates are deduced from the reverse rates applying the reciprocity theorem with the nuclear masses considered.
The -decay rates are taken from the gross theory predictions (GT2; Tachibana, Yamada, & Yoshida, 1990) obtained with the HFB-9 predictions (T. Tachibana 2005, private communication). Electron capture reactions on free nucleons and on heavy nuclei (Fuller, Fowler, & Newman, 1982; Langanke & Martinez-Pinedo, 2001) as well as rates for neutrino capture on free nucleons and 4He and for neutrino spallation of free nucleons from 4He (Woosley et al., 1990; McLaughlin, Fuller, & Wilson, 1996) are also included. Neutrino-induced reactions of heavy nuclei are not taken into account in this study, which are expected to make only minor effects in this study.
Each nucleosynthesis calculation is initiated when the temperature decreases to , at which only free nucleons exist. The initial compositions are then given by the electron fraction (proton-to-baryon ratio) at , such as and for the mass fractions of free protons and neutrons, respectively.
4. Uncertainties in Supernova Dynamics
In the following subsections, we examine how the nucleosynthesis of the p-process is influenced by varying the wind-termination radius (or temperature; § 4.1), (§ 4.2), (§ 4.3), and (§ 4.4) from their fiducial values 300 km (or K), , , and 0.600, respectively, of our standard model (1st line in Table 1). These values are taken as those expected in the early wind phase of core-collapse supernovae. All the explored models and their major outcomes are summarized in Table 1 (the first 4 columns represent the input parameters).
4.1. Wind-termination Radius
Recent hydrodynamic studies of core-collapse supernovae have shown that the neutrino-driven outflows develop to be supersonic, which abruptly decelerate by the reverse shock from the outer layers (e.g., Janka & Müller, 1995, 1996; Burrows et al., 1995; Buras et al., 2006). Arcones et al. (2007) have explored the effects of the reverse shock on the properties of neutrino-driven winds by one-dimensional, long-term hydrodynamic simulations of core-collapse supernovae. Their result shows that, in all of their models ( progenitors), the outflows become supersonic and form the termination shock when colliding with the slower preceding supernova ejecta. This condition continues until the end of their computations (10 seconds after core bounce) in their all of “standard” models with reasonable parameter choices. A recent self-consistently exploding model of a star also shows qualitatively the same result (Hüdepohl et al., 2010).
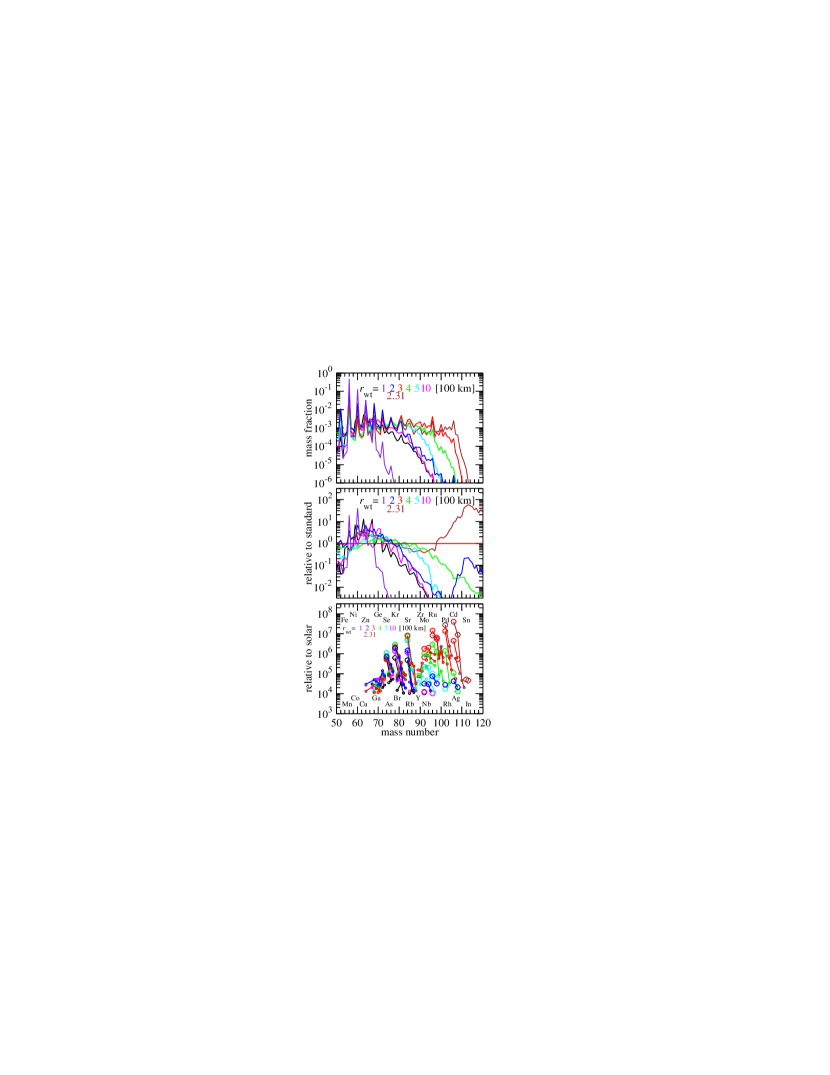
In this subsection, we explore the effect of the wind-termination on the p-process. The termination point is located at , 200, 231, 300 (standard model), 400, 500, and 1000 km on the transonic wind trajectory (black line) shown in Figure 1 (top panel). The other parameters , , and are kept to be the fiducial values (Table 1; 2nd to 9th lines). In Figure 1 (middle and bottom panels), we find shock-jumps of density and temperature by wind termination only for the km case, since the termination points are placed below the sonic radius ( km; Figure 1, top panel) for the other cases.333The outflows with are subsonic all the way. This happens in the early wind phase when the slowly outgoing ejecta is still close to the core (Arcones et al., 2007). In this case, however, the mass ejection rate from the core is expected to be close to that of the transonic solution (with the maximum ). Thus, the time variations of , , and may not be substantially different from those of the transonic case for (see, e.g., Otsuki et al., 2000). We take, therefore, the transonic solution for all the cases, rather than the subsonic solution by introducing an additional free parameter .
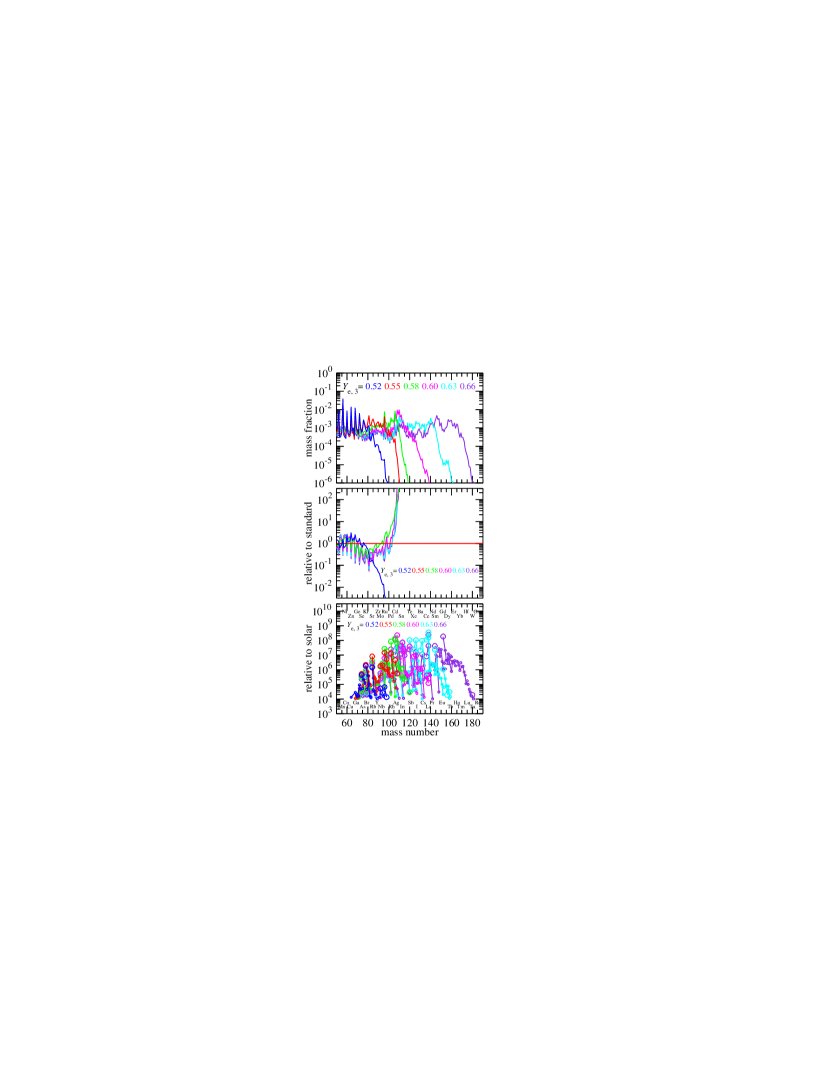
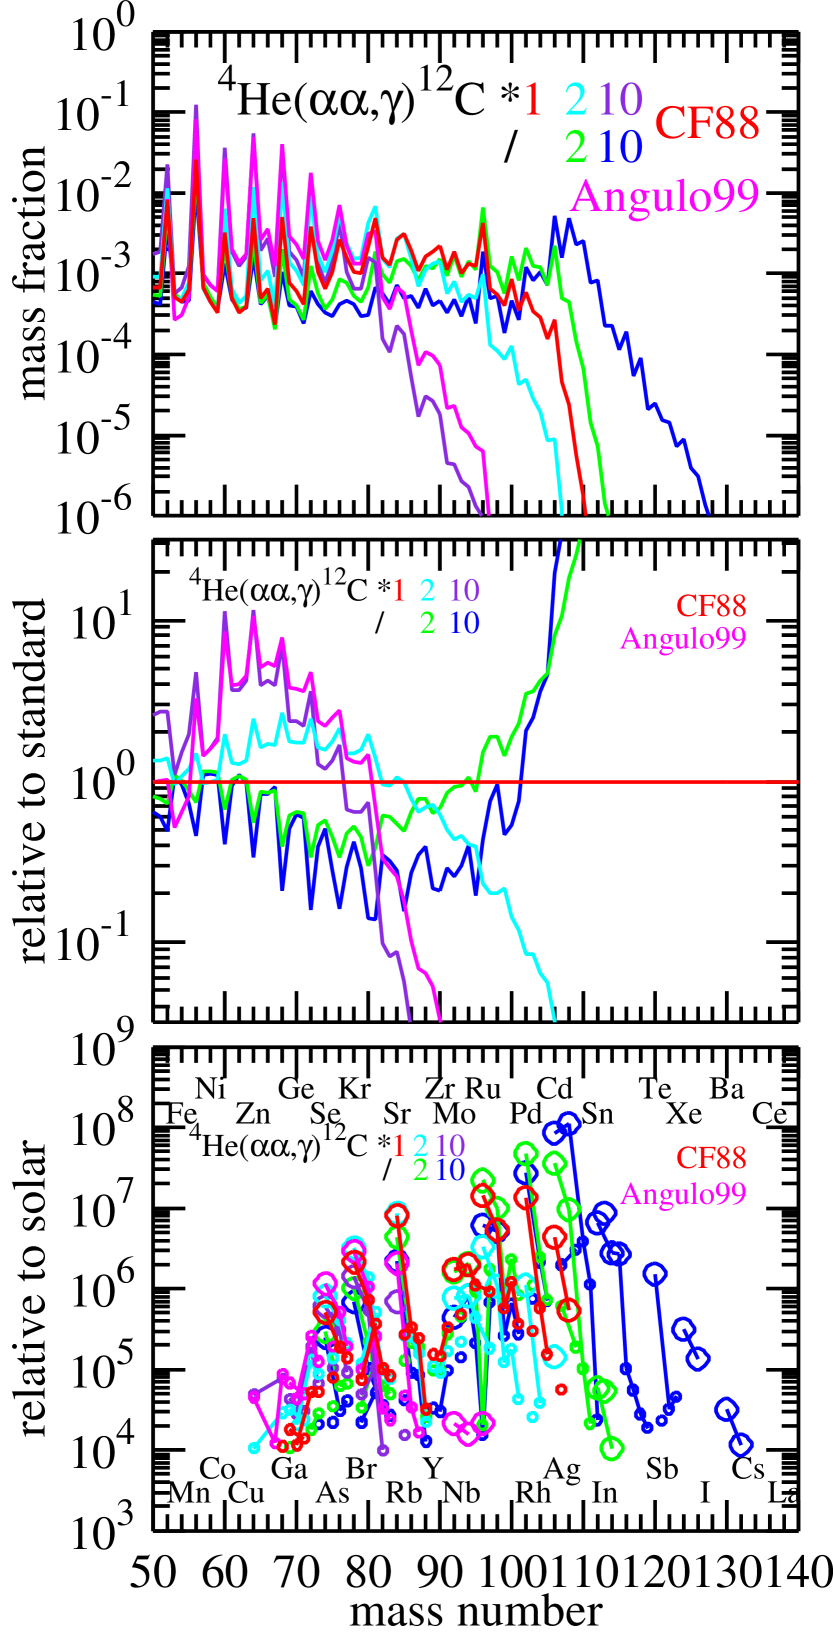
The result of nucleosynthesis calculations is shown in Figure 2. The top panel shows the mass fractions, , of nuclei as a function of atomic mass number, . We find that the case with km has the maximum efficiency of producing nuclei with (including our calculations not shown here). The middle and bottom panels show, respectively, the mass fractions relative to the standard model () and to their solar values (Lodders, 2003), i.e., the production factor ( for -th isotope), as a function of . We find a noticeable effect of wind termination on the p-process; the production of p-nuclei between and 110 is outstanding for the cases with and 300 km (standard model).
It should be noted that the asymptotic entropy ( per nucleon in units of the Boltzmann constant ; Table 1) is the same for all the cases here (except for km owing to the termination-shock heating). These different outcomes can be explained by the different values of (, 13th column in Table 1), defined by equation (1), owing to the different expansion timescales after wind termination. As indicated by the yellow band in Figure 1 (bottom panel), we find substantial differences in the temperature histories before or during the p-process phase (defined as ).
We define two expansion timescales and (7th and 8th columns in Table 1); the former is the time elapsed from to and the latter from to . These represent the durations of the seed production and of the p-process, respectively. As can be seen in Figure 1 (bottom panel), ( ms) and thus the proton-to-seed ratio () at are the same except for the case with km. Nevertheless, the different values of and thus (see equation (1)) lead to the different efficiencies of the p-process. We find that is needed for an efficient production of p-nuclei with . This requires the wind-termination at (in units of K) to obtain (equation (2)). For the standard model ( km and ), the maximum production factor ( in Table 1) is obtained at 96Ru ( in Table 1), a daughter nucleus of 96Pd () on the p-process pathway. We have the optimal production ( at 106Cd) with when the termination point is set to km.
In Table 1, the nuclide with the largest mass number with is also shown (e.g., 106Cd for the standard model; in Table 1), which is taken to be the largest of the p-nuclei synthesized by the p-process. Given that our standard model represents a typical supernova condition, this implies that the p-process can be the source of the solar p-abundances up to (see § 6 for more detail). However, this favorable condition is not robust against a variation of (and thus ); the outflows with km ()444Despite the largest () among the various models, the km model ends up with inefficient p-processing. This is due to defined for (equation (1)), while the maximal efficiency of p-processing is obtained with in this case. and km () end up with (84Sr; Table 1). Note that the outflow with km leads to a similar result as that without wind termination (black line in Figure 2; in Table 1). This indicates that the role of wind termination is unimportant for .
We find no substantial p-processing for the outflow with km (Figure 2). This is due to the substantially smaller at the beginning of the p-process (), (only slightly proton-rich), than those for the other cases (0.550; Table 1). As a result, at is only 1.78, resulting in a small () in spite of the largest among the various models presented here. It should be noted that is always lower than ( in the present cases). This is due to a couple of neutrino effects. One is that the asymptotic equilibrium value of in the non-degenerate matter consisting of free nucleons, which is subject to neutrino capture, is (see, e.g., Qian & Woosley, 1996) with the neutrino luminosities and energies taken in this study. Hence, the value starts relaxing from toward as soon as the calculation initiates. The other effect is due to the continuous -particle formation () from inter-converting free protons and free neutrons that is subject to neutrino capture, which drives towards 0.5 (“-effect”, Meyer, McLaughlin, & Fuller, 1998a). In the km case, the wind-termination takes place at high temperature () and thus the long ( ms) leads to the low owing to the neutrino effects.
In summary, our exploration here elucidates a crucial role of wind termination on the p-process. On one hand, a fast expansion above the temperature (more precisely, in the considered conditions) is favored to obtain a high proton-to-seed ratio at the onset of the p-process. On the other hand, a slow expansion below this temperature, owing to wind termination, is needed to obtain for efficient p-processing.
We presume that the reason for somewhat different outcomes in previous studies of the p-process described in § 1 is largely due to their different behaviors of wind termination. The temperature histories of trajectories taken by Pruet et al. (2006, an exploding star), similar to our models with (), lead to the production of p-nuclei up to . The reason of weak p-processing in Fröhlich et al. (2006a, a explosion) may be rather due to the moderate proton-richness (up to ) in their simulations (see § 4.4 and Figure 6). In contrast, negligible production of p-nuclei in the electron-capture supernova of a star (Wanajo et al., 2009, also S. Wanajo et al., in preparation) is due to the absence of a wind-termination shock within the relevant temperature range () owing to the steep density gradient of the oxygen-neon-magnesium core progenitors surrounded by a diluted outer H/He envelope.
4.2. Neutrino Luminosity
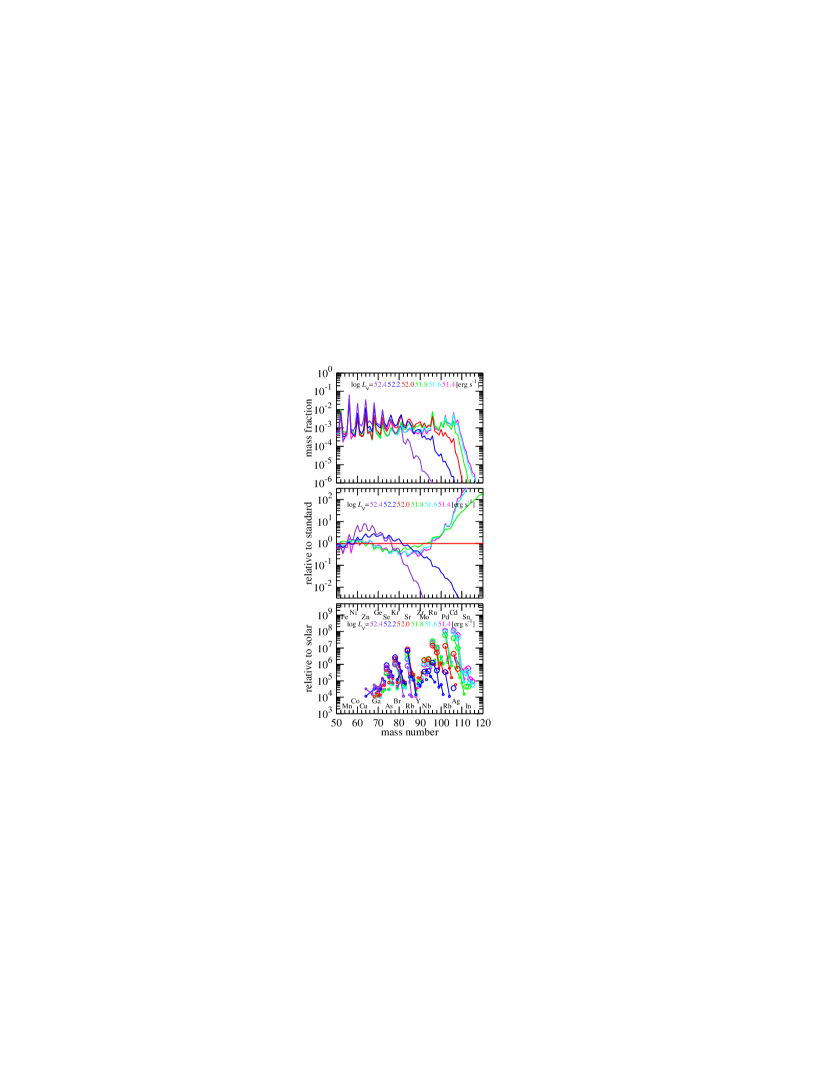
The neutrino luminosity decreases with time from its initial value of a few erg s-1 to erg s-1 during the first 10 s (Fischer et al., 2010; Hüdepohl et al., 2010). In this subsection, we examine the effect of on the p-process, by varying its value from erg s-1 to 10 times smaller than that with an interval of 0.2 dex (from 10th to 15th lines in Table 1 and Figure 3). and are taken to be the fiducial values of and 0.600, respectively. In § 4.1, we found that the temperature at the wind-termination, , plays a crucial role for the p-process. Hence, we adjust (Table 1) such that the fiducial value of is obtained for each .
The results of nucleosynthesis calculations are shown in Figure 3 and Table 1. We clearly see the increasing efficiency of p-processing with a decrease of . This is due to the larger entropy for a smaller (Table 1), while the expansion timescales (prior to the p-process) are similar555When the radius of the neutrino sphere is fixed to a constant value, the expansion timescale increases with decreasing (see, e.g. Otsuki et al., 2000; Wanajo et al., 2001). In this study, however, is assumed to decrease with decreasing (§ 2), which is more realistic. As a result, the difference of in the range of explored here is moderate.. This leads to a higher at the onset of the p-process for a lower . In addition, the somewhat larger timescale for a smaller increases (12th column in Table 1). For these reasons, a smaller model achieves larger , leading to a more efficient p-process.
It should be noted that in our explored cases, decreases with decreasing (Table 1) in order to obtain the fiducial value of (to figure out solely the effect of ). However, if increases with time and thus decreases with decreasing , as in many explosion models, only the early stage of the neutrino-driven wind with erg s-1 may be relevant to the high (see, e.g., Arcones et al., 2007) that is needed for efficient p-processing (§ 4.1).
4.3. Neutron Star Mass
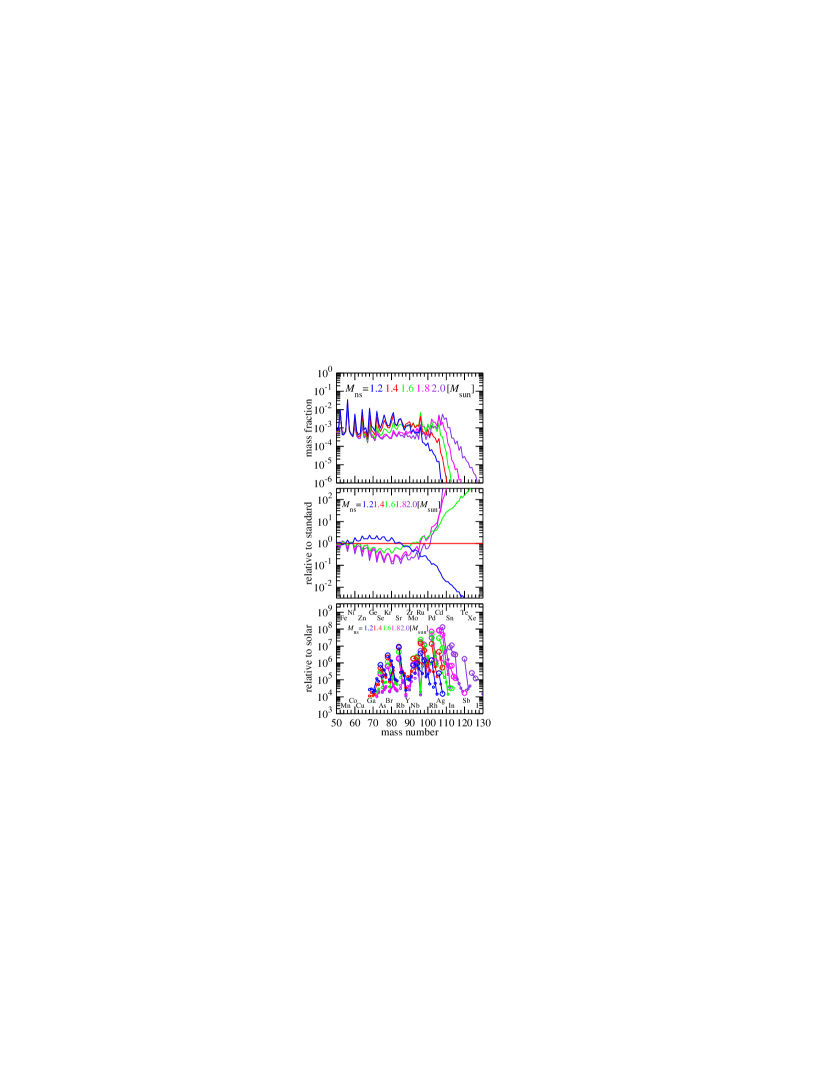
The mass of the proto-neutron star can be somewhat different from its canonical value of , depending on its progenitor mass. In this subsection, we examine the nucleosynthesis calculations with , and , while and are kept to be their fiducial values of erg s-1 and 0.600. For each case, the fiducial value of is obtained by adjusting (from 16th to 20th lines in Table 1) as in § 4.2.
We find a clear correlation between an increase of and an increasing efficiency of p-processing in Figure 4 and Table 1. This is due to a larger and a smaller for a larger (e.g., Otsuki et al., 2000; Wanajo et al., 2001), both of which help to increase and thus . This means that a more massive progenitor (up to , which forms a neutron star) is favored for the p-process, given that all the other parameters are the same. In reality, however, other factors, such as the evolutions of , , and should be dependent on the progenitor mass (e.g., Arcones et al., 2007), which prevents us from drawing any firm conclusions. It should be emphasized, however, that the outflow with a typical mass of can already provide physical conditions sufficient for producing the p-nuclei up to .
4.4. Electron Fraction
The electron fraction is obviously one of the most important ingredients in the p-process as it controls the proton-richness in the ejecta. Recent hydrodynamical studies with elaborate neutrino transport indicate that exceeds 0.5 and increases up to during the neutrino-driven wind phase (Fischer et al., 2010; Hüdepohl et al., 2010). It should be noted that substantially decreases from its initial value owing to the neutrino effects (§ 4.1). In our standard model, the value decreases from (at ) to at the onset of the p-process (). However, these neutrino effects would highly dependent on the neutrino luminosities and energies of electron and anti-electron neutrinos assumed in this study. In this subsection, therefore, we take the value at the onset of the p-process, , as a reference, rather than the initial value .
Figure 5 and Table 1 (the last 6 lines) show the nucleosynthetic results for , and 0.655 (see Table 1 for their initial values ). The other parameters , , and (and thus ) are kept to be their fiducial values (1st line in Table 1). We find a great impact of the variation; an increase of only leads to a 10-unit increase of , while is similar for . This is due to the larger (at ) for a larger , leading the larger despite the same (Table 1).
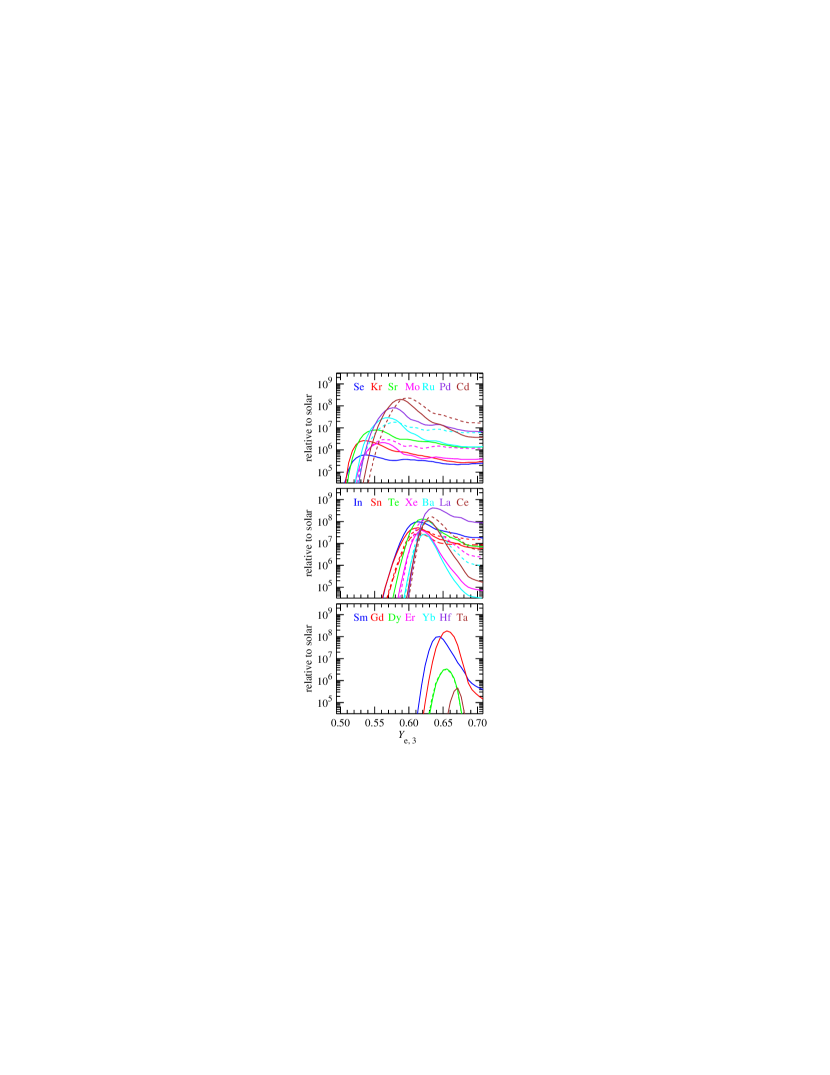
In order to elucidate the effect of in more detail, the production factor for each p-nucleus is drawn in Figure 6 as a function of , where , , and are kept to be their fiducial values. Each element is color coded with the solid, dashed, and long-dashed lines for the lightest, second-lightest, and third-lightest (115Sn is only the case) isotopes, respectively (see 1st column of Table 4 for the list of p-nuclei). We find in the top panel of Figure 6 that the p-nuclei up to (108Cd) take the maximum production factors between and 0.60. Given the maximum to be according to some recent hydrodynamic results (e.g., Fischer et al., 2010; Hüdepohl et al., 2010), this implies that the maximum mass number of the p-nuclei produced by the p-process is .
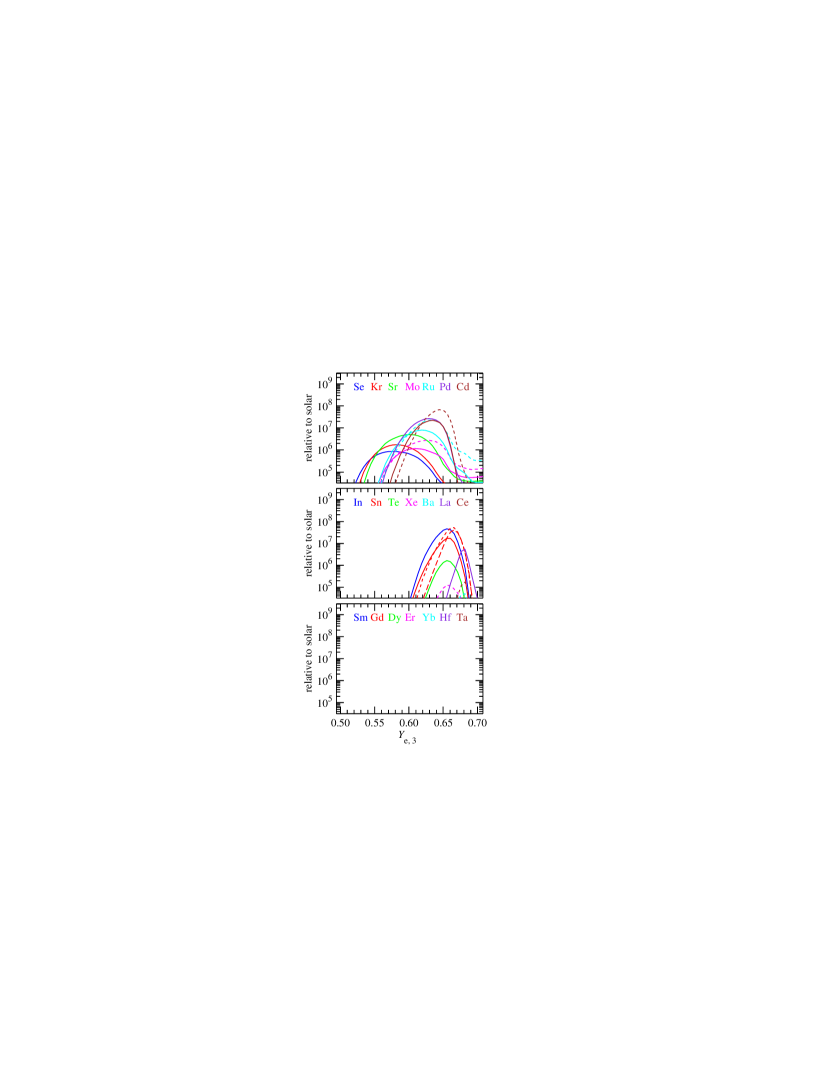
In principle, the heavier p-nuclei can be synthesized if the matter is more proton-rich than . The middle panel of Figure 6 shows that the production factors of the p-nuclei from (113In) up to (138Ce) are maximal between and 0.63. Furthermore, 144Sm and 152Gd reach the maximum production factors at and 0.66, respectively (bottom panel in Figure 6). The end point of the p-process appears to be at (180Ta) in our explored cases. It should be noted that the wind termination also plays a crucial role as explored in § 4.1. This is evident if we compare Figures 6 and 7, where the latter is the result for . Without wind termination, more proton-richness () is required for a given p-nucleus to be produced, but with a substantially smaller production factor. The p-nuclei heavier than cannot be produced at all without wind termination (bottom panel in Figure 7).
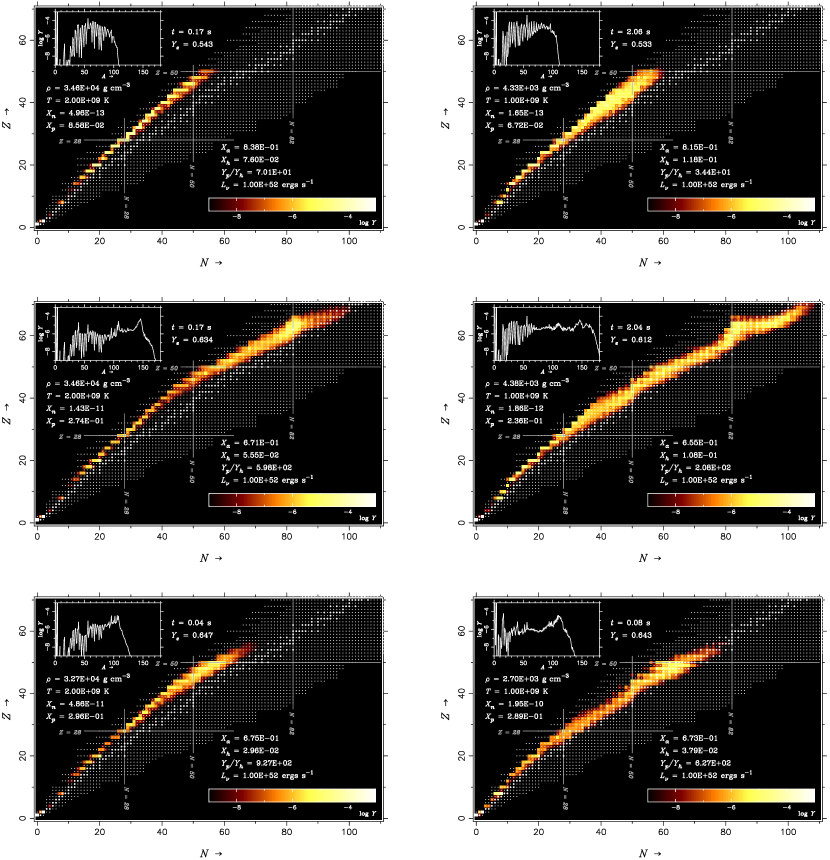
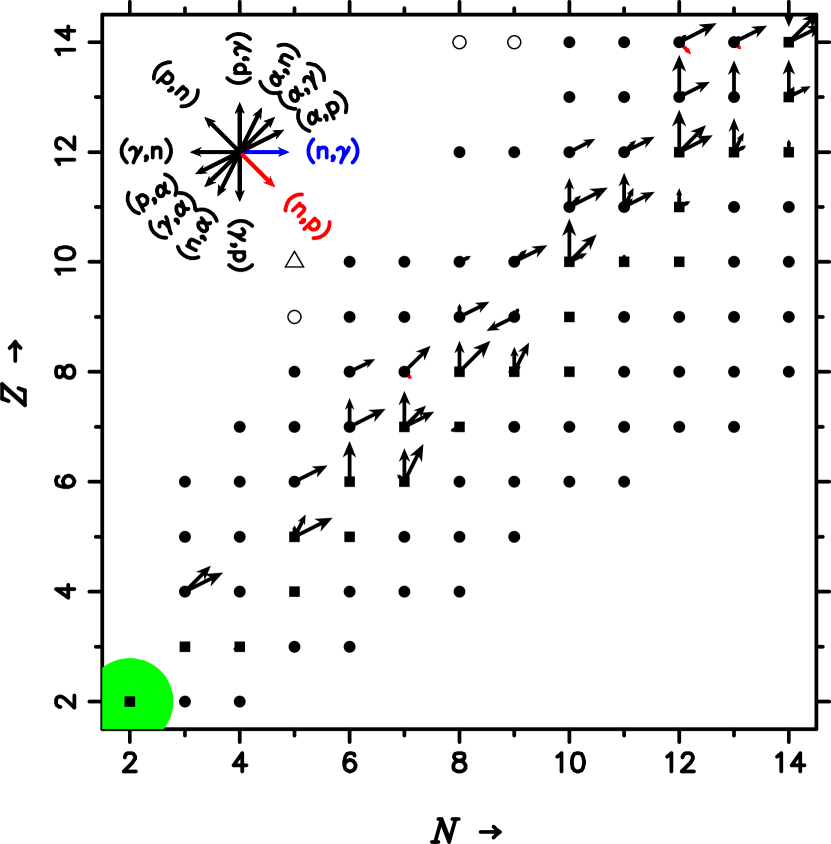
We can understand the reason for the above result from Figure 8, which displays the snapshots of nucleosynthesis for selected cases on the nuclear chart when the temperature drops to (left) and 1 (right). Top, middle, and bottom panels are for the standard model, that with replaced by 0.800 (), and that with and replaced by 0.800 and (without wind termination), respectively. In the standard model (), the nuclear flow proceeds along the proton-drip line and encounters the proton-magic number (). There are -unbound nuclei of 106-108Te () just above along the proton-drip line, which is the end point of the classical rp-process (Schatz et al., 2001). This is why the p-process stops at for .
As exceeds 0.6, radiative neutron capture becomes more important and competes with proton capture (Pruet et al., 2006; Wanajo, 2006). This is due to the large amount of free protons ( at for the middle panels of Figure 8; the last line in Table 1) that release free neutrons owing to neutrino capture (). As a result, the nuclear flow detours the end point of the classical rp-process () at towards the larger atomic number through the nuclei with , as can be seen in Figure 9. The stagnation of the flow at the neutron-magic number in the middle panels of Figure 8 clearly shows the importance of neutron capture. The concentration of nuclei at leads to the large production factors of the p-nuclei with as seen in Figure 6. Note that the p-nuclide 144Sm is located on the line.
Beyond , the increasing atomic number and the decreasing temperature inhibit further proton capture. Note that in our explored models (see equations (1) and (2)). Thus, neutron capture still continues at this stage. As a result, the nuclear flow approaches the -stability line and finally enters to the neutron-rich region at as seen in the middle-right panel of Figure 8. Without wind termination (but with the same parameters otherwise), however, the rapidly decreasing temperature does not allow the nuclear flow to reach as seen in the bottom panels of Figure 8. This is the reason for the inefficiency of producing heavy p-nuclei in Figure 7.
5. Uncertainties in Nuclear Physics
There have been continuing experimental works relevant to the p-process (e.g., Weber et al., 2008; Hayakawa et al., 2010) since its discovery. However, we still rely upon theoretical or limited experimental estimates for the vast majority of nuclear reactions accompanied with the p-process, which may suffer from uncertainties. There are also a number of isotopes without experimental mass measurements on the p-process pathway (Weber et al., 2008).
The p-process is unique in the following aspects, different from the classical rp-process. First is that the seed nuclei are directly formed from free nucleons (i.e., the primary process), while the classical rp-process needs CNO seeds. Thus, the triple- process and some 2-body reactions relevant to the breakout from the pp-chain region () play important roles for setting the proton-to-seed ratio (and thus ) at the beginning of the p-process (§ 5.1). Second is the role of neutron capture, in particular of reactions on heavy nuclei in the proton-rich matter, which bypass the -waiting points on the classical rp-process path (§ 5.2). Third, the p-process path is limited to , where most of the nuclear masses of relevance are measurable (Weber et al., 2008, § 5.3). This is an advantage compared to the classical rp-process that proceeds through even-even nuclei with radiative proton capture to isotopes (Brown et al., 2002).
In the following subsections § 5.1 and 5.2, we test the effect of uncertainties in some selected reactions by simply multiplying or dividing their original values by factors of 2 and 10 with the standard model (1st lines in Tables 1 and 3). All the explored results are listed in Table 3. In § 5.3, the effect of new mass measurements by Weber et al. (2008) is discussed, along with possible uncertainties of other unmeasured nuclear masses on the p-process pathway.
5.1. Breakout from the pp-Chain Region
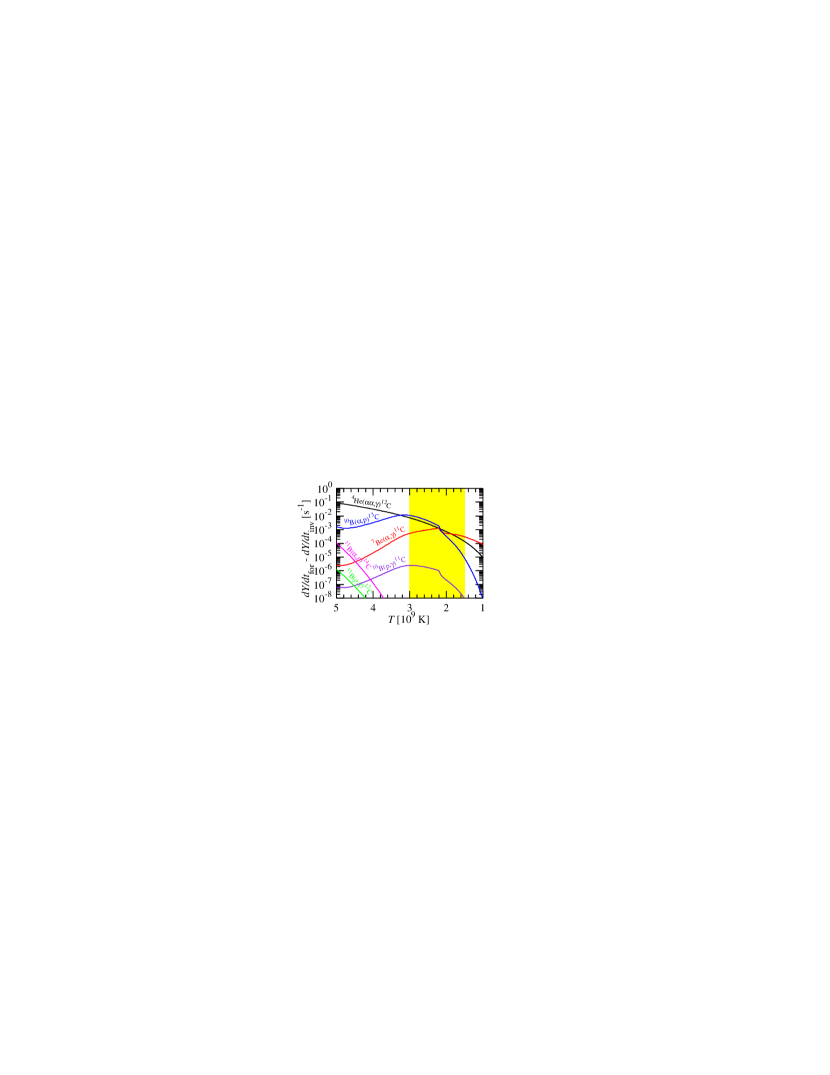
In Figure 10, the nuclear flows for the reactions that bridge from (the pp-chain region) to (the CNO region) are shown as a function of the temperature before () and after () the onset of the p-process. The nuclear flows at for the relevant - region are also shown in Figure 11. Here, the nuclear flow is defined as the difference between the time-derivatives of abundances for the forward and inverse reactions of a given channel. It is clear that, at a high temperature (), the triple- process (with the rate of Caughlan & Fowler, 1988) plays a dominant role for the breakout from the pp-chain region. We find, however, a couple of 2-body reaction sequences 7BeCN and 7BeBC compete with the triple- process during the p-process phase6667BeB is an endothermic reaction. Because of its small (negative) -value of MeV and the larger abundance of particles, a small amount of 10B (that is immediately taken away by the subsequent reaction) exists in the present case..
Table 2 lists the reaction rates and decay timescales for the relevant isotopes at and 2.0. It is clear that 7BeC, 4 orders of magnitude slower than 11CN, governs the former sequence. For the latter, 10BC, although a factor of 10 smaller than 7BeB, mainly controls the reaction flow, which takes away nuclear abundances from 10B formed by the endothermic reaction.
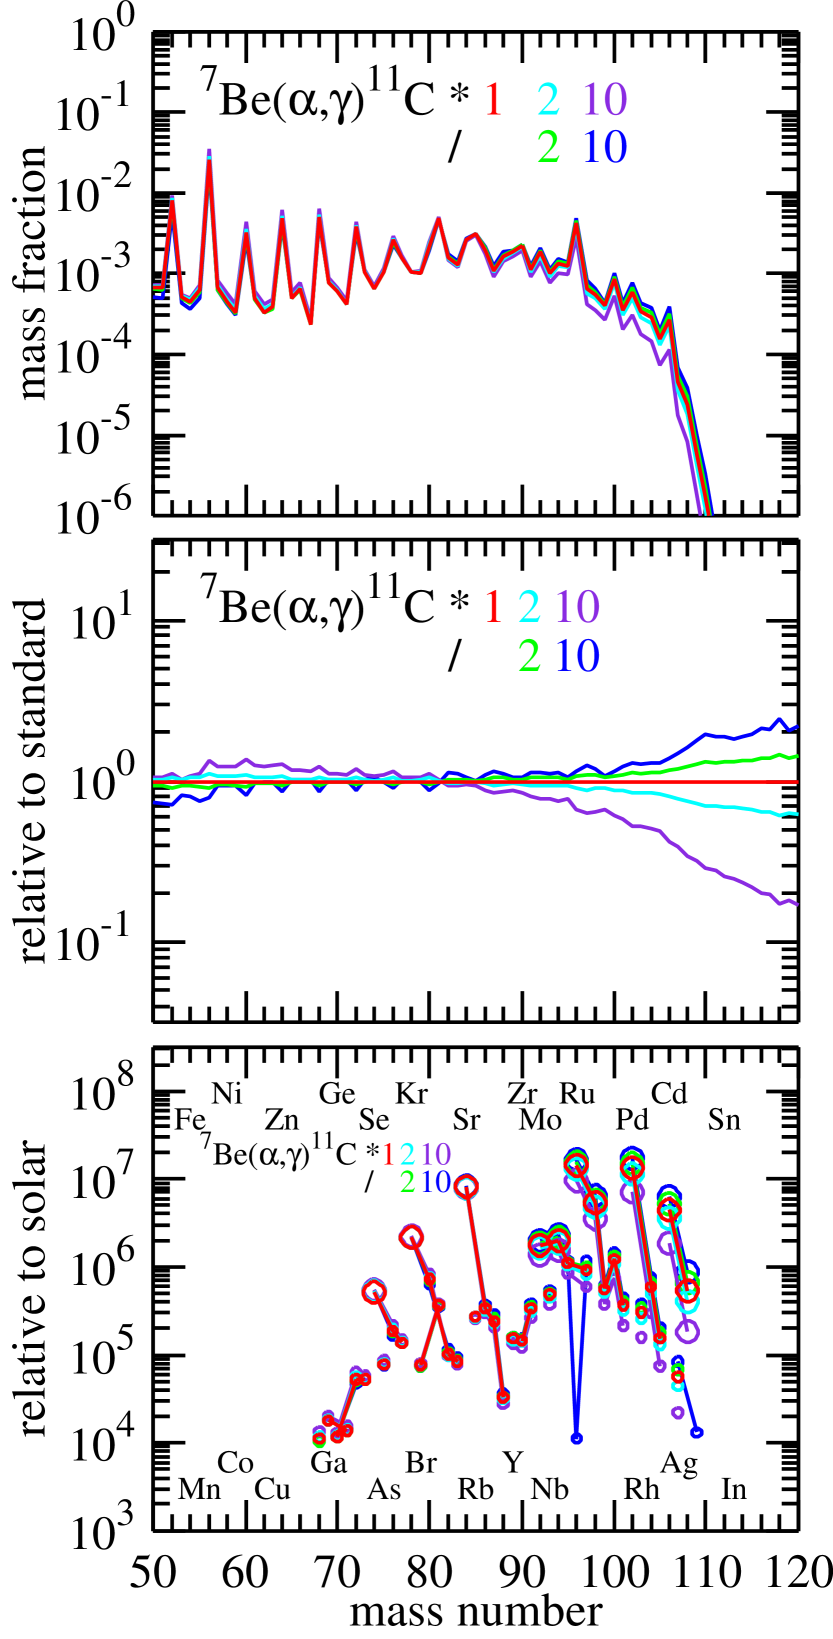
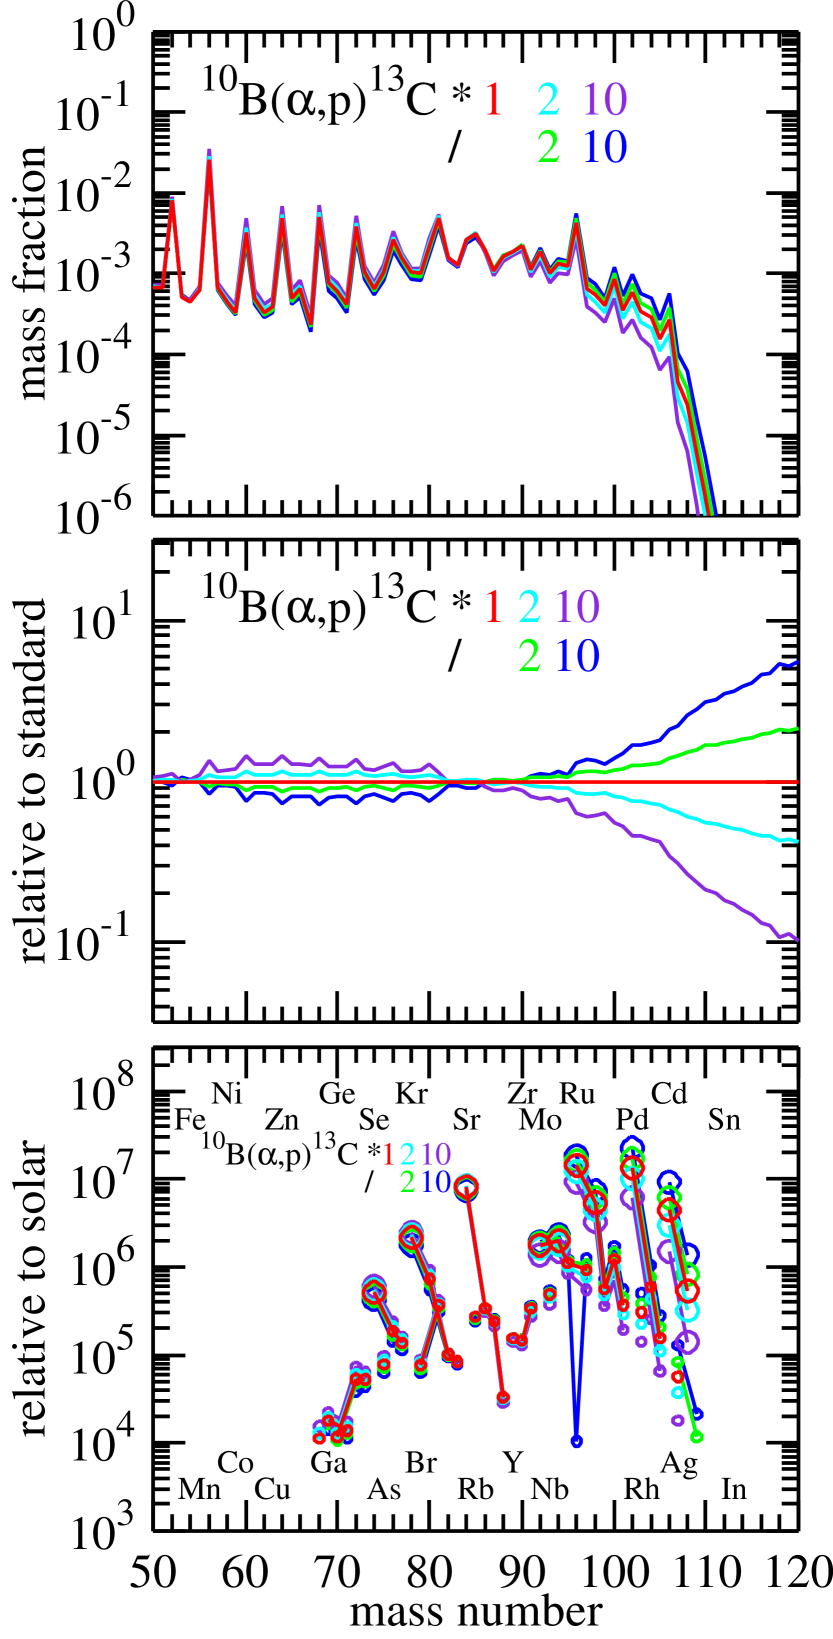
Figure 10 shows that 7BeC and 10BC exhibit similar roles to triple- in the temperature range relevant to the p-process. Therefore, we select these three reactions for the sensitivity tests. Note that the unstable isotope 11C produced is followed by 11CN (see Hayakawa et al., 2010, for a recent experimental evaluation of this rate) before decaying back to 11B.
All the data of these three reactions, from Wagoner (1969, for 10BC) and Caughlan & Fowler (1988, for the remainder) in the REACLIB compilation, are based on experimental information of single resonance states. Contribution from (possible) resonances at higher excitation energies could thus sizably change these rates. As an example, the triple- rate of Angulo et al. (1999), which includes contribution from the 9.2-MeV state that is predicted theoretically, leads to a factor of 2 to 10 higher values (for the temperature range relevant to seed production, ) than that of Caughlan & Fowler (1988) based on the single 7.6-MeV (Hoyle) state. Recent experimental works did not confirm the presence of the 9.2 MeV state, but other levels in this energy region as well as those at higher energies might contribute to this rate (Austin, 2005; Diget et al., 2005, 2009).
The result of sensitivity tests for the triple- rate is shown in Figure 12, where the forward and inverse rates are multiplied or divided by factors of 2 and 10. We find substantial changes in the production of p-nuclei with for a factor of 2 variation on the rate, and more drastic changes for a factor of 10 variation. It can be mainly attributed to the resulting proton-to-seed ratio (at ) and thus (3rd and 4th lines in Table 3). Note that (; 1st line in Table 1) remains the same for all the cases here. A larger triple- rate leads to a more efficient seed production and thus smaller and . A larger rate during the p-process phase () also yields more carbon and other intermediate-mass nuclei that act as proton poison. As a result, efficiency of the p-process for heavy element synthesis decreases. The same interpretation is applicable to the opposite case with a smaller rate.
We find that a replacement of the triple- rate by that of Angulo et al. (1999) inhibits production of p-nuclei for (Figure 12). In fact, the net effect of including the 9.2 MeV state (not confirmed by recent experiments) by Angulo et al. (1999) corresponds to the rate of Caughlan & Fowler (1988) multiplied by a factor of 10. This demonstrates the importance of future re-evaluations of (possible) contribution from higher levels than the 7.64 MeV state in 12C.
Figures 13 and 14 show the result for 7BeC and 10BC. We find non-negligible differences in the p-abundances with , although the impact is much smaller than that for triple-. Note that a larger rate has a stronger impact than a smaller rate (middle panels). This is a consequence of the fact that the larger rate of a given channel increases the total efficiency for the breakout from the pp-chain region, while the other two channels are still active for the smaller rate (see Figure 10).
7BeC competes with triple- only during the late phase of the p-process (; Figure 10). A larger rate during this phase leads to more production of intermediate-mass nuclei that act as proton poison. A variation of this rate does not substantially affect (at ) and at the onset of p-processing (Table 3). 10BC however competes with triple- at (Figure 10). Hence, a variation on the rate also affects at the beginning of p-processing and (Table 3).
5.2. Reactions on Heavy Nuclei
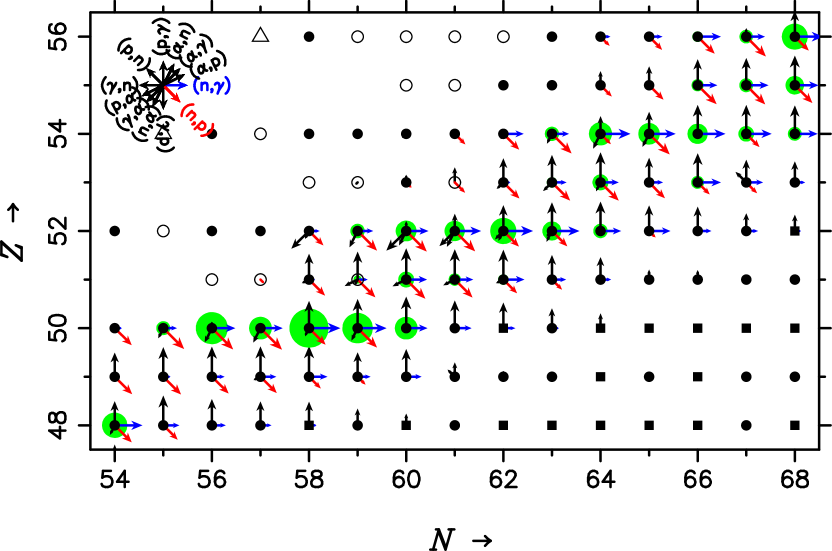
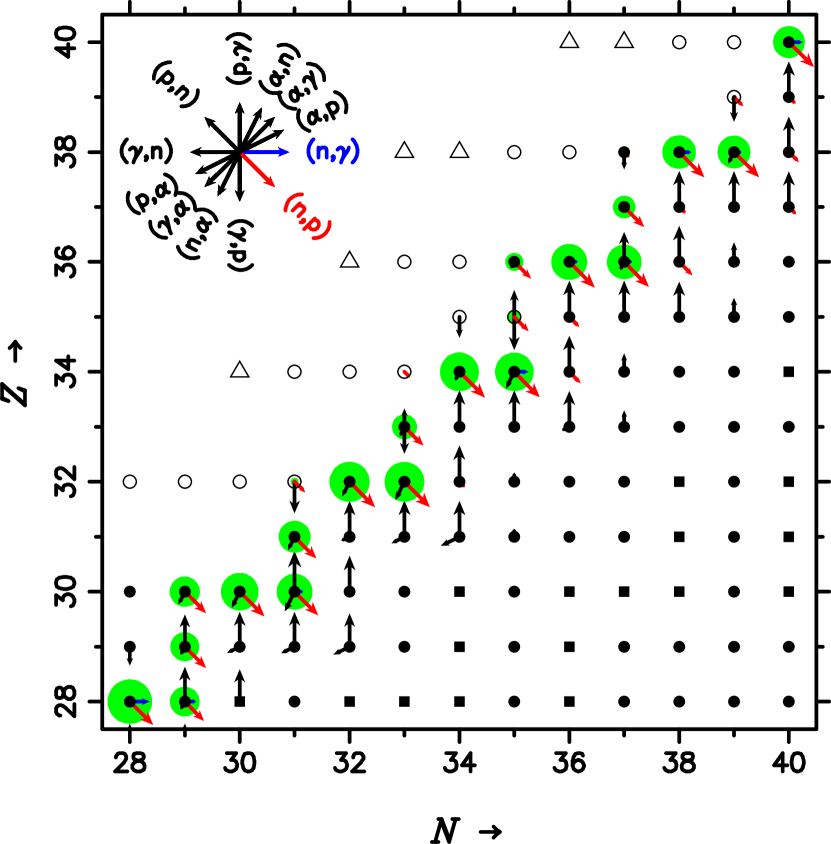
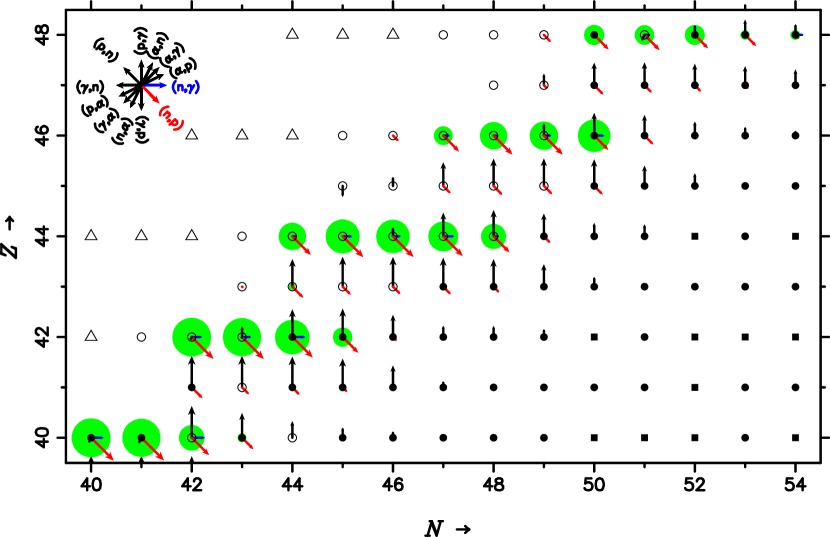
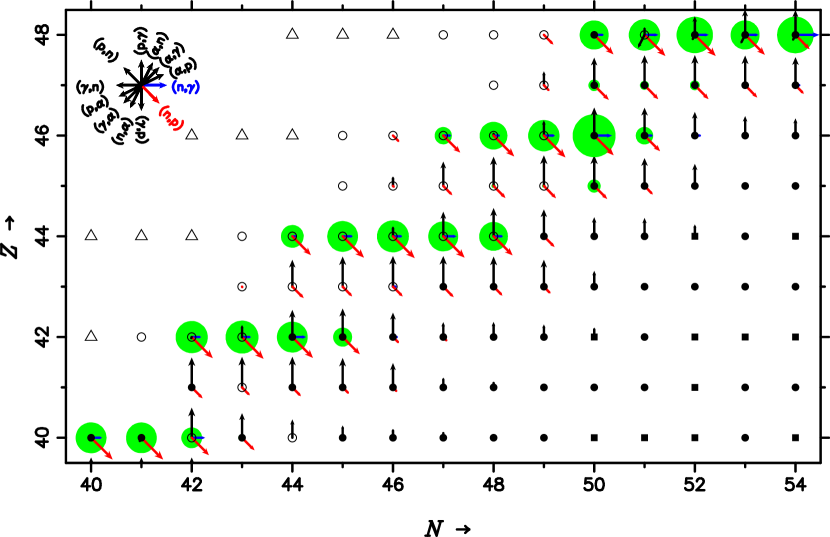
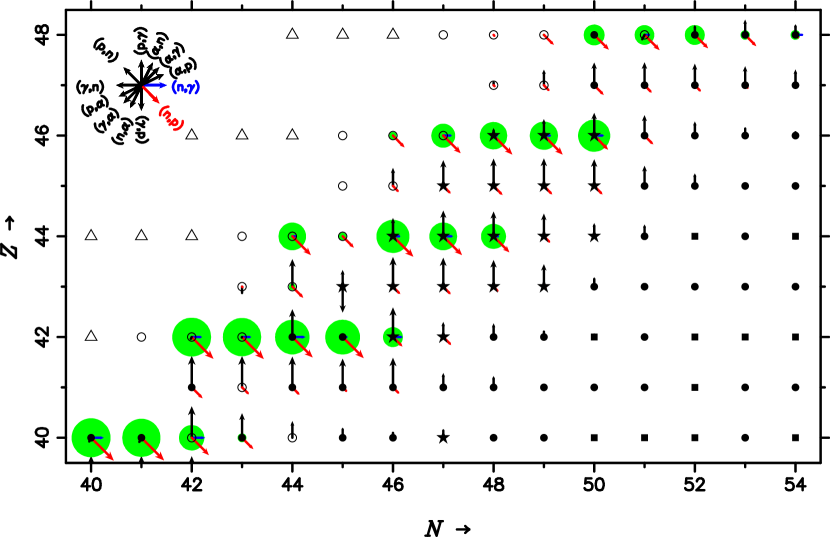
The p-process starts at from the seed nucleus 56Ni, which is formed from free nucleons earlier. During the p-process, the reactions play an important role for determining the nuclear flows. Figure 15 shows the nuclear flows starting from 56Ni () up to 80Zr (). The isotopes included in the reaction network are denoted by squares (stable isotopes), filled circles (with measured masses of Audi, Wapstra, & Thibault, 2003), open circles (with extrapolated masses of Audi, Wapstra, & Thibault, 2003), and triangles (with the HFB-9 masses of Goriely et al., 2005). We find that the nuclear flow of the p-process proceeds through even-even isotopes up to as in the classical rp-process. All the nuclear masses on the p-process path (up to ), which determine the abundance distribution for given isotones, were measured by experiments (Audi, Wapstra, & Thibault, 2003)777We do not take the mirror-mass evaluations of Brown et al. (2002) for nuclei into account, as the p-process path is limited to the region (except for a flow to 59Zn but with measured masses; Figure 15)..
Currently, there are no experiment-based estimates for the reactions on proton-rich isotopes along the p-process path. We rely upon the theoretically predicted Hauser-Feshbach rates, which are generally considered to involve uncertainties up to a factor of a few (this reduces to if the nuclear levels are well determined and the level densities are large enough, Rauscher et al., 1997). Rauscher (2010) also finds sizable shifts of effective energy windows for at high temperature, which might modify these rates. In this subsection, therefore, the sensitivity tests for reactions are made with factors of 2 and 10 variations as in § 5.1.
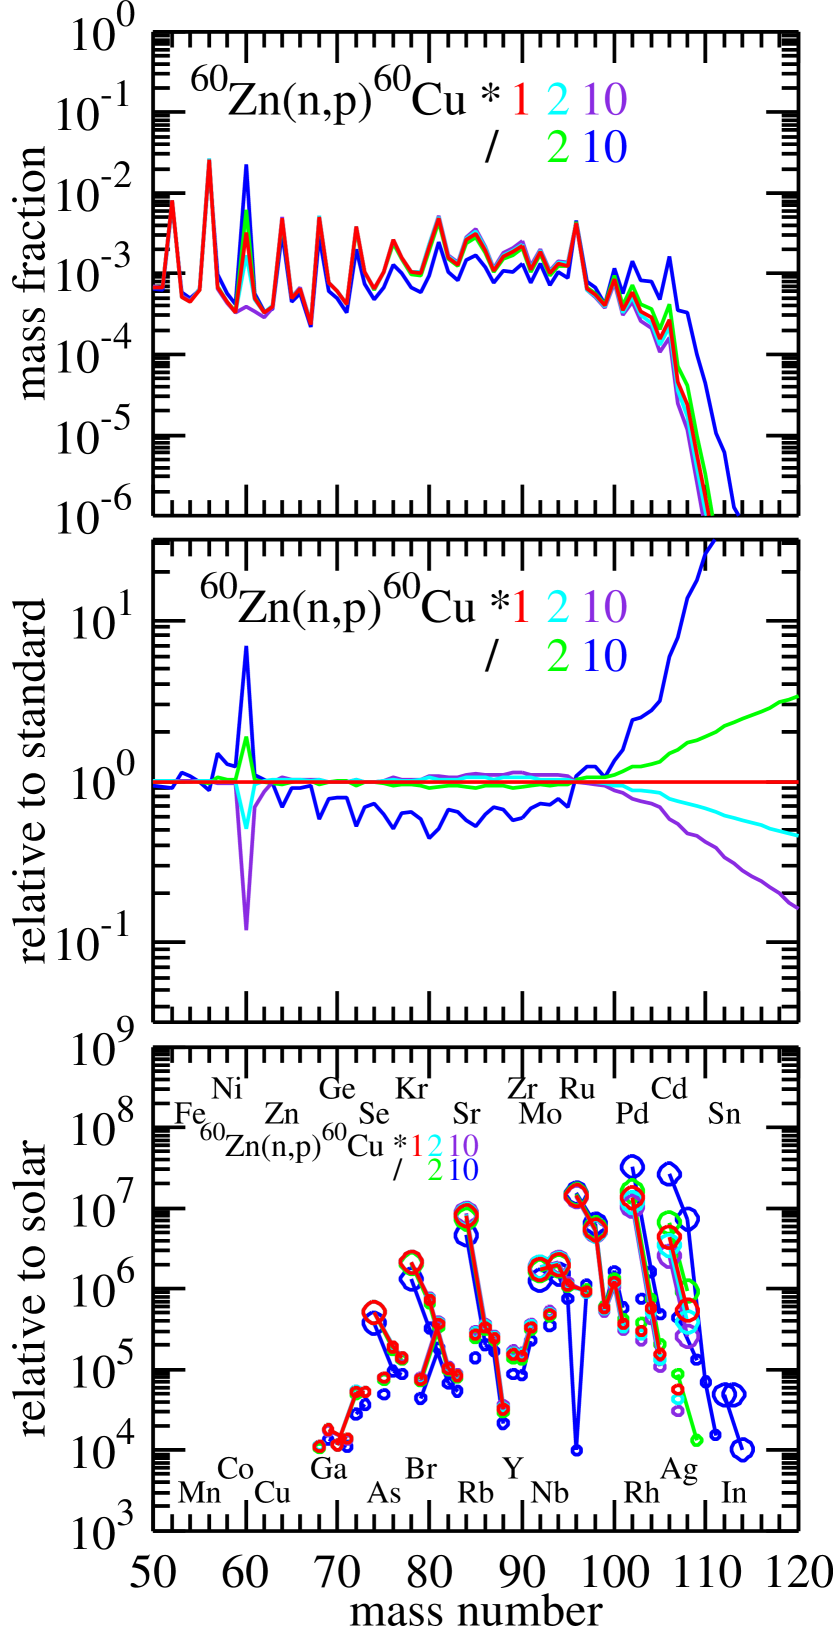
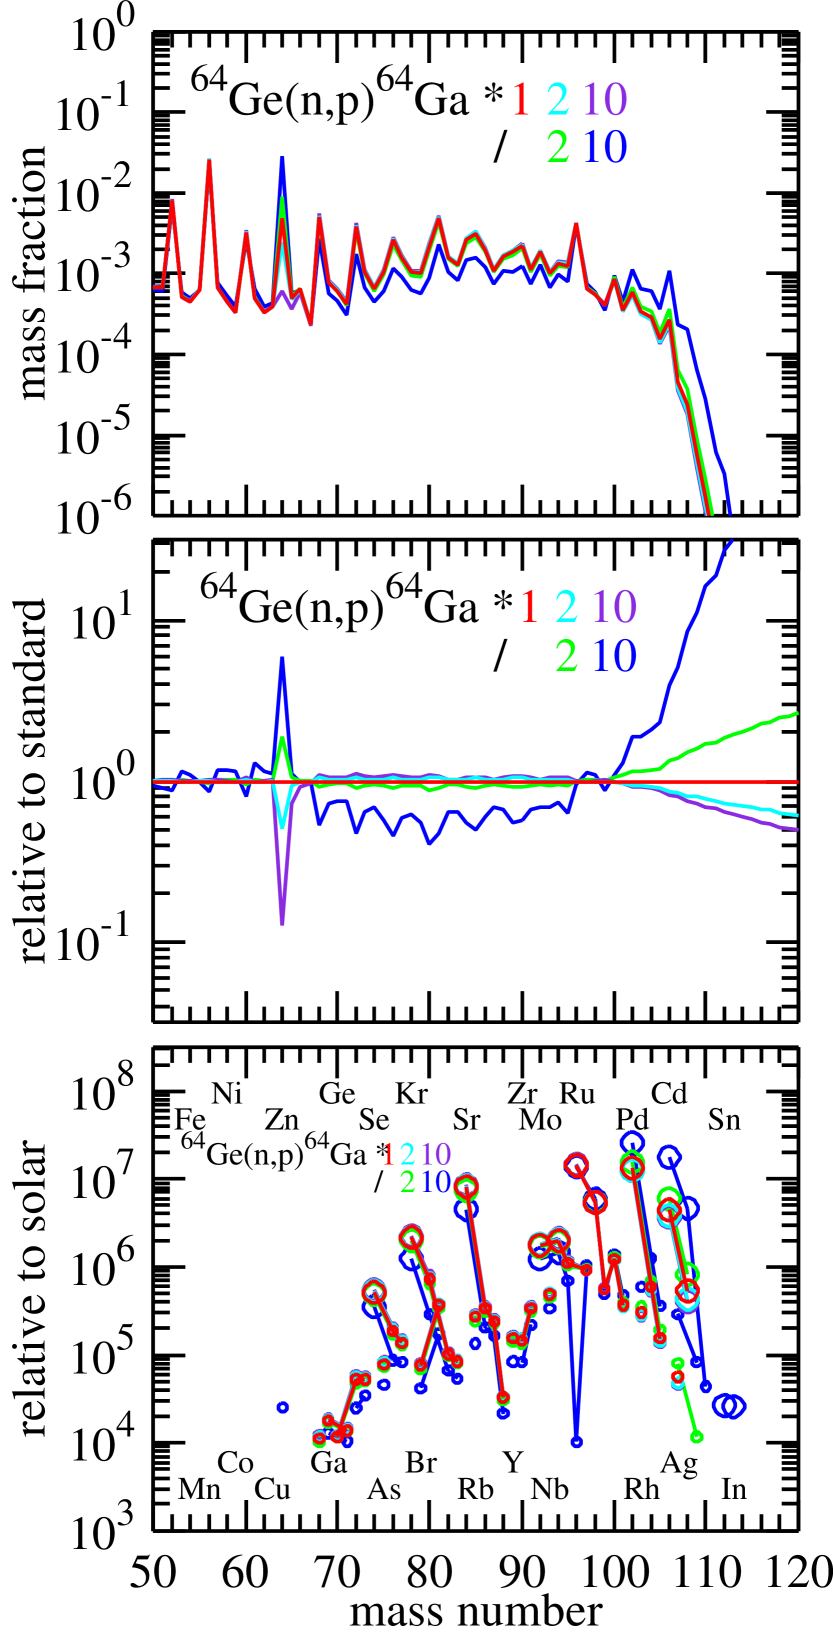
We here pick up three reactions starting from the seed nuclei along the p-process path, i.e., on 56Ni, 60Zn, and 64Ge. The last one, 64Ge, is the first -waiting point nucleus encountered in the classical rp-process path. Note that the variations on these rates do not affect at the onset of the p-process nor (Table 3). All these rates are from theoretical estimates in BRUSLIB (Aikawa et al., 2005) making use of experimental masses (Audi, Wapstra, & Thibault, 2003). Our test calculations with the rates replaced by those in the REACLIB compilation (Rauscher et al., 2002) are in reasonable agreement (within factor of a few) with our standard case (see also Wanajo et al., 2009).
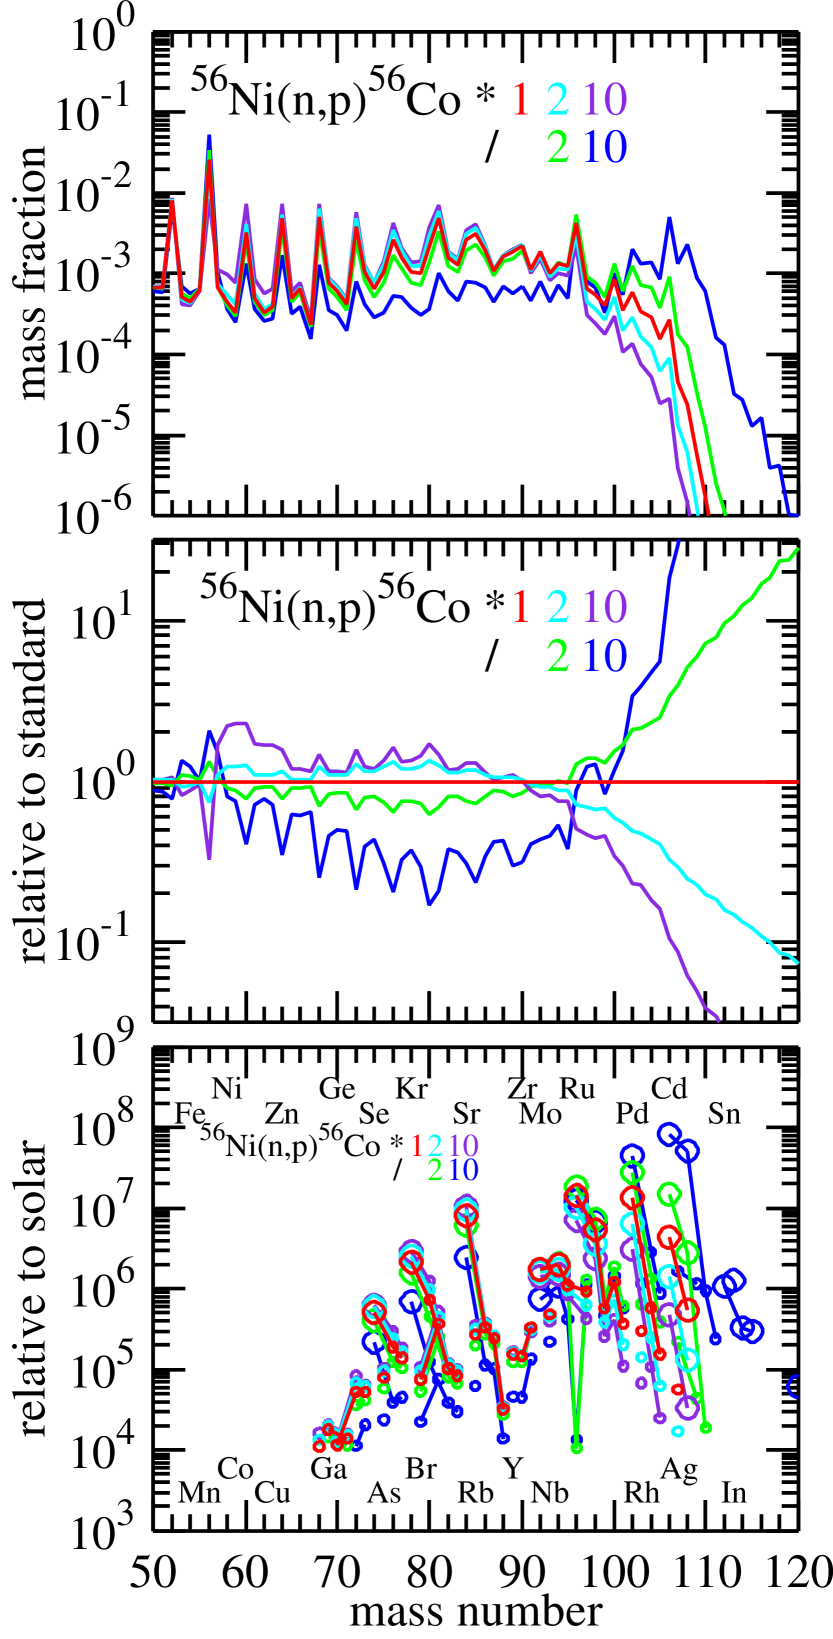
We find a remarkable change in the p-abundances with by a factor of 10 with only a factor of 2 variation on 56NiCo (Figure 16 and Table 3). This demonstrates that the reaction on the first -waiting nucleus 56Ni plays a key role for the progress of nuclear flows.
It should be noted that a smaller rate leads to more efficient p-processing as can be seen in the bottom panel of Figure 16 and in Table 3 (see and ). The reason can be explained as follows: Figure 17 extends the nuclear flows in Figure 15. We find that the p-process path proceeds through even-even isotopes and deviates from 84Mo () toward , reaching 96Pd on the shell closure. These isotopes have large abundances during the whole p-process phase, as can be seen in Figures 15 and 17 (filled green circles). The top panel of Figure 16 shows that the abundances with , and 84 are similar to that of . Table 2 lists the rates and decay timescales for the corresponding isotopes at and 2.0. The rates on 56Ni and 96Pd, neutron magic nuclei on and 50, respectively, are a factor of 4–10 times smaller than the others. This indicates that the free neutrons created by neutrino capture () are preferentially consumed by the even- nuclei with (that act as neutron poisons), rather than by 96Pd.
A reduction of the 56Ni rate (by a factor of 2 or 10) reduces the abundances of these neutron poisons by a similar factor (, Figure 16; middle). Despite this, the abundance of 96Pd does not decrease (even increases). This is due to the faster rates for the () nuclei, causing the nuclear flows from 56Ni to immediately reach 96Pd and to stagnate there. As a result, a larger number of free neutrons becomes available for the 96Pd reaction.
The nuclear flows for the 56Ni rate reduced by a factor of 10 are shown in Figure 18. Smaller abundances of nuclei 80Zr and 84Mo can be seen, which leads to the larger flows beyond through 96Pd. This clearly demonstrates that 96Pd plays a role as a “second seed nucleus” for producing nuclei heavier than . In short, a reduction of the 56Ni rate increases the number of free neutrons available for the second seed nuclei of 96Pd.
Figures 19 and 20 show the results for the second and third -waiting nuclei, 60Zn and 64Ge (the first -waiting nucleus on the classical rp-process). The variations on these rates also lead to visible changes in the nucleosynthetic p-abundances, being however less prominent than in the case of 56Ni. Note that a reduced rate leads to a larger impact on the nucleosynthetic p-abundances than an increased value of this rate. This is due to the fact that the reaction on 56Ni is substantially slower than those on 60Zn and 64Ge (Table 2), where the strength of the nuclear flow is limited by the former reaction.
5.3. Nuclear masses on the p-process pathway
Nuclear masses on the nucleosynthetic path are fundamental for all the relevant nuclear (or weak) processes. In particular, the flow strength of radiative proton capture during p-processing () is mostly determined from proton separation energies, where is generally faster than and and thus in a quasi equilibrium. This explains the concentration of abundances on even- isotopes in Figures 8 (left panel; in particular for ), 9, 15, 17, and 18.
There are a number of isotopes without measured masses in the compilation of Audi, Wapstra, & Thibault (2003) for (denoted by open circles in Figures 17 and 18), including the parent nuclei of light p-nuclei, 84Sr, 92,94Mo, and 96,98Ru. Pruet et al. (2006) noted that the unmeasured masses of 92Ru and 93Rh (i.e., the proton separation energy of 93Rh) on the isotones are crucial for determining the ratio of 92Mo/94Mo.
Recently, Weber et al. (2008) obtained precision measurements of a number of nuclear masses along the p-process pathway, including those of 92Ru and 93Rh. Here, we present the nucleosynthetic result with inclusion of there new masses, denoted by star symbols in Figure 21, with our standard model (first lines in Table 1 and 3). We confirm the suppression of the flow through 87MoTc (; see Figure 17), which has been reported in Weber et al. (2008). This leads to a factor of three enhancement of 87Sr and a factor of two reduction of 89Y, which are however not p-isotopes (and with small production factors). The other p-abundances, including of 92,94Mo, are almost unchanged, as reported in Weber et al. (2008) and in Fisker et al. (2009).
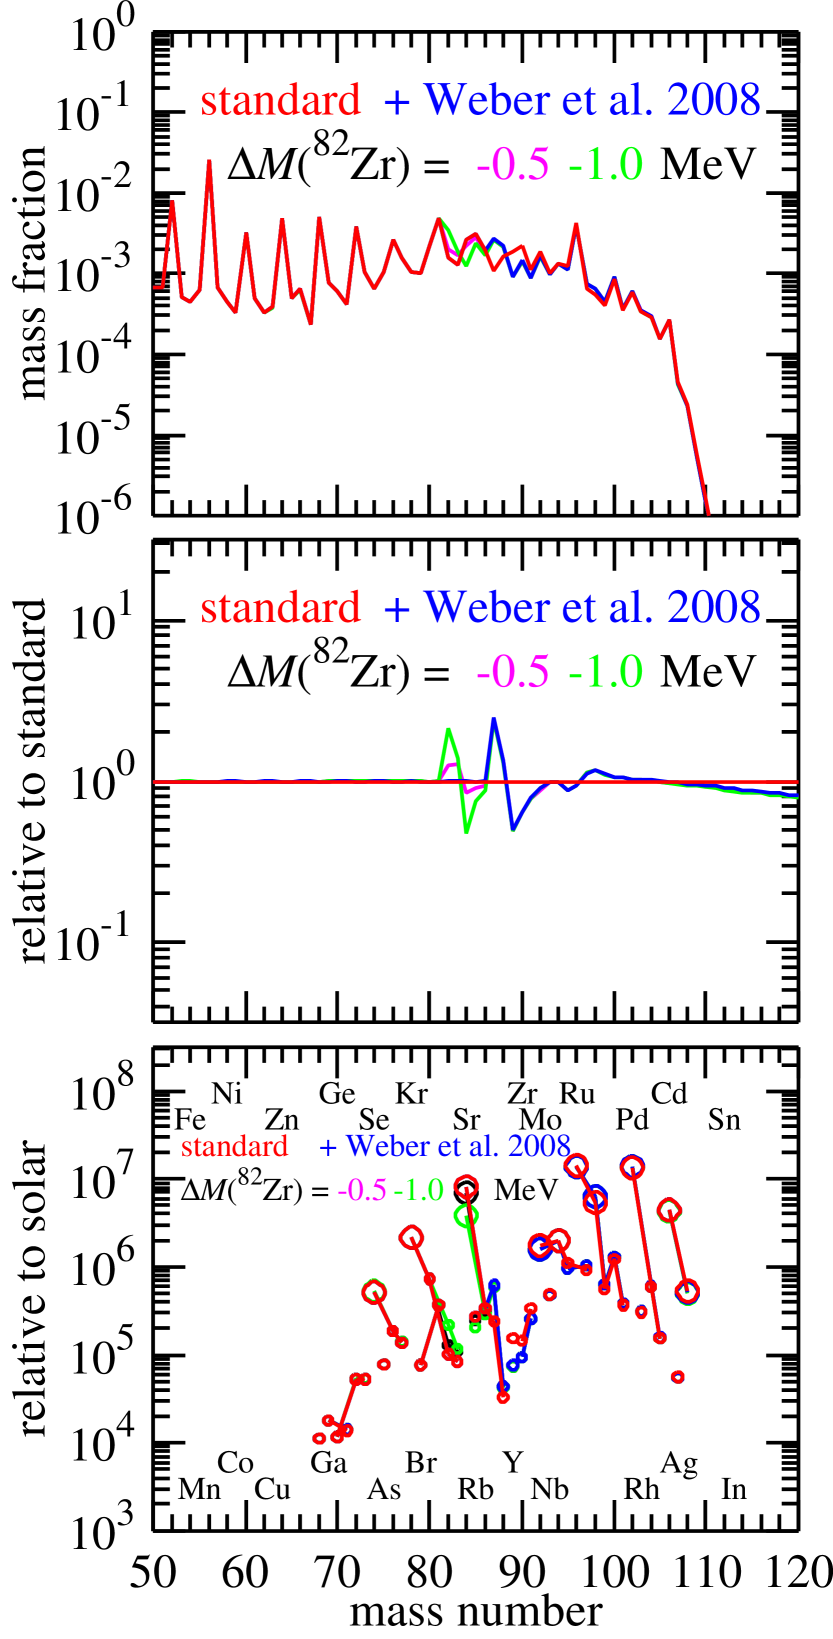
Our calculations of sensitivity tests for all other unmeasured masses on the p-process path show that the mass of 82Zr (or the proton separation energy of 83Nb) on plays an important role for production of a light p-nuclei 84Sr. The others have only minor roles for the sensitivity tests with variations of up to MeV on the nuclear masses. We find in Figure 22 that a 1.0 MeV reduction of the 82Zr mass (equivalent to a reduction of the proton separation energy of 83Nb) leads to a reduction of the 84Sr abundance by a factor of two (middle panel). An increase of the 82Zr mass has no effect on the p-abundances.
This is particularly important when we consider the role of the p-process to the solar inventory of most mysterious p-nuclei, 92Mo and 94Mo. As can be seen in Figure 22 (bottom panel; and in other similar figures), the production factors of 92Mo and 94Mo are always substantially smaller than the neighboring p-isotopes, in particular, 84Sr (see Figures 6 and 7). A reduction of the 84Sr would in part reduce this large gap. Note that the experimental mass of 93Nb in Audi, Wapstra, & Thibault (2003) involves a large uncertainty (315 keV). Future precision measurements of both 82Zr and 83Nb are thus highly desired.
6. p-process as the origin of p-nuclei
In the previous sections (§ 4 and 5), we find that uncertainties in both the supernova dynamics and nuclear reactions can substantially affect the productivity of p-nuclei. This makes it difficult to determine the role of the p-process as the source of the solar p-nuclei. Keeping such uncertainties in mind, we discuss a possible contribution of the p-process to the solar p-abundances based on our result by comparing with other possible sources.
Table 4 lists the currently proposed astrophysical origins for each p-nuclide (1st column) with its solar abundance and fraction relative to its elemental abundance (2nd and 3rd columns, Lodders, 2003). All these sources are associated with core-collapse supernovae. Photo-dissociation of pre-existing neutron-rich abundances in the oxygen-neon layer of core-collapse supernovae (or in their pre-collapse phases), i.e., the -process (Woosley & Howard, 1978; Prantzos et al., 1990; Rayet et al., 1995; Rauscher et al., 2002; Hayakawa et al., 2008) is currently regarded as the most successful scenario. In the 4th column of Table 4, the p-nuclei whose origins can be explained by the -process in Rayet et al. (1995) are specified by “yes”. The bracketed ones are those underproduced in a more recent work by Rauscher et al. (2002). The origins of up to 24 out of 35 p-isotopes can be explained by the -process. However, the light p-isotopes (92,94Mo, 96,98Ru, 102Pd, 106,108Cd, 113In, and 115Sn), which account for a large fraction in the solar p-abundances, and some heavy p-isotopes (138La and 152Gd) need other sources (specified by “no” in Table 4).
The -process (5th column in Table 4, Woosley et al., 1990) in core-collapse supernovae is suggested to account for the production of a couple of heavy p-isotopes 138La and 180Ta (the former is underproduced in the -process). The -rich and slightly neutron-rich (; slightly more proton-rich than the -stability values) neutrino-driven outflows were also suggested as the production site of some light p-isotopes including 92Mo (but not 94Mo, Hoffman et al., 1996; Wanajo, 2006; Wanajo et al., 2009). The proton-richness relative to the -stability line in the fragmented QSE clusters (Hoffman et al., 1996; Meyer et al., 1998b) at leads to the formation of these p-nuclei with . Such QSE clusters on the proton-rich side of the -stability line will be denoted as “p-QSE” hereafter. A recent study of nucleosynthesis in the electron-capture supernovae of a star shows that the lightest p-nuclei 74Se, 78Kr, 84Sr, and 92Mo can be produced in p-QSE enough to account for their solar amounts (6th column in Table 4, Wanajo et al., 2009). However, these additional sources still cannot fill the gap for some light p-isotopes such as 94Mo, 96,98Ru, 102Pd, 106,108Cd, 113In, 115Sn, and for a heavy p-isotope 152Gd.
Our result in this study is based on a semi-analytic model of neutrino-driven winds, while the results for the -process, the -process, and the p-QSE listed in Table 4 are all based on realistic hydrodynamic studies. Nevertheless, we attempt to present a list of the p-isotopes whose origin can be attributed to the -process, as follows. The requisite overproduction factor for a given nuclide per supernova event, which explains its solar origin, is inferred to be (e.g., Woosley et al., 1994). Assuming the masses of the total ejecta and of the neutrino-driven ejecta to be and (e.g., Wanajo, 2006), the overproduction factor per supernova event is diluted by about 4 orders of magnitude compared to our result. We thus apply the condition and to each p-isotope abundance in Figure 6 (the standard model with ranging between 0.5 and 0.7).
The p-isotopes that satisfy the above condition are listed in the last column of Table 4. According to recent hydrodynamic studies (Fischer et al., 2010; Hüdepohl et al., 2010), the maximum in the neutrino-driven outflows is . Therefore, the p-isotopes that satisfy the above condition only with are indicated by “[yes]”. This implies that the p-process in core-collapse supernovae is the possible astrophysical origin of the light p-nuclei up to . In principle, however, the p-process can account for the origin of the heavy p-isotopes up to as well, if (Figure 6) is achieved in the neutrino-driven outflows. If this is true, a reasonable combination of the astrophysical sources considered here can explain all the origins of the solar p-isotopes. It should be noted that most of the maximum production factors of these heavy p-nuclei are . This is three orders of magnitude larger than the above requisite value (). Thus, only of neutrino-driven ejecta with is enough to account for the origin of these heavy p-nuclei. Future multi-dimensional hydrodynamic studies of core-collapse supernovae with full neutrino transport will be of particular importance if such a condition is indeed obtained.
A word of caution for the molybdenum isotopes is needed here. The production factors of 92Mo and 94Mo satisfy the above condition only marginally with . The future measurements of the nuclear masses of 82Zr and 83Nb might in part cure this problem as discussed in § 5.3. This is rather serious for the origin of 94Mo that can be produced only by the p-process, while 92Mo can be explained by the p-QSE. Fisker et al. (2009) concluded that the ratio 92Mo/94Mo is about 5 times smaller than the solar value, when applying the proton separation energy of 93Rh in Weber et al. (2008). This might implies that 92Mo has another origin, presumably the p-QSE. We however obtain a reasonable ratio with our standard model (see, e.g., the bottom panel of Figure 22) and many other cases (see the range in Figure 6). This is due to the significant role of 92RuTc that competes with 92RuRh in our cases. This is a consequence of the values of in the present cases being about a factor of three higher than those in Pruet et al. (2006). This suggests that 92Mo/94Mo is highly sensitive to the details of supernova dynamics.
7. Summary
We investigated the effects of uncertainties in supernova dynamics as well as in nuclear data inputs on the p-process in the neutrino-driven outflows of core-collapse supernovae. The former includes the wind-termination radius (or temperature ), neutrino luminosity , neutron-star mass , and electron fraction (or , at and 3, respectively). The latter includes the reactions relevant to the breakout from the pp-chain region (), the reactions on heavy nuclei (), and the nuclear masses () on the p-process pathway. Our result is summarized as follows.
1. Wind termination of the neutrino-driven outflow by colliding with the preceding supernova ejecta causes a slowdown of the temperature decrease and thus plays a crucial role on the p-process. The termination within the temperature range of (relevant to the p-process) substantially increases the number of neutrons captured by the seed nuclei () and thus enhances efficiency of the p-nuclei production. In the current case, the efficiency is maximal at ( km for erg s-1). This implies that the early wind phase with the termination radius close to the proto-neutron star surface is favored for the p-process.
2. A lower (with the other parameters , , and unchanged) leads to more efficient p-processing. This is due to the larger entropy per nucleon for a lower , which increases the proton-to-seed ratio and thus . However, the role of the wind termination is more crucial and thus we presume that the maximum efficiency is obtained during the early phase with erg s-1.
3. A larger (with the other parameters , , and unchanged) results in a larger efficiency of the p-process. This is a consequence of the larger entropy per nucleon and the faster expansion of the neutrino-driven outflow for a larger , both of which help to increase and thus . This implies that a more massive progenitor is favored for more efficient p-processing, if other parameters remain unchanged. In reality, however, the evolutions of , , and will be dependent on the progenitor mass, making it difficult to draw definitive conclusions.
4. The p-process is highly sensitive to the electron fraction that controls at the onset of the p-process and thus . An increase of only results in . The models with (with the other parameters unchanged) produce sufficient amounts of the light p-nuclei up to . Furthermore, the models with produce the p-nuclei up to . Note that this is a combined effect of the high and the wind termination at sufficiently high temperature ( in the standard model). Our result shows no substantial enhancement of the p-nuclei with , since the nuclear flow reaches the -stability line and enters to the neutron-rich region at . This is a consequence that a large leads to the strong flows that compete with those by for .
5. Variations on the nuclear reactions relevant to the breakout from the pp-chain region (), namely of triple-, 7BeC, and 10BC affect the p-process by changing (and ) or producing intermediate-mass nuclei (proton poison) during p-processing. Among these reactions, triple- has the largest impact, although the other two show non-negligible effects, on the production of the p-nuclei at .
6. Variations on the reactions on 56Ni (seed nuclei), 60Zn, and 64Ge (first -waiting point on the classical rp-process) show great impact on efficiency of the p-process for heavy element synthesis. Only a factor of two variation leads to a factor of 10 or more changes in the production of the p-nuclei with for the first reaction (but somewhat smaller changes for the latter two reactions). This is a consequence that these reactions control the strength of the nuclear flow passing through the -waiting points (56Ni, 60Zn, and 64Ge) on the p-process path. We also find that the nucleus 96Pd plays a role of the “second seed” for production of heavier nuclei.
7. Application of the new experimental masses of Weber et al. (2008, for ) exhibits a suppression of the flow 87MoTc (), which however do not affect the nucleosynthetic p-abundances. Our sensitivity tests for unmeasured nuclear masses indicate that a future measurement of the 82Zr mass (and of 93Nb with a large estimated error) on could reduce the abundance of 84Sr by a factor of two.
8. Our result implies that, within possible ranges of uncertainties in supernova dynamics as well as in nuclear data inputs, the solar inventory of the light p-nuclei up to (108Cd) can be attributed to the p-process, including the most mysterious ones 92,94Mo and 96,98Ru. The molybdenum isotopes are, however, tend to be underproduced compared to the neighboring p-isotopes. If highly proton-rich conditions with are realized in neutrino-driven ejecta, the solar origin of the p-nuclei up to (152Gd) can be explained by the p-process.
Our explorations in this study suggest that more refinements both in supernova conditions and in nuclear data inputs are needed to elucidate the role of the p-process as the astrophysical origin of the p-nuclei. In particular, multi-dimensional studies of core-collapse simulations with full neutrino transport, as well as experiment-based rates of triple- and the reactions on heavy nuclei will be important in the future works.
References
- Aikawa et al. (2005) Aikawa, M., Arnould, M., Goriely, S., Jorissen, A., & Takahashi, K. 2005, A&A, 441, 1195
- Angulo et al. (1999) Angulo, C., et al. 1999, Nucl. Phys. A, 656, 3
- Arcones et al. (2007) Arcones, A., Janka, H.-Th., & Scheck, L. 2006, A&A, 467, 1227
- Audi, Wapstra, & Thibault (2003) Audi, G., Wapstra, A. H., & Thibault, C. 2003, Nucl. Phys. A, 729, 337
- Austin (2005) Austin, S. M. 2005, Nucl. Phys. A, 758, 375c
- Brown et al. (2002) Brown, B. A., Clement, R. R., Schatz, H., Volya, A., & Richter, W. A. 2002, Phys. Rev. C, 65, 045802
- Buras et al. (2006) Buras, R., Rampp, M., Janka, H.-Th, & Kifonidis, K. 2006, A&A, 447, 1049
- Burrows et al. (1995) Burrows, A., Hayes, J., Fryxell, B. A. 1995, ApJ, 450, 830
- Caughlan & Fowler (1988) Caughlan, G. R. & Fowler, W. A. 1988, At. Data Nucl. Data Tables, 40, 283
- Diget et al. (2005) Diget, C.Aa., et al. 2005, Nucl. Phys. A, 760, 3
- Diget et al. (2009) Diget, C.Aa., et al. 2009, Phys. Rev. C, 80, 034316
- Fischer et al. (2010) Fischer, T., Whitehouse, S. C., Mezzacappa, A., Thielemann, F.-K., Liebendörfer, M. 2010, A&A, 517, 80
- Fisker et al. (2009) Fisker, J. L., Hoffman, R. D., & Pruet, J. 2009, ApJ, 690, L135
- Fuller, Fowler, & Newman (1982) Fuller, G. M., Fowler, W. A., & Newman, M. J. 1982, ApJS, 48, 279
- Fröhlich et al. (2006a) Fröhlich, C., et al. 2006, ApJ, 637, 415
- Fröhlich et al. (2006b) Fröhlich, C., et al. 2006, Phys. Rev. Lett., 96, 142502
- Goriely et al. (2005) Goriely, S., Samyn, M., Pearson, J. M., & Onsi, M. 2005, Nucl. Phys. A, 750, 425
- Hayakawa et al. (2008) Hayakawa, T., Iwamoto, N., Kajino, T., Shizuma, T., Umeda, H., Nomoto, K. 2008, ApJ, 685, 1089
- Hayakawa et al. (2010) Hayakawa, S., et al. 2010, 10th International Symposium on Origin of Matter and Evolution of Galaxies (OMEG2010), AIP conference proceedings, vol. 1269, 104
- Hoffman et al. (1996) Hoffman, R. D., Woosley, S. E., Fuller, G. M., & Meyer, B. S. 1996, ApJ, 460, 478
- Hüdepohl et al. (2010) Hüdepohl, L., Müller, B., Janka, H.-Th., Marek, A., Raffelt, G. G 2010, Phys. Rev. Lett., 104, 251101
- Janka & Müller (1995) Janka, H.-T. & Müller, E. 1995, ApJ, 448, L109
- Janka & Müller (1996) Janka, H.-T. & Müller, E. 1996, A&A, 306, 167
- Janka, Buras, & Rampp (2003) Janka, H.-Th., Buras, R., & Rampp, M. 2003, Nucl. Phys. A, 718, 269
- Kitaura, Janka, & Hillebrandt (2006) Kitaura, F. S., Janka, H.-Th., & Hillebrandt, W. 2006, A&A, 450, 345
- Kuroda, Wanajo, & Nomoto (2008) Kuroda, T., Wanajo, S., & Nomoto, K. 2008, ApJ, 672, 1068
- Langanke & Martinez-Pinedo (2001) Langanke, K. & Martinez-Pinedo, G. 2001, At. Data Nucl. Data Tables, 79, 1
- Liebendörfer et al. (2003) Liebendörfer, M., Mezzacappa, A., Messer, O. E. B., Martinez-Pinedo, G., Hix, W. R., & Thielemann, F.-K. 2003, Nucl. Phys. A, 719, 144
- Lodders (2003) Lodders, K. 2003, ApJ, 591, 1220
- McLaughlin, Fuller, & Wilson (1996) McLaughlin, G. C., Fuller, G. M., & Wilson, J. R. 1996, ApJ, 472, 440
- Meyer (1995) Meyer, B. S. 1995, ApJ, 449, L55
- Meyer, McLaughlin, & Fuller (1998a) Meyer, B. S., McLaughlin, G. C., & Fuller G. M. 1998, Phys. Rev. C, 58, 3696
- Meyer et al. (1998b) Meyer, B. S., Krishnan, T. D., & Clayton, D. D. 1998, ApJ, 498, 808
- Müller, Janka, & Dimmelmeier (2010) Müller, B., Janka, H.-Th., & Dimmelmeier, H. 2010, ApJS, 189, 104
- Nomoto & Hashimoto (1988) Nomoto, K. & Hashimoto, M. 1988, Phys. Rep., 163, 13
- Otsuki et al. (2000) Otsuki, K., Tagoshi, H., Kajino, T., & Wanajo, S. 2000, ApJ, 533, 424
- Panov & Janka (2009) Panov, I. V. & Janka, H.-Th. 2009, A&A, 494, 829
- Pruet et al. (2006) Pruet, J., Hoffman, R. D., Woosley, S. E., Buras, R., & Janka, H.-Th. 2006, ApJ, 644, 1028
- Prantzos et al. (1990) Prantzos, N., Hashimoto, M., Rayet, M., & Arnould, M. 1990, A&A, 238, 455
- Qian & Woosley (1996) Qian, Y. -Z. & Woosley, S. E. 1996, ApJ, 471, 331
- Rauscher et al. (2002) Rauscher, T., Heger, A., Hoffman, R. D., & Woosley, S. E. 2002, ApJ, 576, 323
- Rauscher et al. (1997) Rauscher, T., Thielemann, F.-K., & Kratz, K.-L. 1997, Phys. Rev. C, 56, 1613
- Rauscher (2010) Rauscher, T. 2010, Phys. Rev. C, 81, 045807
- Rayet et al. (1995) Rayet, M., Arnould, M., Hashimoto, M., Prantzos, N., & Nomoto, K. 1995, A&A, 298, 517
- Schatz et al. (2001) Schatz, H, et al. 2001, Phys. Rev. Lett., 86, 3471
- Seitenzahl et al. (2008) Seitenzahl, I. R., Timmes, F. X., Marin-Lafleche, A., Brown, E., Magkotsios, G., & Truran, J. 2008, ApJ, 685, L129
- Tachibana, Yamada, & Yoshida (1990) Tachibana, T., Yamada, M., & Yoshida, Y. 1990, Progr. Theor. Phys., 84, 641
- Timmes & Swesty (2000) Timmes, F. X. & Swesty, F. D. 2000, ApJS, 126, 501
- Wagoner (1969) Wagoner, R. V. 1969, ApJS, 18, 247
- Wallace & Woosley (1981) Wallace, R. K. & Woosley, S. E. 1981, ApJS, 45, 389
- Wanajo et al. (2001) Wanajo, S., Kajino, T., Mathews, G. J., & Otsuki, K. 2001, ApJ, 554, 578
- Wanajo (2006) Wanajo, S. 2006, ApJ, 647, 1323
- Wanajo (2007) Wanajo, S. 2007, ApJ, 666, L77
- Wanajo et al. (2009) Wanajo, S., Nomoto, K., Janka, H.-T., Kitaura, F. S., Müller, B. 2009, ApJ, 695, 208
- Weber et al. (2008) Weber, C., et al. 2008, Phys. Rev. C, 78, 054310
- Woosley et al. (1990) Woosley, S. E., Hartmann, D. H., Hoffman, R. D., & Haxton, W. C. 1990, ApJ, 356, 272
- Woosley & Howard (1978) Woosley, S. E. & Howard, W. M. 1978, ApJS, 36, 285
- Woosley et al. (1994) Woosley, S. E., Wilson, J. R., Mathews, G. J., Hoffman, R. D., & Meyer, B. S. 1994, ApJ, 433, 229
| aa at . | bbtime elapsed from to . | cctime elapsed from to . | ddtemperature (in units of 109 K) just after the wind-termination. | ee at . | ffproton-to-seed ratio at . | ggmaximum production factor. | nuc()hhnuclide at . | nuc()iinuclide at the largest with . | Fig. | |||||||
|---|---|---|---|---|---|---|---|---|---|---|---|---|---|---|---|---|
| [] | [erg s-1] | [100 km] | [] | [] | [ms] | [ms] | ||||||||||
| 1.4 | 52.0 | 3.00 | 0.600 | 2.70 | 57.0 | 17.5 | 245 | 2.19 | 0.550 | 124 | 0.0834 | 10.3 | 7.16 | 96Ru | 106Cd | all |
| 1.4 | 52.0 | 1.00 | 0.600 | 2.70 | 57.0 | 359 | 1160 | 5.19 | 0.509 | 1.78 | 0.135 | 0.240 | 4.44 | 64Zn | 74Se | 2 |
| 1.4 | 52.0 | 2.00 | 0.600 | 2.70 | 57.0 | 17.5 | 516 | 2.95 | 0.550 | 124 | 0.138 | 17.1 | 6.27 | 78Kr | 84Sr | 2 |
| 1.4 | 52.0 | 2.31 | 0.600 | 2.70 | 57.0 | 17.5 | 403 | 2.65 | 0.550 | 124 | 0.114 | 14.1 | 7.67 | 106Cd | 108Cd | 2 |
| 1.4 | 52.0 | 3.00 | 0.600 | 2.70 | 57.0 | 17.5 | 245 | 2.19 | 0.550 | 124 | 0.0834 | 10.3 | 7.16 | 96Ru | 106Cd | 2 |
| 1.4 | 52.0 | 4.00 | 0.600 | 2.70 | 57.0 | 17.5 | 117 | 1.80 | 0.550 | 124 | 0.0628 | 7.79 | 6.86 | 84Sr | 102Pd | 2 |
| 1.4 | 52.0 | 5.00 | 0.600 | 2.70 | 57.0 | 17.5 | 44.0 | 1.55 | 0.550 | 124 | 0.0529 | 6.56 | 6.69 | 84Sr | 84Sr | 2 |
| 1.4 | 52.0 | 10.0 | 0.600 | 2.70 | 57.0 | 17.5 | 30.0 | 1.21 | 0.550 | 124 | 0.0431 | 5.34 | 6.13 | 78Kr | 84Sr | 2 |
| 1.4 | 52.0 | 0.600 | 2.70 | 57.0 | 17.5 | 30.0 | —- | 0.550 | 124 | 0.0323 | 4.01 | 5.79 | 78Kr | 84Sr | 2 | |
| 1.4 | 52.4 | 8.01 | 0.600 | 31.3 | 33.7 | 22.8 | 261 | 2.19 | 0.558 | 42.7 | 0.0611 | 2.61 | 6.00 | 78Kr | 84Sr | 3 |
| 1.4 | 52.2 | 4.29 | 0.600 | 8.66 | 44.7 | 18.9 | 236 | 2.19 | 0.554 | 78.3 | 0.0720 | 5.64 | 6.83 | 84Sr | 96Ru | 3 |
| 1.4 | 52.0 | 3.00 | 0.600 | 2.70 | 57.0 | 17.5 | 245 | 2.19 | 0.550 | 124 | 0.0834 | 10.3 | 7.16 | 96Ru | 106Cd | 3 |
| 1.4 | 51.8 | 2.22 | 0.600 | 0.921 | 70.1 | 17.8 | 262 | 2.19 | 0.545 | 166 | 0.0945 | 15.7 | 7.78 | 102Pd | 108Cd | 3 |
| 1.4 | 51.6 | 1.71 | 0.600 | 0.339 | 83.3 | 19.9 | 301 | 2.19 | 0.540 | 185 | 0.107 | 19.8 | 7.99 | 106Cd | 108Cd | 3 |
| 1.4 | 51.4 | 1.37 | 0.600 | 0.131 | 96.3 | 24.4 | 371 | 2.19 | 0.535 | 174 | 0.121 | 21.1 | 8.07 | 106Cd | 108Cd | 3 |
| 1.2 | 52.0 | 3.27 | 0.600 | 3.96 | 46.8 | 18.4 | 241 | 2.19 | 0.553 | 84.4 | 0.0746 | 6.30 | 6.96 | 84Sr | 102Pd | 4 |
| 1.4 | 52.0 | 3.00 | 0.600 | 2.70 | 57.0 | 17.5 | 245 | 2.19 | 0.550 | 124 | 0.0834 | 10.3 | 7.16 | 96Ru | 106Cd | 4 |
| 1.6 | 52.0 | 2.80 | 0.600 | 1.94 | 68.1 | 16.4 | 244 | 2.19 | 0.547 | 178 | 0.0908 | 16.2 | 7.69 | 102Pd | 108Cd | 4 |
| 1.8 | 52.0 | 2.62 | 0.600 | 1.46 | 80.0 | 15.4 | 245 | 2.19 | 0.545 | 243 | 0.0980 | 23.8 | 7.91 | 106Cd | 108Cd | 4 |
| 2.0 | 52.0 | 2.46 | 0.600 | 1.13 | 93.0 | 14.4 | 247 | 2.19 | 0.543 | 335 | 0.104 | 34.8 | 8.12 | 108Cd | 108Cd | 4 |
| 1.4 | 52.0 | 3.00 | 0.550 | 2.70 | 57.0 | 17.5 | 245 | 2.19 | 0.523 | 42.9 | 0.0834 | 3.58 | 6.25 | 78Kr | 84Sr | 5 |
| 1.4 | 52.0 | 3.00 | 0.600 | 2.70 | 57.0 | 17.5 | 245 | 2.19 | 0.550 | 124 | 0.0834 | 10.3 | 7.16 | 96Ru | 106Cd | 5 |
| 1.4 | 52.0 | 3.00 | 0.650 | 2.70 | 57.0 | 17.5 | 245 | 2.19 | 0.576 | 245 | 0.0834 | 20.4 | 8.14 | 106Cd | 108Cd | 5 |
| 1.4 | 52.0 | 3.00 | 0.700 | 2.70 | 57.0 | 17.5 | 245 | 2.19 | 0.603 | 428 | 0.0834 | 35.7 | 8.34 | 108Cd | 120Te | 5 |
| 1.4 | 52.0 | 3.00 | 0.750 | 2.70 | 57.0 | 17.5 | 245 | 2.19 | 0.629 | 703 | 0.0834 | 58.6 | 8.54 | 138La | 138La | 5 |
| 1.4 | 52.0 | 3.00 | 0.800 | 2.70 | 57.0 | 17.5 | 245 | 2.19 | 0.655 | 1130 | 0.0834 | 94.2 | 8.37 | 138La | 152Gd | 5 |
| Species | aaRates and decay timescales at ( g cm-3, , , ). | aaRates and decay timescales at ( g cm-3, , , ). | bbRates and decay timescales at ( g cm-3, , , ). | bbRates and decay timescales at ( g cm-3, , , ). |
|---|---|---|---|---|
| [mol-1 cm3 s-1] | [ms] | [mol-1 cm3 s-1] | [ms] | |
| 7Be | 4.48 | 1.29 | 0.107 | |
| 7Be | ||||
| 10B | ||||
| 10B | ||||
| 11C | ||||
| 12C | ||||
| 13C | ||||
| 56Ni | 11.3 | 454 | ||
| 60Zn | 2.46 | 85.5 | ||
| 64Ge | 2.65 | 94.8 | ||
| 68Se | 1.94 | 71.8 | ||
| 72Kr | 1.32 | 46.9 | ||
| 76Sr | 1.00 | 34.6 | ||
| 80Zr | 0.913 | 30.4 | ||
| 84Mo | 1.26 | 44.5 | ||
| 96Pd | 8.84 | 351 |
| reaction | factor | aaproton-to-seed ratio at . | bb at . | ccmaximum production factor. | nuc()ddnucleus at . | nuc()eenucleus at the largest with . | Fig. |
|---|---|---|---|---|---|---|---|
| standard | 1.00 | 124 | 10.3 | 7.16 | 96Ru | 106Cd | all |
| 3 | 1.00fftriple- rate from Angulo et al. (1999). | 25.6 | 2.14 | 6.47 | 78Kr | 84Sr | 12 |
| 3 | 2.00 | 73.5 | 6.13 | 6.93 | 84Sr | 102Pd | 12 |
| 3 | 10.0 | 25.2 | 2.10 | 6.15 | 78Kr | 84Sr | 12 |
| 3 | 1/2.00 | 204 | 17.0 | 7.67 | 102Pd | 108Cd | 12 |
| 3 | 1/10.0 | 482 | 40.2 | 8.04 | 108Cd | 108Cd | 12 |
| 3 | 1/100 | 719 | 60.0 | 8.02 | 108Cd | 120Te | 12 |
| 7Be(, ) | 2.00 | 124 | 10.3 | 7.11 | 96Ru | 106Cd | 13 |
| 7Be(, ) | 10.0 | 122 | 10.2 | 6.98 | 96Ru | 106Cd | 13 |
| 7Be(, ) | 100 | 117 | 9.76 | 6.89 | 84Sr | 106Cd | 13 |
| 7Be(, ) | 1/2.00 | 124 | 10.3 | 7.19 | 96Ru | 106Cd | 13 |
| 7Be(, ) | 1/10.0 | 124 | 10.3 | 7.24 | 102Pd | 106Cd | 13 |
| 10B(, ) | 2.00 | 119 | 9.92 | 7.09 | 96Ru | 106Cd | 14 |
| 10B(, ) | 10.0 | 112 | 9.34 | 6.96 | 96Ru | 106Cd | 14 |
| 10B(, ) | 1/2.00 | 129 | 10.8 | 7.23 | 102Pd | 106Cd | 14 |
| 10B(, ) | 1/10.0 | 135 | 11.3 | 7.35 | 102Pd | 106Cd | 14 |
| 56Ni(, ) | 2.00 | 124 | 10.3 | 7.01 | 96Ru | 106Cd | 16 |
| 56Ni(, ) | 10.0 | 124 | 10.3 | 7.02 | 84Sr | 102Pd | 16 |
| 56Ni(, ) | 1/2.00 | 124 | 10.3 | 7.45 | 102Pd | 106Cd | 16 |
| 56Ni(, ) | 1/10.0 | 124 | 10.3 | 7.92 | 106Cd | 108Cd | 16 |
| 60Zn(, ) | 2.00 | 124 | 10.3 | 7.15 | 96Ru | 106Cd | 19 |
| 60Zn(, ) | 10.0 | 124 | 10.3 | 7.15 | 96Ru | 106Cd | 19 |
| 60Zn(, ) | 1/2.00 | 124 | 10.3 | 7.22 | 102Pd | 106Cd | 19 |
| 60Zn(, ) | 1/10.0 | 124 | 10.3 | 7.51 | 102Pd | 108Cd | 19 |
| 64Ge(, ) | 2.00 | 124 | 10.3 | 7.16 | 96Ru | 106Cd | 20 |
| 64Ge(, ) | 10.0 | 124 | 10.3 | 7.16 | 96Ru | 106Cd | 20 |
| 64Ge(, ) | 1/2.00 | 124 | 10.3 | 7.19 | 102Pd | 106Cd | 20 |
| 64Ge(, ) | 1/10.0 | 124 | 10.3 | 7.41 | 102Pd | 108Cd | 20 |
| Species | AbundanceaaLodders (2003); Si | fractionbbLodders (2003); relative to its elemental abundance [%] | -processccRayet et al. (1995) (nuclei indecated by “[yes]” are those underproduced in Rauscher et al. (2002)) | -processddWoosley et al. (1990) | p-QSEeeWanajo et al. (2009) | p-processffThis work (nuclei indicated by “[yes]” are produced only with ) |
|---|---|---|---|---|---|---|
| 74Se | 0.58 | 0.889 | yes | no | yes | yes |
| 78Kr | 0.20 | 0.362 | yes | no | yes | yes |
| 84Sr | 0.13124 | 0.5551 | yes | no | yes | yes |
| 92Mo | 0.386 | 14.8362 | no | no | yes | yes |
| 94Mo | 0.241 | 9.2466 | no | no | no | yes |
| 96Ru | 0.1053 | 5.542 | no | no | no | yes |
| 98Ru | 0.0355 | 1.8688 | no | no | no | yes |
| 102Pd | 0.0146 | 1.02 | no | no | no | yes |
| 106Cd | 0.01980 | 1.25 | no | no | no | yes |
| 108Cd | 0.01410 | 0.89 | no | no | no | yes |
| 113In | 0.0078 | 4.288 | no | no | no | [yes] |
| 112Sn | 0.03625 | 0.971 | [yes] | no | no | [yes] |
| 114Sn | 0.02460 | 0.659 | [yes] | no | no | [yes] |
| 115Sn | 0.01265 | 0.339 | no | no | no | [yes] |
| 120Te | 0.0046 | 0.096 | [yes] | no | no | [yes] |
| 124Xe | 0.00694 | 0.129 | [yes] | no | no | [yes] |
| 126Xe | 0.00602 | 0.112 | yes | no | no | [yes] |
| 130Ba | 0.00460 | 0.1058 | yes | no | no | [yes] |
| 132Ba | 0.00440 | 0.1012 | yes | no | no | [yes] |
| 138La | 0.000397 | 0.09017 | no | yes | no | [yes] |
| 136Ce | 0.00217 | 0.186 | yes | no | no | [yes] |
| 138Ce | 0.00293 | 0.251 | yes | no | no | [yes] |
| 144Sm | 0.00781 | 3.0734 | yes | no | no | [yes] |
| 152Gd | 0.00067 | 0.2029 | no | no | no | [yes] |
| 156Dy | 0.000216 | 0.056 | [yes] | no | no | no |
| 158Dy | 0.000371 | 0.096 | [yes] | no | no | no |
| 162Er | 0.000350 | 0.137 | [yes] | no | no | no |
| 164Er | 0.004109 | 1.609 | [yes] | no | no | no |
| 168Yb | 0.000323 | 0.13 | yes | no | no | no |
| 174Hf | 0.000275 | 0.1620 | yes | no | no | no |
| 180Ta | 0.00000258 | 0.0123 | yes | yes | no | no |
| 180W | 0.000153 | 0.1198 | yes | no | no | no |
| 184Os | 0.000133 | 0.0198 | yes | no | no | no |
| 190Pt | 0.000185 | 0.013634 | yes | no | no | no |
| 196Hg | 0.00063 | 0.15344 | yes | no | no | no |