Magnetic properties and electronic structures of intermediate valence systems CeRhSi2 and Ce2Rh3Si5
Abstract
The crystal structures and the physical (magnetic, electrical transport and thermodynamic) properties of the ternary compounds CeRhSi2 and Ce2Rh3Si5 (orthorhombic CeNiSi2- and U2Co3Si5-type structures, respectively) were studied in wide ranges of temperature and magnetic field strength. The results revealed that both materials are valence fluctuating systems, in line with previous literature reports. Direct evidence for valence fluctuations was obtained by means of Ce LIII-edge x-ray absorption spectroscopy and Ce 3d core-level x-ray photoelectron spectroscopy. The experimental data were confronted with the results of ab-initio calculations of the electronic band structures in both compounds.
pacs:
75.20.Hr; 75.30.Mb; 78.70.Dm; 78.70.En; 71.28.+d1 Introduction
The system Ce–Rh–Si is known to be exceptionally rich in ternary phases, which scan a full spectrum of magnetic behavior related to the hybridization of cerium electronic states with and states of neighboring atoms. The most intensively studied has been so far the tetragonal compound CeRh2Si2 that is considered as an archetypal example of pressure-induced superconductivity emerging from magnetically ordered state [1]. At ambient pressure, the electrons in CeRh2Si2 are well localized and give rise to an antiferromagnetic ordering setting in at = 36 K that is followed by a change of the magnetic structure at = 25 K [2]. Under high pressure one observes a gradual suppression of the Néel temperature down to absolute zero in the vicinity of the critical pressure 1 GPa [3]. Most interestingly, in the quantum critical region near the compound becomes superconducting below = 0.5 K [3, 4]. Simultaneously, the Fermi surface topology varies abruptly and the cyclotron mass measured in de Haas – van Alphen experiment increases rapidly, hence manifesting a change in character of the electrons, which become itinerant in the critical region [5]. Another pressure-induced superconductor among the Ce–Rh–Si ternaries is CeRhSi3 [1]. At ambient pressure, this tetragonal compound orders antiferromagnetically at = 1.6 K and behaves as a Kondo lattice with the characteristic temperature of about 100 K [6]. In contrast to the case of CeRh2Si2, in an applied pressure does not change monotonically: it first increases up to 1.9 K near 0.8 GPa and then decreases down to 1.1 K near 2.6 GPa without further change at higher pressures [8]. Most importantly, superconductivity appears in this compound already under small pressures and coexists with the antiferromagnetic ordering in the entire pressure range studied, with the critical temperature gradually rising up to 1.1 K with increasing pressure [8]. Above 2.6 GPa, merges with [7, 8]. Moreover, in the vicinity of this pressure, pronounced non-Fermi liquid features are observed in all the bulk properties. The occurrence of superconductivity in CeRhSi3 is highly peculiar, as the crystal structure of this compound lacks an inversion symmetry [8]. Apparently, CeRhSi3 is another member of a novel family of unconventional non-centrosymmetric superconductors with the most prominent representative being CePt3Si [9]. Likely, mixed spin-triplet pairing symmetry in CeRhSi3 is responsible for extremely large upper critical magnetic field = 30 T measured in a magnetic field applied along the crystallographic -axis, its very unusual temperature dependence, as well as strong anisotropy of (cf. = 7 T for -axis) [10].
Motivated by the intriguing physics in CeRh2Si2 and CeRhSi3, we started systematic investigations of the physical behavior in other ternaries from the Ce–Rh–Si phase diagram. Recently, we reported on very complex magnetic properties of the orthorhombic compound CeRh3Si2, marked by two subsequent antiferromagnetic phase transitions at = 4.7 K and = 4.5 K, multiple metamagnetic transitions in the ordered state, and huge magnetocrystalline anisotropy being quite uncommon for Ce-based intermetallics [11]. In turn, for hexagonal Ce2RhSi3 we provided evidence of Kondo lattice behavior with the characteristic temperature 9 K, which coexists below = 4.5 K with long-range antiferromagnetic ordering [12]. Remarkably, by means of bulk and spectroscopic measurements, the cerium electrons were found to be well localized in both compounds.
An entirely opposite character of the states may be expected for the silicides CeRhSi2 and Ce2Rh3Si5, which have been reported in the literature as valence fluctuating systems [13, 14, 15, 16]. The former compound crystallizes with an orthorhombic crystal structure of the CeNiSi2-type. Its unit cell volume does not follow the lanthanide contraction established for the RhSi2 ( = La, Pr, Nd) series. The magnetic susceptibility of CeRhSi2 shows a non-Curie-Weiss temperature variation with a broad maximum near 80 K. The electrical resistivity is proportional to the squared temperature below about 50 K, while above 100 K it decreases slightly with increasing temperature. These features of the bulk magnetic and electrical behaviors reflect instability of the Ce ions’ valence. The Coqblin-Schrieffer approach applied to the magnetic data of CeRhSi2 yielded the characteristic temperature = 309 K ( is related to the Kondo temperature via the Wilson number, ). In turn, analysis of the resistivity data in terms of the Freimuth model gave estimates for the spin-fluctuation temperature = 147 K and the position of the band with respect to the Fermi energy = 30 K. The valence fluctuating nature of CeRhSi2 has also been concluded in an independent study reported in Ref. [14]. The other compound of our interest, i.e. Ce2Rh3Si5, was studied in less details. It was reported to form with the orthorhombic U2Co3Si5-type structure as a member of the 2Rh3Si5 ( = La–Er) family. As the lattice parameters of its unit cell follow the lanthanide contraction along the series it was concluded in Ref. [15] that the Ce ions in this compound are trivalent. On the other hand, the same authors reported nearly temperature independent magnetic susceptibility of Ce2Rh3Si5, and in order to reconcile their contradicting findings they speculated that the ground state in this compound is nonmagnetic because of the presence of ’virtual’ spin fluctuations, which however do not destabilize the charge state of the Ce ions. The electrical transport properties of Ce2Rh3Si5 were reported in Ref. [16]. In the temperature range 2-30 K, the resistivity was shown to vary as , and interpreted as being governed by interband scattering. Nonmagnetic character of Ce2Rh3Si5 was also inferred from the heat capacity data, which show featureless temperature behavior up to 30 K and strongly reduced entropy .
In this work we reinvestigated the magnetic and electrical transport properties of CeRhSi2 and Ce2Rh3Si5. Moreover, we measured for the first time the specific heat of both materials in a wide temperature range 0.35-300 K, and performed x-ray absorption spectroscopy (XAS) and x-ray photoelectron spectroscopy (XPS) studies. The experimental data are discussed in the context of the calculated electronic structures. Altogether, the obtained results confirm the valence fluctuating nature of both compounds.
2 Experimental and computational details
Polycrystalline samples of CeRhSi2 and Ce2Rh3Si5 were prepared by arc melting stoichiometric amounts of the elemental components (Ce - 3N, Ames Laboratory, Rh - 3N, Chempur and Si - 6N, Chempur) in a copper-hearth furnace installed inside a glove-box filled with ultra-pure argon gas with continuously controlled partial pressures of O2 and H2O to be lower than 1 ppm. The buttons were flipped over and remelted several times to ensure good homogeneity. The weight losses after the final melting were negligible (less than 0.2%).
The quality of the obtained alloys was checked by x-ray powder diffraction on an X’pert Pro PanAnalytical diffractometer with CuKα radiation and by energy dispersive x-ray (EDX) analysis using a Phillips 515 scanning electron microscope equipped with an EDAX PV 9800 spectrometer. Both techniques proved single-phase character of the Ce2Rh3Si5 sample, with the expected stoichiometry and crystal structure. In the case of CeRhSi2, however, some small admixture of CeRh2Si2 was evidenced in the x-ray pattern and the EDX spectrum. The structural refinements were done employing the program FULLPROF [17].
Magnetic susceptibility measurements were performed in the temperature range 1.72-800 K in magnetic fields of 0.5 T using a Quantum Design superconducting quantum interference device (SQUID) magnetometer. The heat capacity and the electrical resistivity were measured within the temperature interval 2-300 K using a Quantum Design PPMS platform.
The x-ray photoelectron spectroscopy experiments were carried out at room temperature using a Physical Electronics PHI 5700/660 spectrometer with monochromatized AlK radiation (1486.6 eV). The spectra were collected on parallelepiped-shaped specimens broken in-situ in high vacuum of the order of Torr.
The measurements of the x-ray absorption spectroscopy at the Ce-LIII threshold were performed at several different temperatures at the EXAFS-1 beamline C of the Hamburger Synchrotronstrahlungslabor (HASYLAB/DESY) using a fixed-exit double-crystal Si (111) monochromator. In these studies CeO2 and CeF3 were used as the internal standards. The energy scans were made step-by-step with an energy resolution of approx. 1 eV. The absorption spectra were calculated by from the x-ray intensities , , detected by ionization chambers in front and behind the irradiated flat sample. A peak to background ratio = 0.6 at the Ce-LIII white line was realized with powdered samples of about 16 mg, which were ground with small amounts of B4C and fixed with paraffin wax on a 1 cm2 window of the flat copper sample holder. Temperatures from the range 5-293 K were obtained by a He-gas flow cryostat showing thermal stabilities of K during typical measuring dwell times of 20 minutes.
The electronic structure calculations were performed within density functional theory [18] using the full-potential local-orbital minimum-basis band structure scheme (FPLO) [19] and the full potential linearized augmented plane wave (LAPW) method implemented in the latest version (WIEN2k) of the original WIEN code [20]. The FPLO calculations were performed in the fully-relativistic mode and the LSDA (the local spin density approximation) exchange-correlation potential was assumed in the form proposed by Perdew and Wang [21]. In the Wien2k code calculations the scalar relativistic approach was implemented with the spin-orbit interactions taken into account using the second variational method [22]. Two different exchange-correlation potentials in the generalized gradient approximations (GGA) were tested, in the forms proposed by Perdew et al. [23] as well as Wu and Cohen [24]. Furthermore, to improve the description of the strongly correlated 4 electrons, the on-site Coulomb energy U correction was introduced within the LSDA+U approach [25]. The value of Ueff was chosen equal to 6 eV [26]. The number of k-points was 8000 in the Brillouin zone (BZ), which corresponds to at least 1100 points in the irreducible wedge of the BZ for all systems and methods of calculations. For BZ integration a tetrahedron method was used [27]. The self-consistent criterion was equal to at least 10-6 Ry for the total energy. The calculations were performed for lattice constants and atomic positions in the unit cells as given in the IIIA section.
The theoretical photoemission spectra (XPS) were obtained from the calculated densities of electronic states (DOS) convoluted by Gaussian with a half-width ( equal to 0.3 eV and scaled using the proper photoelectronic cross sections for partial states [28].
3 Results and discussion
3.1 Crystal structures
The compound CeRhSi2 was reported in the literature to crystallize with an orthorhombic structure of the CeNiSi2-type [13, 14]. In turn, Ce2Rh3Si5 was considered as having an orthorhombic structure isotypic to U2Co3Si5 [15, 16]. However, to the best of our knowledge, for none of these two phases were any details on the atomic positions in the unit cells reported. Therefore, the x-ray powder diffraction data obtained in the present study as part of characterization of the samples quality were used to refine the crystal structures of both compounds.
For CeRhSi2, the refined lattice parameters are = 4.2615(3) Å, = 16.7469(9) Åand = 4.1751(3) Å, in good agreement with those given in Ref. [14]. The crystal structure belonging the space group was refined down to the residuals = 3.4% and = 5.3%. The obtained atomic coordinates are given in Table 1, together the values of equivalent isotropic thermal displacement parameters for all the atoms. The compound was thus confirmed to be isostructural with CeNiSi2. Detailed discussion of this crystal structure can be found in the literature, e.g. in the original paper [29]. For the purpose of this work it is enough to note that the unit cell contains one position of Ce atoms, which are coordinated by four Rh atoms at a distance of 3.226 Å, four Si1 atoms at a distance of 3.163 Å, and two Si2 atoms at a distance of 3.167 Å.
As for Ce2Rh3Si5, the unit cell of the U2Co3Si5-type (space group ) has also been corroborated. The crystal structure was refined down to the residuals = 2.3% and = 3.1%. The obtained lattice parameters are = 9.8949(3) Å, = 11.7576(3) Åand = 5.8114(1) Å. These values differ only slightly from those reported in Refs. [15, 16]. The atomic coordinates and the equivalent isotropic thermal displacement parameters are collected in Table 2. In the unit cell of Ce2Rh3Si5 there is one position of Ce atom that is surrounded by one Rh2 atom at a distance of 3.138 Å, two Rh2 atoms at a distance of 3.161 Å, one Rh2 atom at a distance of 3.375 Å, two Rh1 atoms at a distance of 3.381 Åand one Rh2 atom at a distance of 3.399 Å. The nearest neighbors silicon atoms are located at the distances: 3.022 Å(one Si3 atom), 3.111 Å(two Si3 atoms), 3.129 Å(one Si1 atom), 3.148 Å(one Si3 atom), 3.199 Å(two Si2 atoms) and 3.233 Å(one Si2 atom). Further details on the U2Co3Si5-type crystal structure can be found in the literature (see e.g. Ref. [16]).
3.2 Magnetic properties
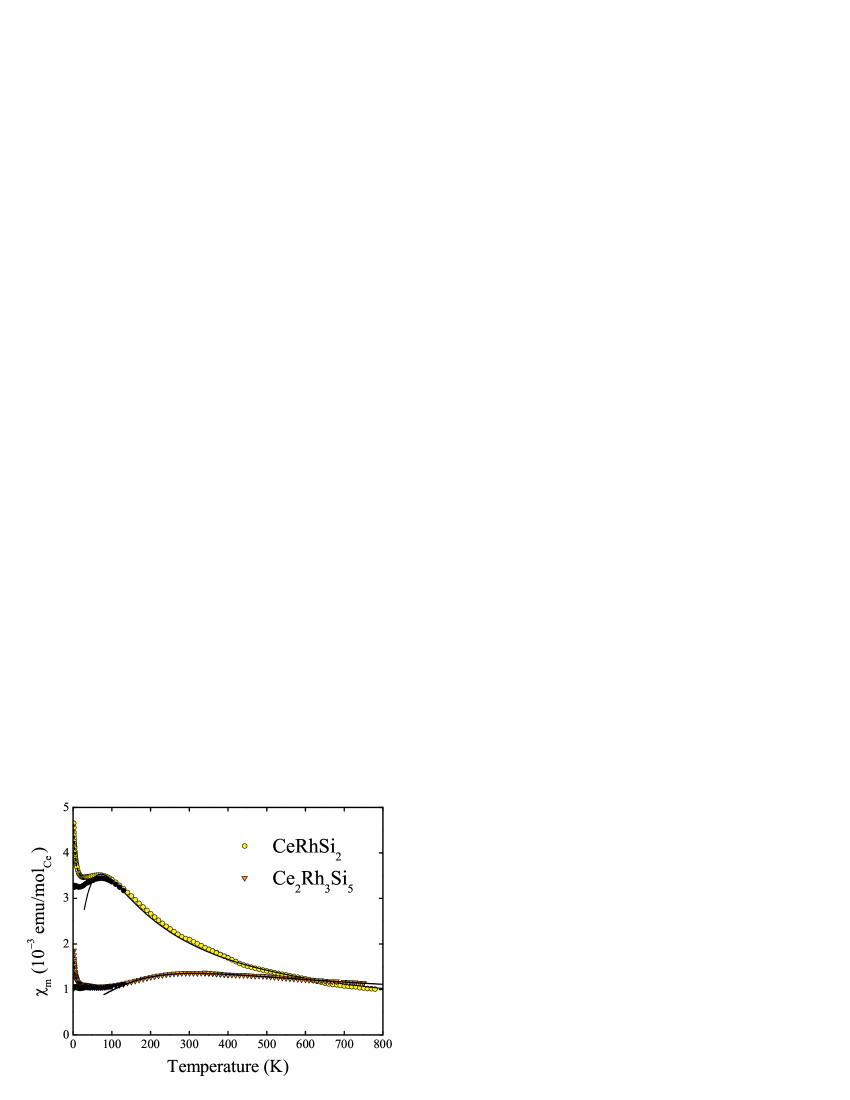
The magnetic data of CeRhSi2 and Ce2Rh3Si5 are summarized in Fig. 1. The compounds exhibit small (of the order of emu/mol per Ce atom) and weakly temperature dependent magnetic susceptibility that clearly manifests nonmagnetic character of both materials. With decreasing temperature from 800 K the susceptibility of CeRhSi2 slightly increases, goes through a broad maximum centered around 75 K and then rapidly rises below about 20 K. Similar behavior is observed for Ce2Rh3Si5, with a maximum located around 270 K and some tendency for saturation before the low-temperature upturn occurs. The overall shape of these curves is typical for Ce-based intermetallics with valence fluctuations. The position of the maximum in , , gives an estimate for the characteristic temperature , related to spin fluctuations in such compounds. From the relation [30]
| (1) |
one finds 112 K for CeRhSi2 and 405 K for Ce2Rh3Si5. Comparison of these values suggests that in these two compounds interactions of the cerium electrons with the conduction band is stronger in the latter one, in line with smaller and less temperature dependent magnetic susceptibility observed for Ce2Rh3Si5.
Low-temperature upturns in curves are commonly observed in Ce-based intermediate valence materials and their origin is usually attributed to the presence of stable Ce3+ ions located at grain boundaries or/and some contamination by paramagnetic impurities. To account for this spurious effect it is assumed that the intrinsic susceptibility of CeRhSi2 and Ce2Rh3Si5 at low temperatures is given by the formula [31]
| (2) |
in which = 0.807 emu/(mol K) stands for the Curie constant of free Ce3+ ions ( where is the Avogadro number, is the Boltzmann constant, while = 2.54 is the effective magnetic moment of the cerium state). The above-derived values of imply equal to emu/mol for CeRhSi2 and emu/mol per Ce atom for Ce2Rh3Si5. Then, the measured magnetic susceptibility can be modeled by the function
| (3) |
where the Curie term represents the contribution due to spurious Ce3+ ions in an amount of atoms per mole of the given compound. Fitting this equation to the experimental data taken below 20 K (note the dashed lines in Fig. 1) yields = and for CeRhSi2 and Ce2Rh3Si5, respectively. The magnetic susceptibility data corrected for the spurious Ce3+ ions is shown in Fig. 1 by the full symbols.
At higher temperatures the magnetic susceptibility of both compounds can be analyzed in terms of the interconfiguration fluctuations (ICF) model developed for intermediate valence systems by Sales and Wohlleben [32]. Within this approach the magnetic susceptibility of a Ce-based compound with nonmagnetic ground state is expressed as
| (4) |
where is a characteristic temperature associated with valence fluctuations between the and configurations of Ce ions, whereas stands for the temperature dependent mean occupation of the ground state that is given by the formula
| (5) |
in which denotes the energy difference between the ground and excited states. The constant term in Eq. 4 accounts for paramagnetic contribution due to conduction electrons and diamagnetic contribution due to core electrons. Fitting the ICF model to the experimental data of CeRhSi2 and Ce2Rh3Si5 resulted in reasonable descriptions of the magnetic behavior above about 50 K and 150 K, respectively (note the solid lines in Fig. 1). The parameters obtained in the least-squares fits are = 220 K, = 44 K and emu/mol for the former compound, and = 845 K, = 129 K and emu/mol for the latter one. Assuming that the highest possible valence for the cerium state is +3.30 (for a discussion see Ref. [33]), one may estimate from Eq. 5 the change of the effective valence of Ce ions with varying temperature. In the range in which the ICF model provides proper approximation of the susceptibility of the compounds studied one finds for CeRhSi2 the valence change from +3.19 at 50 K to +3.07 at 300 K and to +3.05 at 800 K, while for Ce2Rh3Si5 the change is from +3.23 at 150 K to +3.16 at 300 K and to +3.09 at 800 K.
3.3 Heat capacity
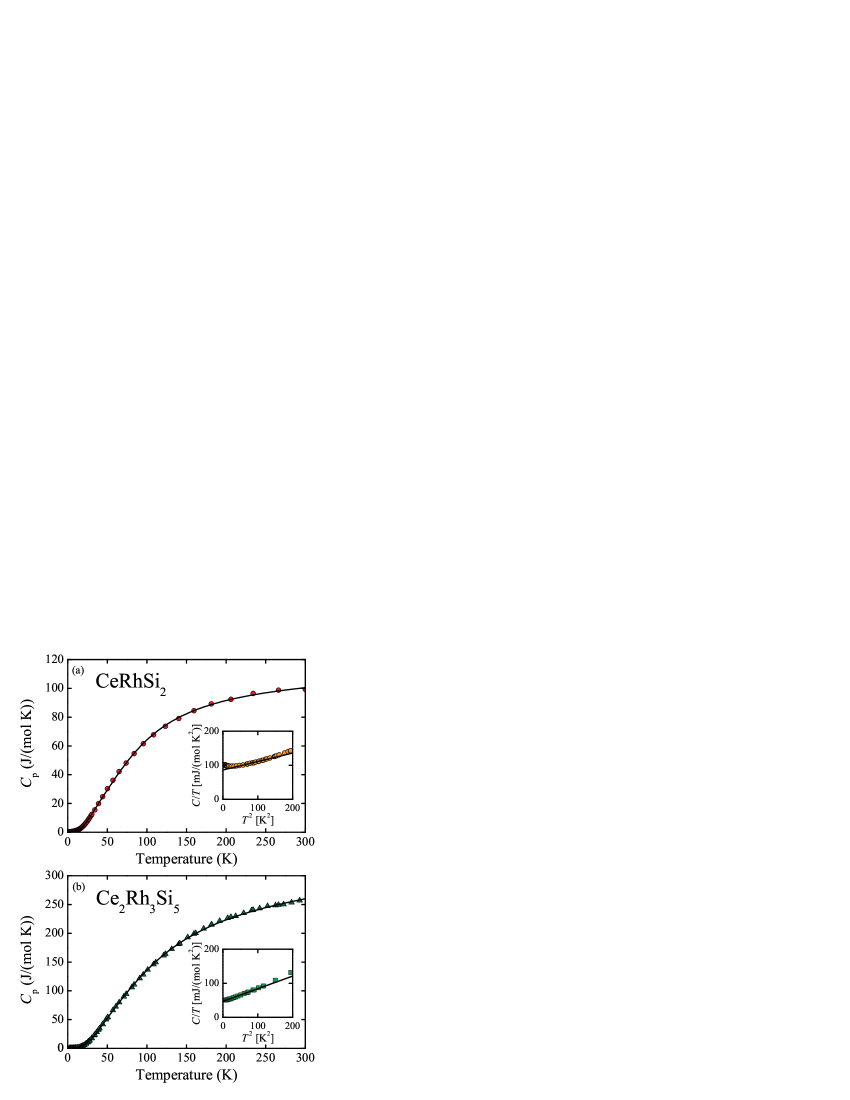
Fig. 2 displays the temperature dependences of the specific heat of CeRhSi2 and Ce2Rh3Si5. The solid lines through the experimental points are the least-squares fits of the formula:
| (6) |
where the first term is the electron specific heat , while the second one represents the phonon contribution in the form [34, 35]:
| (7) |
Here, stands for the anharmonic coefficient, is the gas constant, describes the Debye contribution of three acoustic modes (characterized by the Debye temperature ), and represents the Einstein specific heat calculated for groups with optical branches (characterized by the Einstein temperatures ). In order to avoid overparametrization of the experimental curves (Fig. 2), we reduced the number of the groups of optical branches to , which seems to be minimum to describe satisfactorily the specific heat data. In that case we found that the best results one obtains assuming multiplicity and in CeRhSi2, and and in Ce2Rh3Si5. The so-obtained explicit form of Eq. (6) applied to the experimental data above about 15 K yields for CeRhSi2 the fitting parameters: = 163 K, = 139 K, = 324 K, = 22.4 mJ/(mol K2) and 1/K. In the case of Ce2Rh3Si5 a reasonable fit to the experimental data was obtained with = 147 K, = 198 K, = 427 K, = 45.3 mJ/(mol K2) and 1/K. It is worthwhile emphasizing that the presented model does not reflect complexity of the real lattice vibrations in the two compounds, and at most gives only basic characteristics of the phonon spectra.
As can be inferred from the insets to Fig. 2, below about 12 K the experimental specific heat data can be described by a simple formula:
| (8) |
where the second term is the conventional -Debye law with the low-T Debye temperature and stands for a number of atoms in a formula unit [34, 35]. The insets to Fig. 2 present the least-squares fits of the latter formula to the measured specific heat data with the parameters = 86 mJ/(mol K2) and = 315 K for CeRhSi2 and = 47 mJ/(mol K2) and = 375 K for Ce2Rh3Si5. The obtained values of are obviously different from those obtained using previous full-range fittings since in the latter approximation only the acoustic branches are considered, and thus reflects an average characteristic temperature of the phonon spectrum. The obtained coefficients are in both compounds of the order typical for systems with valence fluctuations [36].
At low temperatures approaching the experimental limit a little upturn is observed in of CeRhSi2. This anomaly has an unknown origin and can temporarily be ascribed to the impurity phase CeRh2Si2, detected on the x-ray diffraction pattern of the sample measured. However, an intrinsic nature of the upturn can neither be excluded.
3.4 Electrical resistivity
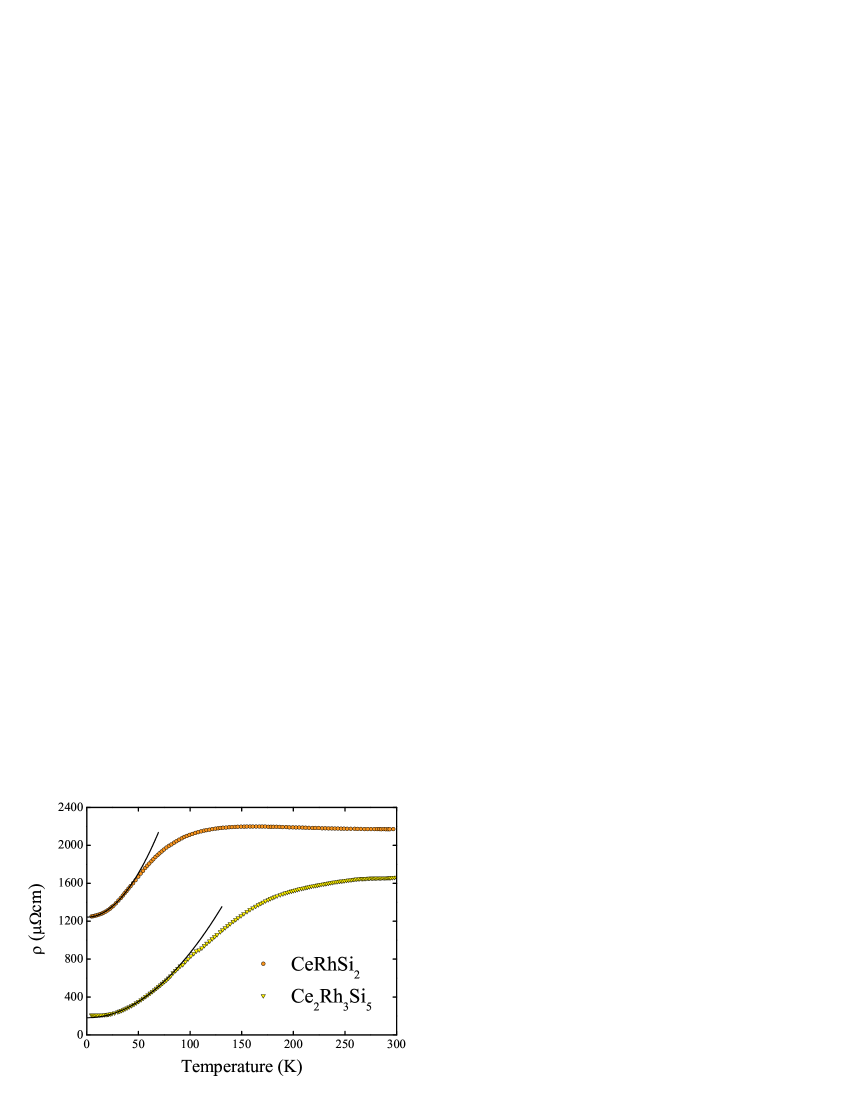
The temperature variations of the electrical resistivity of CeRhSi2 and Ce2Rh3Si5 are shown in Fig. 3. For both compounds the absolute magnitude of the resistivity is very high because of many cracks present in the specimens measured (the samples were very brittle). Therefore, quantitative discussion of the electrical behavior of these silicides is not possible. Nevertheless, it is clear that both materials exhibit metallic-like conductivity with some features characteristic of valence fluctuations systems [36]. Below 50 K for CeRhSi2 and 90 K for Ce2Rh3Si5 K the resistivity is proportional to the squared temperature, as predicted for such systems within the paramagnon model [30] (some deviations from are observed below 10 K and 20 K, respectively). At higher temperatures the curve of CeRhSi2 forms a broad shallow maximum above 100 K, while that of Ce2Rh3Si5 shows a tendency to saturate near room temperature. The observed behavior is thus fully consistent with the values of the spin fluctuation temperature 112 K and 405 K estimated from the magnetic susceptibility data for the former and the latter compound, respectively.
3.5 XAS spectra
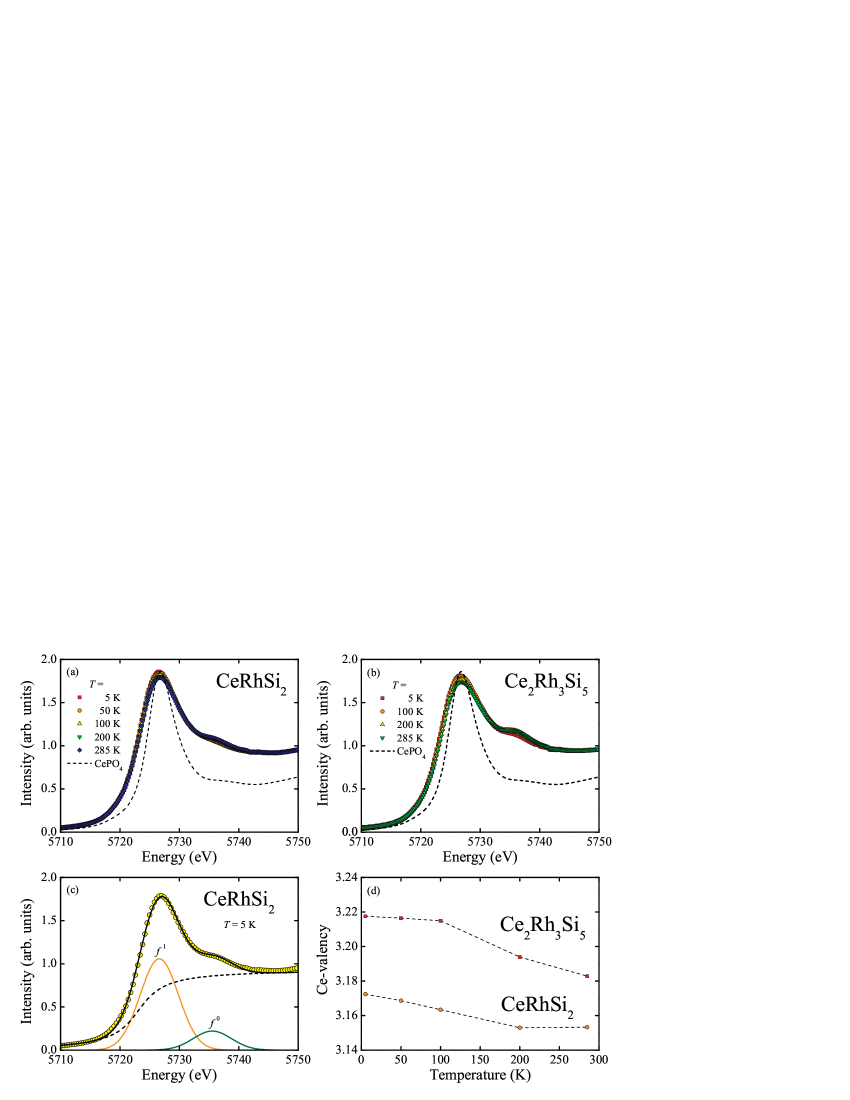
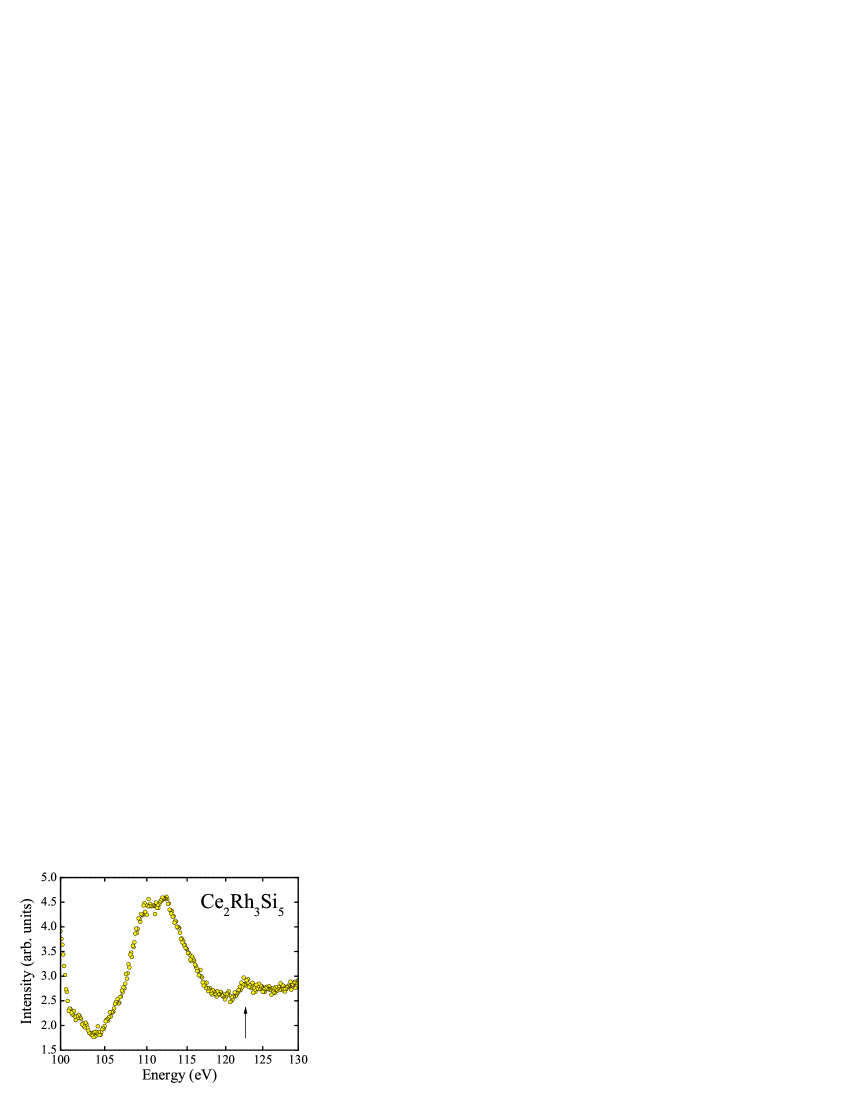
The x-ray absorption spectroscopy data obtained for CeRhSi2 and Ce2Rh3Si5 are gathered in Fig. 4. For each compound a linear baseline determined at 100 eV below the Ce-LIII absorption edge was subtracted, and the spectrum was normalized to the intensity values at = 5755 eV. The absorption spectra of both phases show one dominant white line at 5726 eV of the Ce-LIII line and several maxima with energies higher than 5750 eV in the extended x-ray absorption fine structure (EXAFS) region. The EXAFS signal is influenced by specific features of the crystal structure of the investigated compound. Comparison of the measured spectrum with that of the Ce3+ reference system CePO4 allows us to attribute the observed white line to the same dominant electronic configuration of the cerium atoms. Both phases, i.e. CeRhSi2 and Ce2Rh3Si5, thus show a mean valence of cerium ions relatively close to +3. However, the presence of an additional contribution at nearly 9 eV above the white line maximum clearly shows mixed valent behavior of the compounds investigated. Decreasing the temperature from room temperature to = 5 K leads to a small decrease in the intensity of the white line and simultaneous increase of the other peak. The observed shift of the spectral weight of the Ce-LIII white line to higher energies implies a reduced influence of the electron on the transition. This behavior manifests a gradual gain in the contribution due to the configuration, and thus reflects an increase of the mean valence of the Ce atoms with decreasing temperature.
In quantitative evaluation of the spectra measured for CeRhSi2 and Ce2Rh3Si5, two Gaussian functions were considered, which represent the and contributions, respectively (see an example presented in panel (c) of Fig. 4). Additionally, an arctan-function was added in order to account for the contribution due to transitions of the electrons to the conduction band. Analyzing the relative increase of the peak with decreasing temperature one obtains for CeRhSi2 the mean valence of Ce ions changing from +3.15 at room temperature to +3.17 at 5 K (see Fig. 4d). Similar calculation performed for Ce2Rh3Si5 yields the valence increase from +3.18 at 280 K to +3.22 at 5 K (cf. Fig. 4b).
3.6 XPS spectra
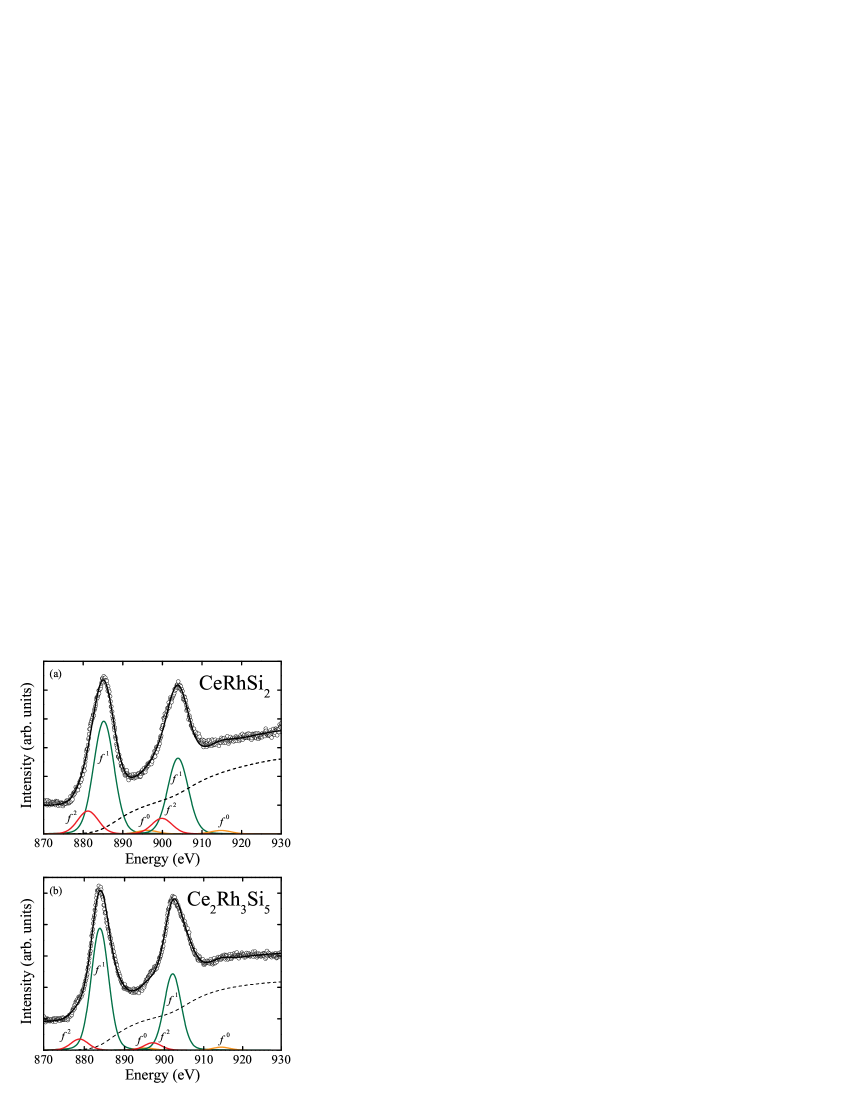
The XPS spectra of the 3 core levels usually provide some detailed information about the 4 shell configurations and the -conduction-electron hybridization. The calculations by Gunnarsson and Schönhammer [38] indicate that a large hybridization potential, , is necessary to explain the observed spectra for several Ce-intermetallic compounds, which often show different final states depending on the occupation of the shell: , , and (see Ref. [39]). Due to the spin-orbit (SO) interaction there are two sets of Ce 3 photoemission lines in the spectrum attributed to the and components of the final states, with an intensity ratio . The main photoemission lines originating from Ce3+ are labeled as .
The final state components appears when the core hole becomes screened by an additional electron, which is possible due to the hybridization of the Ce shell with the conduction electrons. Consequently, the components in the Ce XPS spectra are attributed within the Gunnarsson-Schönhammer model to the -conduction electron hybridization energy . describes the hybridization part of the Anderson impurity Hamiltonian [40], where is the maximum in the DOS and V is the hybridization matrix element. It is possible to estimate from the ratio , calculated as a function of in Ref. [39], when the peaks of the Ce 3 XPS spectra that overlap are separated.
Fig. 5 shows the Ce 3 XPS spectra of CeRhSi2 () and Ce2Rh3Si5 (). The separation of the overlapping peaks in the spectra was done on the basis of Doniach-Šunjić theory [41]. A background, calculated using the Tougaard algorithm [42], was subtracted from the XPS data. The estimated value of the SO splitting equals 18.6 eV. In Fig. 5 each SO set of the Ce photoemission lines consists of contributions marked as , , and . The intensity ratio for CeRhSi2 and for Ce2Rh3Si5. This intensity ratio gives for CeRhSi2 and Ce2Rh3Si5 a crude estimate of a hybridization width meV and meV, respectively. The estimated energy for Ce2Rh3Si5 is twice as large as the value for CeRhSi2, which suggests a lower occupation number of the shell in Ce2Rh3Si5.
In order to determine the ground state occupation from the XPS spectra we use Fig. 4 and 6 of Ref. [39], where the dependence of the ratio on the occupation is shown for different . Relative intensities of magnitude for CeRhSi2 and for Ce2Rh3Si5 corresponds to value of the order 0.95 and 0.93, respectively. The Ce XPS spectra, however, allow an estimate of the occupation number (and of the energy ) within an accuracy of the order of 20%. The errors due to the uncertainties in the intensity ratios we discussed previously [43].
We note, however, that the value obtained from the Ce 3 XPS spectra is smaller than that estimated from the X-ray absorption spectra either for CeRhSi2 or Ce2Rh3Si5. This discrepancy show immediately that the final-state occupation is a different function of the initial-state occupancy for each type of spectroscopy (see Ref. [44]). We note, however, that the value for CeRhSi2 is larger than derived for Ce2Rh3Si5.
3.7 Electronic band structure
The band structure calculations performed using two distinct approaches, i.e. with FPLO and FP-LAPW, yielded very similar results and therefore only those obtained by using the Wien2k code are discussed below. The latter method gives also an opportunity to go beyond LDA using L(S)DA+U approach. The calculations were performed with and without spin polarization. The spin-polarized calculations were started with finite initial magnetic moments in order to promote magnetic solutions. However, the self-consistent results for magnetic solutions were nearly same as those for nonmagnetic ones. In all the tests performed, the magnetic moments on cerium atoms were always below 10-7 /Ce atom for both CeRhSi2 and Ce2Rh3Si5.
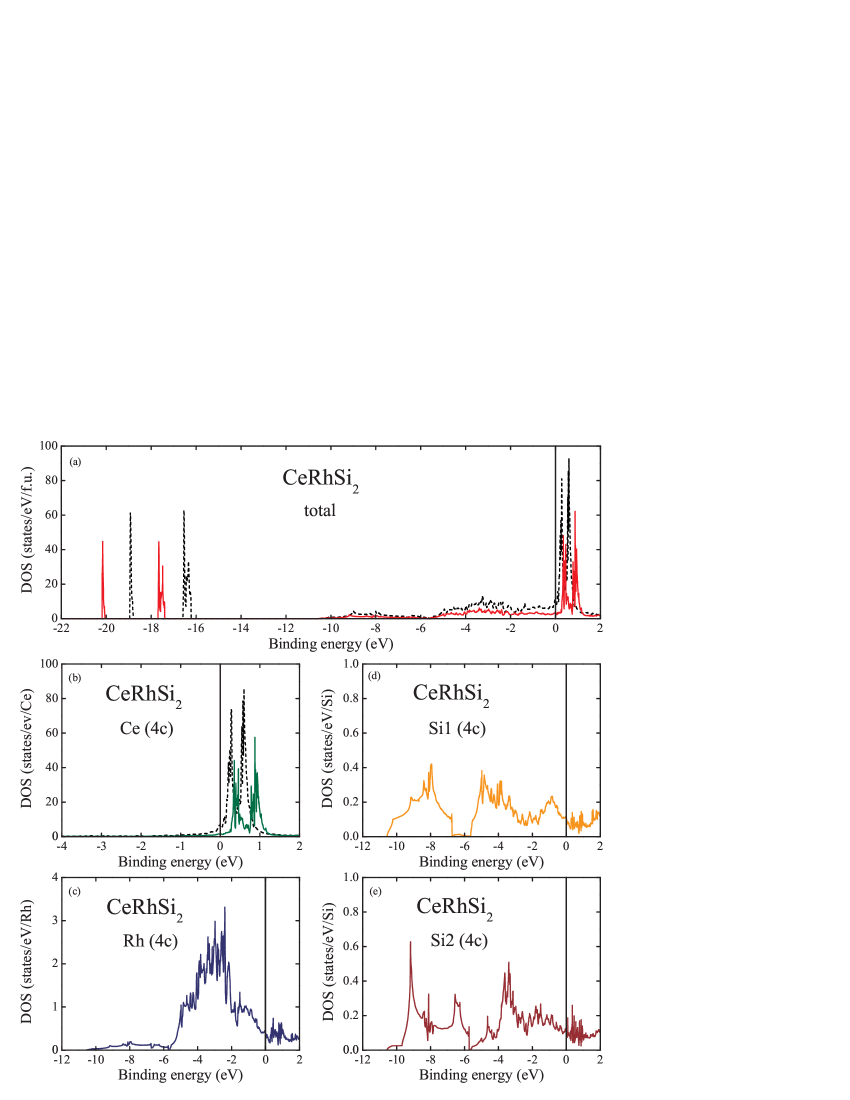
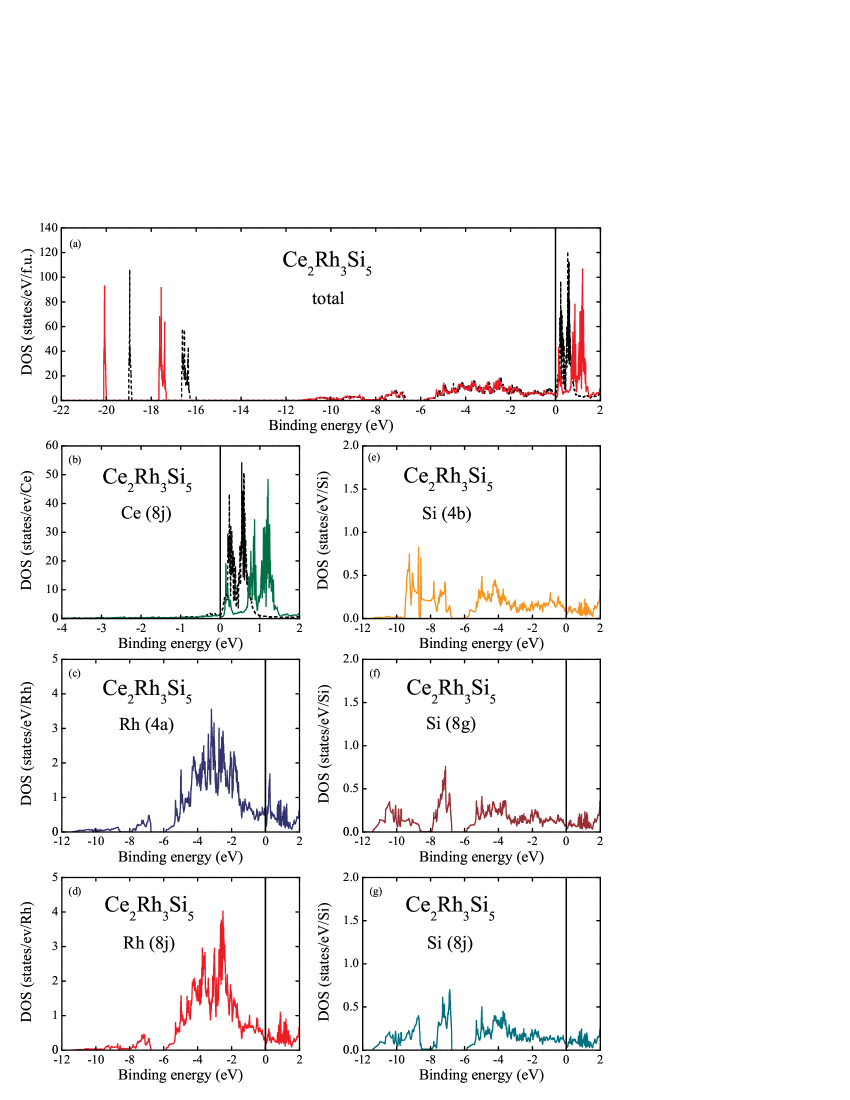
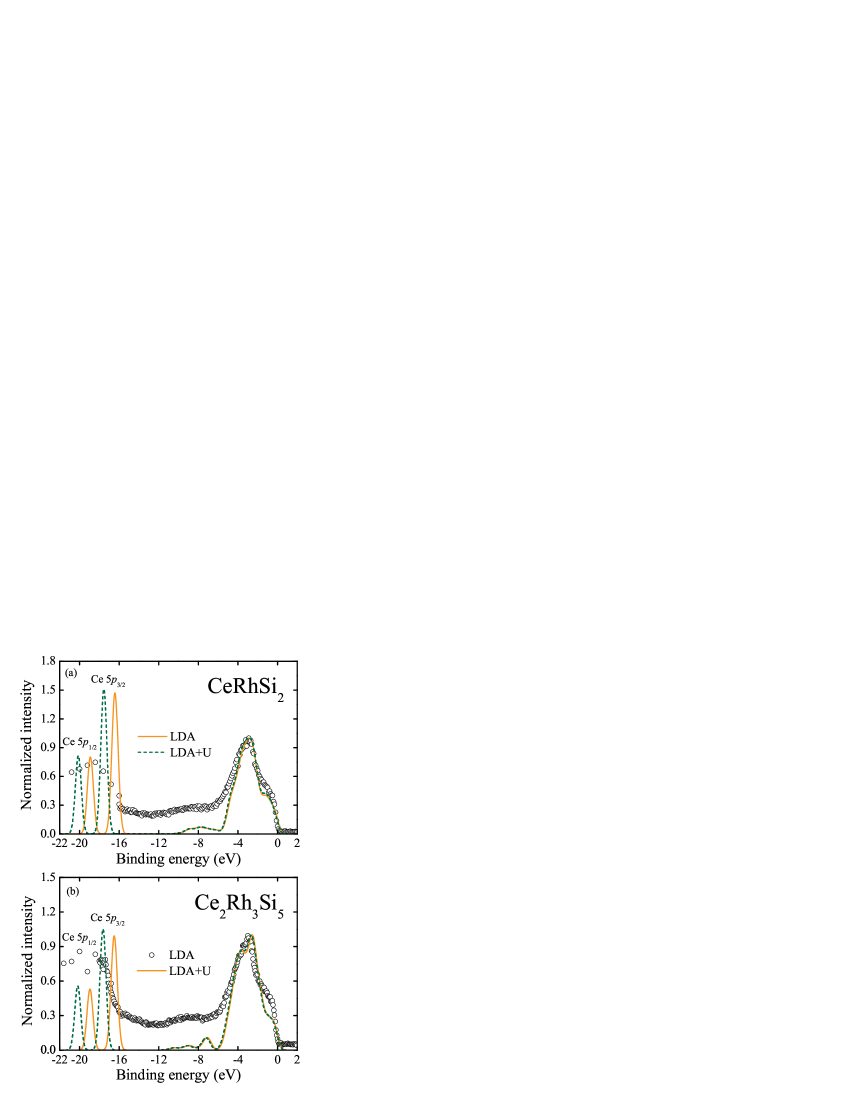
The calculated densities of states (DOS) for the compounds CeRhSi2 and Ce2Rh3Si5 are presented in Figs. 7 and 8, respectively. In both cases the DOS plots can be divided into three parts below the Fermi level (EF = 0). The first part located below -16 eV is composed of two peaks formed by the Ce(5p1/2) and Ce(5p3/2) electrons. It should be noticed that the LDA+U peaks are shifted towards higher binding energies. As will be discussed below, this shift improves consistency between the calculated and measured X-ray photoelectron spectra, hence justifying the LDA+U approach. The second part, located between about -6 and -11 eV, is formed mainly by electrons of the Rh and Si atoms. The third part, which is the main one of the valence bands, is located between the Fermi level and about -6 eV of binding energy. The main contribution to these subbands is provided by electrons located on the Rh atoms and Si(3p) electrons. A small contribution comes also from Ce(5d) electrons, but less than one electron per Ce atom. The Ce(4f) electrons form a narrow band with the center of gravity above the Fermi level. Most of the band is empty, and within the LDA scheme the number of occupied Ce(4f) states below Ef is equal to 0.92 for both systems. The LDA+U calculations change the electronic structure in a way that the Ce(4f) band is slightly shifted above EF and consequently the number of Ce(4f) electrons is reduced to 0.57 and 0.61 for CeRhSi2 and Ce2Rh3Si5, respectively. For the former compound, the occupation of electrons inside the atomic sphere of Ce atom is given by the LDA approach as 6s1.985d0.644f0.92 and by the LDA+U calculations as 6s1.995d0.814f0.57. These results should be compared with the configurations 6s25d14f1 and 6s25d24f0 of Ce+3 and Ce+4 ions, respectively. Apparently, the calculated occupancies are intermediate between those characteristic for stable valence ions. Similarly, the results were obtained for Ce2Rh3Si5, which are 6s1.985d0.674f0.92 and 6s1.995d0.824f0.61 for LDA and LDA+U calculations, respectively, also indicate distinct deviation from the stable valence configuration. This effect may be caused by additional charge transfer from/to rhodium and silicon atoms as well as by the charge accumulated in interstitial regions between atomic spheres.
The total DOS at EF and the main contributions of particular atoms are summarized in Table 3. The main contributions, about 50%, to the total DOS at EF are provided by Ce(4f) electrons. Based on the DOS at EF one can calculate the Sommerfeld coefficient , to be equal to about 11.6 and 11.2 mJ/(mol K2) for CeRhSi2 and Ce2Rh3Si5, respectively, obtained within the LDA approach and 3.7 and 6.5 mJ/(mol K2), respectively, obtained with the LDA+U approach. Comparison of these values to the experimental ones ( = 86 and 47 mJ/(mol K2, for the two compounds respectively) yields the mass enhancement factors =(/)-1, which are also collected in Table 3.
Fig. 9 presents the X-ray photoelectron spectra of CeRhSi2 and Ce2Rh3Si5, calculated from the DOS data using the cross sections reported in Ref. [28]. For comparison, the experimental XPS spectra are also shown. Apparently, the calculated results are quite consistent with the experimental ones. It should be noted that the LDA+U approach better describes the measured spectra for both systems, as judged from the distinct differences in the region of the Ce(5p) peaks.
4 Summary
The macroscopic and spectroscopic results obtained in this work for CeRhSi2 and Ce2Rh3Si5 unambiguously corroborate intermediate valent character of both compounds. Mutually comparing the properties of these two phases it is worth noting that the effective valence of Ce ion in CeRhSi2 is closer to +3 than in the other silicide in the entire temperature range studied. In both compounds the electronic ground state of cerium is , yet the energy distance to the excited magnetic state, , is smaller in CeRhSi2 and hence the magnetic susceptibility of this compound is larger and more temperature dependent than the susceptibility of the other one. Furthermore, stronger hybridization of the electronic states with the conduction states in Ce2Rh3Si5 is clearly reflected in larger values of the characteristic spin and charge fluctuation temperatures and . Similar conclusions as regards the valence states in the two compounds can be derived from the XAS and XPS results. The mean occupation of the 4 state is smaller in Ce2Rh3Si5 and less temperature dependent than in the other silicide, in line with the bulk magnetic data. The experimental XPS spectra can be fairly well reproduced by ab-initio electronic band structure calculations, which yielded nonmagnetic ground state in both compounds with significant mass enhancements due to strong electronic correlations.
References
References
- [1] P. Thalmeier, G. Zwicknagl, O. Stockert, G. Sparn, and F. Steglich, in Frontiers in Superconducting Materials (Ed.) A. V. Narlikar (Springer-Verlag, Berlin, 2005) pp. 109-182.
- [2] S. Kawarazaki, M. Sato, Y. Miyako, N. Chigusa, K. Watanabe, N. Metoki, Y. Koike, and M. Nishi, Phys. Rev. B 61, 4167 (2000).
- [3] R. Movshovich, T. Graf, D. Mandrus, J. D. Thompson, J. L. Smith, and Z. Fisk, Phys. Rev. B 53, 8241 (1996).
- [4] S. Araki, M. Nakashima, R. Settai, T. C. Kobayashi, and Y. Onuki, J. Phys.: Condensed Matter 14, L377 (2002).
- [5] S. Araki, R. Settai, T. C. Kobayashi, H. Harima, and Y. Onuki, Phys. Rev. B 64, 224417 (2001).
- [6] Y. Muro, D. Eom, N. Takeda, and M. Ishikawa, J. Phys. Soc. Jpn. 67, 3601 (1998).
- [7] N. Kimura, K. Ito, K. Saitoh, Y. Umeda, H. Aoki, and T. Terashima, Phys. Rev. Lett. 95, 247004 (2005).
- [8] N. Kimura, Y. Muro, and H. Aoki, J. Phys. Soc. Jpn. 76, 051010 (2007).
- [9] E. Bauer, G. Hilscher, H. Michor, Ch. Paul, E. W. Scheidt, A. Gribanov, Yu. Seropegin, H. Noël, M. Sigrist, and P. Rogl, Phys. Rev. Lett. 92, 027003 (2004).
- [10] N. Kimura, K. Ito, H. Aoki, S. Uji, and T. Terashima, Phys. Rev. Lett. 98, 197001 (2007).
- [11] D.Kaczorowski and T.Komatsubara, Physica B 403, 1362 (2008); A. P. Pikul and D. Kaczorowski, Acta Phys. Polon. A 115, 235 (2009).
- [12] M. Szlawska, D. Kaczorowski, A. Ślebarski, L. Gulay, and J. Stepień-Damm, Phys. Rev. B 79, 134435 (2009).
- [13] D. T. Adroja and B. D. Rainford, J. Magn. Magn. Mater. 119, 54 (1993).
- [14] B. Chevalier, P. Rogl, K. Hiebl, and J. Etourneau, J. Solid State Chem. 107, 327 (1993).
- [15] C. Godart, C. V. Tomy, L. C. Gupta, and R. Vijayaraghavan, Solid State Commun. 67, 677 (1988).
- [16] S. Ramakrishnan, N. G. Patil, Aravind D. Chinchure, and V. R. Marathe, Phys. Rev. B 64, 064514 (2001).
- [17] J. Rodriguez-Carvajal, Physica B 192, 55 (1993).
- [18] P. Hohenberg and W. Kohn, Phys. Rev. 136, B864 (1964).
- [19] K. Koepernik, H. Eschrig, Phys. Rev. B 59, 1743 (1999).
- [20] P. Blaha, K. Schwarz, G. K. H. Madsen, D. Kvasnicka and J. Luitz, WIEN2k, An Augmented Plane Wave + Local Orbitals Program for Calculating Crystal Properties (Karlheinz Schwarz, Techn. Universit t Wien, Austria), 2001. ISBN 3-9501031-1-2
- [21] J.P. Perdew and Y. Wang, Phys. Rev. B 45, 13244 (1992).
- [22] A.H. MacDonald, W.E. Pickett and D.D. Koelling, J. Phys. C 13, 2675 (1980).
- [23] J.P. Perdew, S. Burke and M. Ernzerhof, Phys. Rev. Let. 77, 3865 (1996).
- [24] Z. Wu, R. Cohen, Phys. Rev. B 73, 235116 (2006); F. Tran, R. Laskowski, P. Blaha and K. Schwarz, Phys. Rev. B 75, 115131 (2007).
- [25] V.I. Anisimov, I.V. Solovyev, M.A. Korotin, M.T. Czyzyk, and G.A. Sawatzky, Phys. Rev. B 48, 16929 (1993); A.I. Liechtenstein, V. I. Anisimov, J. Zaanen, Phys. Rev. B 52, R5467 (1995).
- [26] V.I. Anisimov and O. Gunnarsson, Phys.Rev. B 43, 7570 (1991).
- [27] P. E. Blöchl, O. Jepsen, and O. K. Andersen, Phys. Rev. B 49, 16223 (1994).
- [28] J.J. Yeh, I. Lindau, Atom. Data Nucl. Data Tables 32, 1 (1985).
- [29] O. I. Bodak and E. I. Gladyshevsky, Kristallografiya, 14, 990 (1969) [Sov. Phys.-Crystallogr. 14, 859 (1970)].
- [30] J. M. Lawrence, P. S. Riseborough, and R. D. Parks, Rep. Prog. Phys. 44, 1 (1981).
- [31] M. T. Béal-Monod and J. M. Lawrence, Phys. Rev. B 21, 5400 (1980).
- [32] B. C. Sales and D. K. Wohlleben, Phys. Rev. Lett. 35, 1240 (1975).
- [33] J. Röhler, in Handbook on the Physics and Chemistry of Rare Earths, edited by K. A. Gschneidner, Jr., L. Eyring, and S. Hüfner (North-Holland, Amsterdam, 1987), Vol. 10, p. 453.
- [34] E. S. R. Gopal, Specific Heats at Low Temperatures, (Plenum, New York, 1996).
- [35] C. Kittel, Introduction to Solid State Physics, 8th Edition (Willey, New Caledonia, 2005).
- [36] D. Wohlleben and B. Wittershagen, Adv. Phys. 34, 403 (1985).
- [37] T. Moriya, Spin Fluctuations in Itinerant Electron Magnetism (Springer, Berlin, 1985).
- [38] O. Gunnarsson and K. Schönhammer, Phys. Rev. B 28, 4315 (1983).
- [39] J.C. Fuggle, F.U. Hillebrecht, Z. Zolnierek, R. Lässer, Ch. Freiburg, O. Gunnarsson, and K. Schönhammer, Phys. Rev. B 27, 7330 (1983).
- [40] P. W. Anderson, Phys. Rev. 124, 41 (1961).
- [41] S. Doniach and M. Šunjić, J. Phys. C 3, 286 (1970).
- [42] S. Tougaard and P. Sigmund, Phys. Rev. B 25, 4452 (1982).
- [43] A. Ślebarski, T. Zawada, J. Spałek, and A. Jezierski, Phys. Rev. B 70, 235112 (2004).
- [44] E. Wuilloud, H. R. Moser, W.-D. Schneider, and Y. Baer, Phys. Rev. B 28, 7354 (1983).
- [45] A. J. Signorelli and R. G. Hayes, Phys. Rev. B 8, 81 (1973)
- [46] Y. Baer, R. Hauger, Ch. Zürcher, M. Campagna, and G. K. Wertheim, Phys. Rev. B 18, 4433 (1978).
| Atom | Site | x | y | z | U(eq) |
|---|---|---|---|---|---|
| Ce | 4c | 0 | 0.8945(1) | 0.75 | 0.0108(6) |
| Rh | 4c | 0.5 | 0.8211(1) | 0.25 | 0.037(1) |
| Si1 | 4c | 0 | 0.5427(7) | 0.75 | 0.032(4) |
| Si2 | 4c | 0.5 | 0.7477(5) | 0.75 | 0.010(3) |
| Atom | Site | x | y | z | U(eq) |
|---|---|---|---|---|---|
| Ce | 8j | 0.2668(1) | 0.1305(1) | 0 | 0.0072(3) |
| Rh1 | 4a | 0 | 0 | 0.75 | 0.0097(6) |
| Rh2 | 8j | 0.3923(1) | 0.1386(2) | 0.5 | 0.0108(4) |
| Si1 | 4b | 0.5 | 0 | 0.75 | 0.018(2) |
| Si2 | 8g | 0 | 0.2218(4) | 0.75 | 0.017(2) |
| Si3 | 8j | 0.1574(6) | 0.1095(6) | 0.5 | 0.021(2) |
| Compound | Type od | Total | Ce(4f) | Rh1(4d) | Rh2(4d) | ||
|---|---|---|---|---|---|---|---|
| calculations | |||||||
| CeRhSi2 | LDA | 4.92 | 11.60 | 6.4 | 2.87 | 0.32 | - |
| LDA+U | 1.58 | 3.72 | 22.1 | 0.67 | 0.16 | - | |
| Ce2Rh3Si5 | LDA | 4.73 | 11.15 | 3.2 | 1.19 | 0.55 | 0.19 |
| LDA+U | 2.74 | 6.46 | 6.3 | 0.61 | 0.27 | 0.15 |