Structure, mass and stability of galactic disks
Abstract
In this review I concentrate on three areas related to structure of disks in spiral galaxies. First I will review the work on structure, kinematics and dynamics of stellar disks. Next I will review the progress in the area of flaring of HI layers. These subjects are relevant for the presence of dark matter and lead to the conclusion that disk are in general not ‘maximal’, have lower ratios than previously suspected and are locally stable w.r.t. Toomre’s criterion for local stability. I will end with a few words on ‘truncations’ in stellar disks.
1 Stellar disks
The structure and general properties of stellar disks have been reviewed in some detail by Ken and myself at previous honorary symposia (e.g. van der Kruit, 2002; Freeman, 2007). The radial distribution of surface brightness can be approximated by an exponential (Freeman, 1970) and the vertical distribution with an isothermal sheet (van der Kruit & Searle, 1981a) with a scaleheight that is independent of galactocentric distance. A more general form is (van der Kruit, 1988)
| (1) |
This ranges from the isothermal distribution () to the exponential function () and allows for more realistic stellar distribution that are not exactly isothermal in . From actual fits in and de Grijs et al. (1997) found
| (2) |
A detailed study by de Grijs & Peletier (1997) has shown that the constancy of the vertical scaleparameter is very accurate in late-type spiral disks, but in early-types it may increase, in an extreme case by as much as 50% per scalelength .
The origin of the exponential nature of stellar disks is still uncertain. Freeman (1970, 1975) already pointed out that the distribution of angular momentum in a self-gravitating exponential disk resembles that of the uniform, uniformly rotating sphere (Mestel, 1963). This also holds for an exponential density distribution with a flat rotation curve (Gunn, 1982; van der Kruit, 1987), so that a model with collapse with detailed conservation of angular momentum (see also Fall & Efstathiou, 1980) would give a natural explanation for the exponential nature of disks (and maybe their truncations; see below). However, bars or other non-axisymmetric structures may induce severe redistribution of angular momentum; the work on the effects of nonaxisymmetric instabilities on the secular evolution of disks and their structural parameters by Debattista et al. (2007) shows the potential of such approaches.
The distribution of the scale parameters is most easily studied in edge-on galaxies. Following on from the studies by van der Kruit & Searle (1981a, b, 1982a), an extensive sample of edge-on galaxies has been studied by de Grijs (1998), and has been re-analysed by Kregel et al. (2002). The scale parameters correlate well with the rotation velocity of the galaxy, e.g. for the scaleheight
| (3) |
with a scatter of 0.21 kpc. This could be useful to find a statistical estimate of the thickness of disks in galaxies that are not seen edge-on. The flattest galaxies (largest ratio of and ) appear to be those with late Hubble type, small rotation velocity and faint (face-on) surface brightness.
2 Stellar kinematics
At the basis of the analysis of the vertical dynamics of a stellar disk we have the Poisson equation for the case of axial symmetry and at low (e.g. Oort, 1965)
| (4) |
For a flat rotation curve and , so the plane-parallel case becomes an excellent approximation (van der Kruit & Freeman, 1986) . The equation of hydrostatic equilibrium
| (5) |
relates the vertical velocity dispersion of the old stars to the surface density so that if the mass-to-light ratio is constant with radius, the exponential radial surface brightness distribution implies that should decline as the squareroot of or also as an exponential with radius, but with an e-folding of twice the scalelength (the constant in eqn. (5) varies between 3/2 for an exponential with in eqn. (1) to 2 for an isothermal distribution with ). This was first tested in face-on spirals by van der Kruit & Freeman (1984, 1986), where the prediction was verified in detail in NGC 5347; in fact, the e-folding of was 2.40.6 photometric scalelengths. Many studies have since confirmed this decrease of with radius (e.g. Bottema, 1993; Kregel et al., 2004, 2005, and references therein).
There are two recent developments that have a very strong impact on this issue. The first is the use of integral field units that enable a more complete sampling of the disks. The so-called Disk Mass Project (Verheijen et al., 2007; Westfall et al., 2008) aims at a mapping of the stellar vertical velocity dispersion in this manner in about 40 face-on spiral galaxies. As above this will provide a kinematic measurement of the mass surface density of stellar disks. Not many results have appeared in the literature yet, but recent conference presentations show that the ‘kinematics follows the light’, i.e. the velocity dispersions drop off according to the manner described above with constant . The actual values indicate relatively low mass-to-light ratios that are well below those required for maximum disk fits (see below).
This result is also obtained in the other recent development, which is the use of planetary nebulae as test particles in disks (Herrmann & Ciardullo, 2009) of five face-on spirals. This method allows the velocity dispersion of these representative stars of the old disk population to be measured out to large radii. In general the findings are the same: except for one system, the is constant out to about three radial scalelengths of the exponential disks. Outside that radius the velocity dispersion stops declining and becomes flat with radius. Possible explanations these authors put forward for this behavior include an increase in the disk mass-to-light ratio, an increase in the importance of the thick disk, and heating of the thin disk by halo substructure. They also find that the disks of early type spirals have higher values of and are closer to maximum disk than later-type spirals.
There is certainly support from stellar dynamics that in general there are no substantial gradients in mass-to-light ratios in disks. The rather low values that are obtained currently do not require large amounts of material unaccounted for, as was found originally by Kapteyn (1922) and Oort (1932).
The stellar velocity dispersions in the plane are more complicated to determine from observations. The radial and tangential ones are not independent, but governed by the local Oort constants: . This results from the axis ratio of the epicyclic motion that describes stellar orbits deviating little from circular. The frequency in the epicycle is and its axis ratio (Oort, 1965). For a flat rotation curve , so (the ‘axis ratio of tghe velocity ellipsoid’) is 0.71 and .
In highly inclined or edge-on systems the dispersions can be meaured both from the line profiles and the asymmetric drift equation
| (6) |
where the circular velocity can be measured with sufficient accuracy from the gas (optical emission lines or HI observations), which have velocity dispersions of order 10 km/s or less and therefore very little asymmetric drift ().
The radial dispersion plays an important role in the Toomre (1964) -criterion for local stability in galactic disks
| (7) |
with the local mass surface density. On small scales local stability results from a Jeans-type stability, where the tendency to collapse under gravity is balanced by the kinetic energy in random motions, but only up to a certain (Jeans) scale. On large scales, shear as a result of galactic differential rotation provides stability. In the Toomre -criterion the smallest scale for this is just equal to the Jeans scale, so that that local stabiltiy exists on all scales. According to Toomre (1964), local stability requires . Numerical simulations suggest that galaxy disks have 1.5–2.5 and are on the verge of instability (Hohl, 1971; Sellwood & Carlberg, 1984; Athanassoula & Sellwood, 1986; Mihos et al., 1997; Bottema, 2003).
The first study where an attempt was made to measure these velocity dispersions was by van der Kruit & Freeman (1986) on the highly inclined galaxy NGC 7184. They fitted their data using two different assumptions for the radial dependence of the radial velocity dispersion, one being that the axis ratio of the velocity ellisoid is the same everywhere, and the other that Toomre is constant with radius. Over the range from the center of one or two scalelengths the assumptions work out to similar variations (see van der Kruit, 1990, page 196).
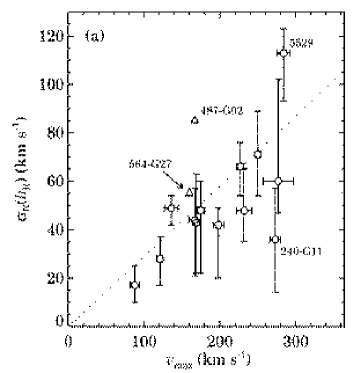
More extensive observations on a sample of 12 galaxies (including the Milky Way Galaxy from Lewis & Freeman, 1989) by Bottema (1993) resulted in the discovery of a relation between a fiducial value of the velocity dispersion (either the vertical one measured at or extrapolated to the center or the radial velocity dispersion at one schalelength) and the integrated luminosity or the rotation velocity (equivalent through the Tully-Fisher relation). This has been confirmed (see fig. 1) by Kregel & van der Kruit (2005) and Kregel et al. (2005):
| (8) |
It actually extends to small dwarf galaxies, e.g. 19 km sec-1 in UGC 4325 (Swaters, 1999, chapter 7). Interestingly, the scatter in this relation is not random. Galaxies below the relation (with lower velocity dispersions) have higher flattening, lower central surface brightness or dynamical mass () to disk luminosity ratio.
t]
The linear relation follows from straightforward arguments (van der Kruit 1990; Bottema 1993; van der Kruit & de Grijs 1999). We evaluate now properties at one radial scalelength (). For a flat rotation curve and eliminating using a Tully-Fisher relation results in
| (9) |
This shows that when and are constant among galaxies, the Bottema relation itself results and galaxy disks with lower (face-on) central surface brightness have lower stellar velocity dispersions than the mean.
3 Mass-to-light ratios and ‘maximum disk’
t]
For a disk that is exponential in both the radial and vertical direction (cf. van der Kruit, 1988):
| (10) |
Assuming a constant axis ratio of the velocity ellipsoid , we find
| (11) |
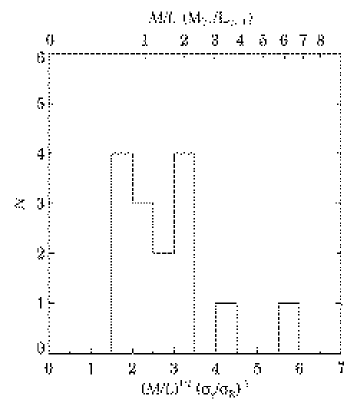
The distribution of the products in the Kregel et al. (2005) sample is shown in fig. 2. Thirteen of the fifteen disks have 1.8 3.3. The values of the outliers may have been overestimated (see Kregel et al., 2005). Excluding these, the average is 2.50.2 with a scatter of 0.6. The near constancy of the product can be used with based on stellar population synthesis models to estimate the axis ratio of the velocity ellipsoid. Conversely, the upper scale of Fig. 2 indicates that a typical (-band) of a galactic stellar disk is of order unity and varies for the majority systems between 0.5 and 2.
It is possible to relate the axis ratio of the velocity ellipsoid to the flattening of the stellar disk (van der Kruit & de Grijs, 1999). In the radial direction the velocity dispersion is related to the epicyclic frequency through the Toomre parameter for local stability. The Tully-Fisher relation then relates this to the integrated magnitude and hence to the disk scalelength. In the vertical direction the scaleheight and the velocity dispersion relate through hydrostatic equilibrium.
Eqn. (9) shows that when and are constant among galaxies, disks with lower (face-on) central surface brightness have lower stellar velocity dispersions. Combining eqn. (9) with eqn. (5) for hydrodynamic equilibrium and using eqn. (8) gives (Kregel et al., 2005; van der Kruit & de Grijs, 1999)
| (12) |
The observed constancy of implies that the flattening of the disk is proportional to .
t]
The mass-to-light ratio is a crucial measure of the contribution of the disk to the rotation curve and the relative importance of disk and dark halo mass in a galaxy. In the ‘maximum disk hypothesis’ the disk contribution is optimized such that the amplitude of the disk-alone rotation curve is as large as the observations allow. In a maximal disk, the ratio between the disk-alone rotation curve and the observed one will be a bit lower than unity to allow a bulge contribution and let dark halos have a low density core. A working definition is 0.850.10 (Sackett, 1997).
For an exponential disk, the ratio of the peak rotation velocity of the disk to the maximum rotation velocity of the galaxy () is
| (13) |
Using eqn. (5) and eqn. (8) this can be rewritten as
| (14) |
So we can estimate the disk contribution to the rotation curve from a statistical value for the flattening (see also Bottema, 1993, 1997; van der Kruit, 2002). For the sample of Kregel et al. (2002) this then results in 0.570.22 (rms scatter). In the dynamical analysis of Kregel et al. (2005), the ratio is known up to a factor and distance-independent. For , 0.530.04, with a scatter of 0.15. Both estimates agree well. Thus, at least for this sample, the average spiral has a submaximal disk.
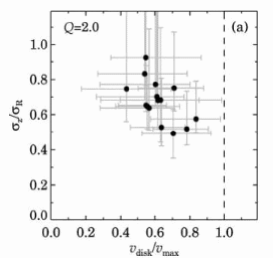
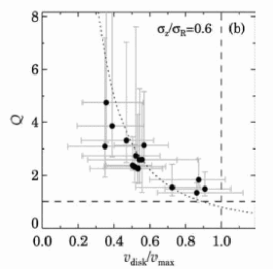
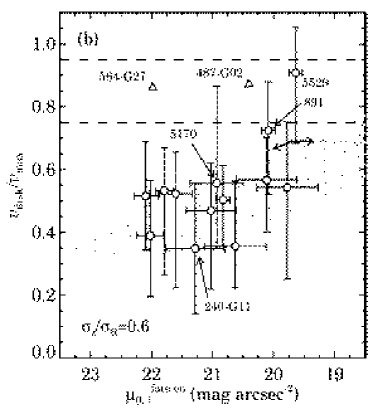
The values obtained for individual galaxies are illustrated in figs. 3 and 4. Most galaxies are not ‘maximum-disk’. The ones that may be maximum disk have a high surface density according to fig. 2. From the panels we also note that disk that are maximal appear to have more anisotropic velocity distributions or are less stable according to Toomre ,
Originaly, van der Kruit & Freeman (1986) used the property defined as a criterion for global stability (Efstathiou et al., 1982): for stability. This is –up to a factor 0.62 for an infinitessimally thin exponential disk– the reciprocal of the ratio . Then they found (van der Kruit & Freeman, 1986), which corresponds to . It is remarkable –and probably significant– that all values obtained for are close to 0.6.
4 Flaring of HI layers and disk masses
The thickness of the gas layer in a disk galaxy can be used to measure the surface density of the disk. Assume the density distribution of the exponential, locally isothermal disk (that in eqn. (1) with ). If the HI velocity dispersion is independent of radius –as e.g. in the face-on spiral NGC 628, (Shostak & van der Kruit, 1984)– and isotropic, and if the stars dominate the gravitational field, the HI layer has a full width at half maximum (to 3%) of
| (15) |
So the HI layer increases exponentially in thickness with an e-folding . This has first been derived and applied to HI observations of NGC 891 by van der Kruit (1981). One has to be careful to distinguish signatures for flaring from those of residual inclination away from exactly edge-on. Such studies can determine whether galaxies have in general maximum disks or not. The modelling, using photometry from van der Kruit & Searle (1981b), indicated that of NGC 891 is km/s. The observed value is km/s, so the ratio in eqn.(1) is , and NGC 891 is clearly sub-maximal.
For our Galaxy my preferred values are and km/s, so that the ratio is and the Milky Way also is sub-maximal. In other systems similar results were found; e.g. in NGC 4244 Olling (1996b) deduced form the flaring a disk-alone rotation of 40 to 80% of that of observed rotation. Actually, the flaring of the HI layer in NGC 4244 was used by Olling (1996a) to infer that the dark matter is highly flattened (but see Olling & Merrifield (2000), who found for the Galaxy halo closer to spherical).
In a recent study by O’Brien et al. (2010) on the superthin edge-on galaxy UGC 7321, the rotation curve was decomposed using constraints from the thickness and flaring of the HI layer. This study was aimed at a determination of the shape of the dark matter halo, which was found to be close to spherical. The disk (-band) was found to be only about 0.2 and the galaxy is very far from maximum disk. This is even somewhat lower than the range 0.5 to 2 indicated above. In fact, (Banerjee et al., 2010) also concluded that the dark matter dominates the gravitational field everwhere in the disk of this galaxy.
Work on de compositions of rotation curves and analysis involving observations of the ‘baryonic’ Tuly-Fisher relation has progressed as well. In particular, McGaugh (2005) has analysed a sample of galaxies with extended HI rotation curves and finds that high surface brightness galaxies are closer to maximum disk than low surface brightness ones. This may be the same effect as described above in terms of surface density. On the other hand, Weiner et al. (2001) find from detailed fluid dynamical gasflows in the barred galaxy NGC 4123 that this system must be close to maximum-disk. So, almost certainly some (massive) disks are maximal.
Finally I note the following clever argument of Courteau & Rix (1999) that makes use of the scatter in the Tully-Fisher relation. The amplitude of the rotation curve of the self-gravitating exponential disk is
| (16) |
For fixed disk-mass we then get from differentiation
| (17) |
So at a given absolute magnitude (or mass) a lower scalelength disks should have a higher rotation velocity. If all galaxies were maximum disk this then should be visible in the scatter of the Tully-Fisher relation. This is not observed and the estimate is that on average and galaxies in general do not have maximal disks.
Recent reviews of disk masses in galaxies are by van der Kruit (2009) and McGaugh (2009) at the Kingston symposium. In summary: the overall state of affairs concerning the maximum disk hypothesis appears to be that in general galaxy disk are not maximal, except possibly the ones with the highest surface brightness and surface density.
5 Flatness and truncations in stellar disks
It is important to realise that stellar disks are often remarkably flat. This can be studied in edge-on systems by determining the centroid of the light distribution in the direction perpendicular to the major axis at various galactocentric distances (e.g. Sanchez-Saavedra et al., 1990; Florido et al., 1991; de Grijs, 1997, chapter 5). Apart from some minor warps in the outer parts of the stellar disks, in the inner parts the systematic deviatons are very small.
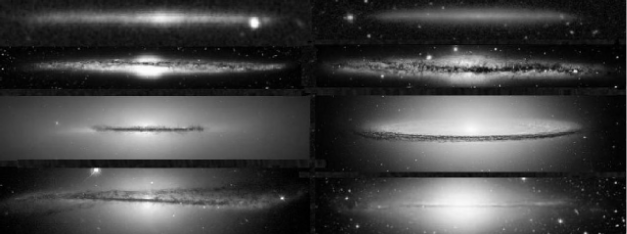
We may also look at the flatness of the layers of the ISM within them, such as dustlanes. In fig. 5 I collected some images of edge-on disk galaxies. At the top are two ‘super-thin’ galaxies; the disks are straight lines to within a few percent. The same holds for the dustlanes in NGC 4565 (allow for the curvature due to the imperfect edge-on nature) and NGC 891. In the third row the peculiar structure of NGC 5866 has no measuable deviation from a straight line, while for the Sombrero Nebula the outline of the distlane fits very accurately to an ellipse. In the bottom row, NGC 7814 (right) is straight again to wthin a few percent, but NGC 5866 is an example of a galaxy with a large warp in the dust layer.
The HI kinematics provide probably the strongest indications for flatness. In three almost completely face-on spirals (NGC 3938, 628 and 1058), van der Kruit & Shostak (1982, 1984) and Shostak & van der Kruit (1984) found that the residual velocity field after subtraction of that of the rotation field has an r.m.s. value of only 3 - 4 km/s (or a few pc per Myr) without any systematic pattern. A vertical oscillation with a similar period as that for stars in the Solar Neighborhood ( years) or even of that of rotation around the Galactic Center ( years) would correspond to a vertical amplitude ten to a hundred pc. The absence of such residual patterns shows that the HI layers and the stellar disks must be extraordinarily flat, except maybe in their outer regions or when they have recently been in interaction.
Recently, Matthews & Uson (2008a, b) have found evidence for a pattern of corrugation in the disk of the edge-on galaxy IC 2233 with an amplitude up to 250 pc, especially in HI and young stars. IC 2233 is a rather small galaxy (radius 7 or 8 kpc and rotation velocity about 100 km/s) unlike the ones discussed in the previous paragraph.
I have indicated above that the flattening of the stellar disk is smallest for systems of late Hubble type, small rotation velocity and faint (face-on) surface brightness. It is of interest then to look more closely at systems at this extreme end of the range of flattening: ‘superthin’ galaxies. A prime example is the galaxy UGC 7321, studied extensively by Lynn Matthews and collaborators (Banerjee et al., 2010, and references therein). The picture that appears is that this is a very low surface brightness galaxy (the face-on -band central surface brightness is 23.4 mag arcsec-2) and a scalelength of about 2 kpc, but a projected vertical scaleheight of only 150 pc. It appears to have vertical structure since there is a color gradient (bluer near the central plane) and appears to consist of two components. Its HI is warped in the outer parts, starting at the edge of the light distribution.
Another good example of a superthin galaxy is IC 5249 (Byun, 1998; Abe et al., 1999; van der Kruit et al., 2001). This also is a faint surface brightness galaxy with presumably a small fraction of the mass in the luminous disk. However, the disk scaleheight is not small (0.65 kpc). It has a very long radial scalelength (17 kpc); the faint surface brightness then causes only the parts close to the plane to be easily visible against the background sky, while the long radial scalelength assures this to happen over a large range of . Therefore it appears thin on the sky. The flattening is 0.09 (versus 0.07 for UGC 7321). The stellar velocity dispersions are similar to those in the Solar Neighborhood; disk heating must have proceeded at a pace comparable to that in the Galaxy.
The flattest galaxies on the sky have indeed very small values of . However, these two examples show that superthin galaxies share at least the properties of late type, faint face-on surface brightness and small amounts of luminous disk mass compared to that in the dark halo.
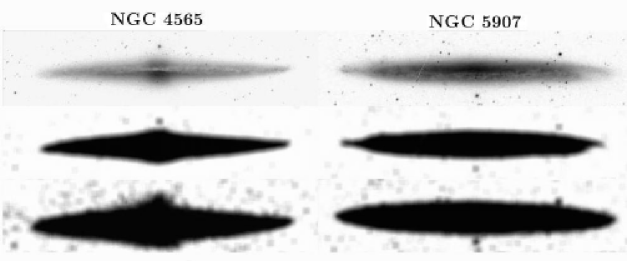
Truncations in stellar disks were first found in edge-on galaxies, where the remarkable feature was noted that the radial extent did not grow with deeper photographic exposures (van der Kruit, 1979). Prime examples of this phenomenon of truncations are the large edge-on galaxies NGC 4565 and NGC 5907 (see fig. 6). The truncations appear very sharp, although of course not infinitely so. Rather sharp outer profiles are actually obtained after deprojecting near-IR observations of edge-on galaxies (e.g. Florido et al., 2006).
Various models have been proposed for the origin of truncations (for a discussion see van der Kruit, 2007). Truncations could be the current extent of the disks while they are growing from the inside out from accretion of external material. This predicts larger age gradients across disks than are observed (de Jong, 1996). Another possibility is that star formation is inhibited when the gas surface (or space?) density falls below a certain threshold for local stability (Fall & Efstathiou, 1980; Kennicutt, 1989; Schaye, 2004). The Goldreich–Lynden-Bell criterion for stability of gas layers gives a poor prediction for the truncation radii (van der Kruit & Searle, 1982a). Another problem for teh threshold hypothesis is that the rotation curves of some galaxies, e.g. NGC 5907 and NGC 4013 (Casertano, 1983; Bottema, 1996), show features near the truncations that indicate that the mass distributions are also truncated. Schaye predicts an anti-correlation between and , which is not observed. Models have been proposed (e.g. Florido et al., 2006), in which a magnetic force breaks down as a result of star formation so that stars escape. The evidence for sufficiently strong magnetic fields needs strengthening.
Obviously, the truncation corresponds to the maximum in the current specific angular momentum distribution of the disk, which would correspond to that in the protogalaxy (van der Kruit, 1987) if the collapse occurs with detailed conservation of specific angular momentum. As noted above, if this starts out as a Mestel (1963) sphere (i.e. uniform density and angular rotation) in the force field of a dark halo with a flat rotation curve, a roughly exponential disk results. This disk has then a truncation at about 4.5 scalelengths, so this hypothesis provides at the same time an explanation for the exponential nature of disk as well as for the occurence of the truncations. This requires the absence of substantial redistribution of angular momentum takes place. Bars may play an important role in this, as suggested by Debattista et al. (2007) and Erwin et al. (2007). In fact a range of possible agents in addition to bars, such as density waves, heating and stripping of stars by bombardment of dark matter subhalos, has been invoked (de Jong et al., 2007).
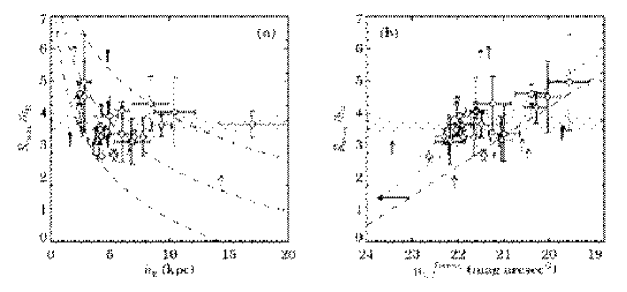
Kregel & van der Kruit (2004) derive correlations of the ratio of the truncation radius and the disk scalelengths with itself and with the face-on central surface brightness (fig. 7). does not depend strongly on , but is somewhat less than the 4.5 predicted from the collapse from a simple Mestel-sphere. There is some correlation between and , indicating approximate constant disk surface density at the truncations, as possibly expected in the star-formation theshold model. But this model predicts an anti-correlation between and (Schaye, 2004), which is not observed. The maximum angular momentum hypothesis predicts that should not depend on or and such a model therefore requires some redistribution of angular momentum or somewhat different initial conditions.
Due to line-of-sight integration, truncations will be more difficult to detect in face-on galaxies. The expected surface brightness at 4 scalelengths is about 26 B-mag arcsec-2 or close to sky. In face-on galaxies like NGC 628 (Shostak & van der Kruit, 1984; van der Kruit, 1988) an isophote map shows that the outer contours have a much smaller spacing than the inner ones. The usual analysis uses an inclination and major axis determined from kinematics (if available, otherwise this is estimated from the average shape of isophotes) and then determines an azimuthally averaged radial surface brightness profile. But this will smooth out any truncation if its radius is not exactly constant with azimuthal angle. The effects are nicely illustrated in the study of NGC 5923 (Pohlen et al., 2002, their fig. 9), which has isophotes in polar coordinates. The irregular outline shows that some smoothing out will occur contrary to observations in edge-on systems.
Pohlen & Trujillo (2006) studied a sample of moderately inclined systems through ellipse-fitting of isophotes in SDSS data. They distinguish three types of profiles: Type I: no break; Type II: downbending break; Type III: upbending break. Pohlen et al. (2007) have reported that the same types profiles occur among edge-on systems; however, of their 11 systems there were only one for each of the types I and III.
Various correlations have been reviewed in van der Kruit (2009). In general, the edge-on and face-on samples agree in the distribution of ; however the fits in moderately inclined systems result in small values of the scalelength compared to the edge-on sample. S. Peters, R. S. de Jong and I have re-analysed the Pohlen et al. data using two approaches: (1) mimick an edge-on view by collapsing the data onto the major axis and (2) calculate a radial profile using equivalent profiles. The luminosity profiles from ellipse fitting (Pohlen et al.) and that using equivalent profiles agree well, in spite of the difference that the first assumes a position for the center and the method with equivalent profiles does not. Often the ‘major-axis-collapse’ method shows in Types I and II truncations when seen ‘edge-on’. So, there are truncations in the stellar disks but less symmetric than one might expect. Finally, Type III galaxies do not show ’edge-on truncations’, but invariably evidence for interaction or other disturbances of the outer parts. A prime example of a Type III profile is NGC 3310, which is a well-known case of a disturbed, probably merging galaxy (van der Kruit, 1976; Kregel & Sancisi, 2001).
There is a good correlation between and the rotation velocity (van der Kruit, 2008). On average a galaxy like our own would have an of 15 - 25 kpc (and a scalelength of 4 - 5 kpc). Now look at NGC 300 , which has no truncation even at 10 scalelengths (Bland-Hawthorn et al., 2005), so that 14.4 kpc. In spite of that it is not outside the distribution observed in edge-on systems between and (NGC 300 has km/s and this would give an of 8 - 15 kpc and an of 2 - 4 kpc ). So it has a unusually small for its ; not an unusual for its rotation! At least some of the Type I galaxies could have disks with normal truncation radii, but large and small so that the truncations occur at much lower surface brightness.
I note, but cannot discuss in detail, that truncations in stellar disks and warps of HI layers are often associated, and refer to my discussion in van der Kruit (2007).
Acknowledgements.
Ken Freeman is an expert in many area’s of astronomy, but he is in particular known for his research in that of disks of spiral galaxies, and I feel fortunate to have been able to work with him on projects related to that. Many congratulations, Ken, and thanks for all the years of friendship and stimulating collaboration.References
- Abe et al. (1999) Abe, F. et al., 1999, A. J., 118, 261
- Athanassoula & Sellwood (1986) Athanassoula, E. & Sellwood, J.A., 1986, Mon. Not. R.A.S., 221, 213
- Banerjee et al. (2010) Banerjee, A., Matthews, L.D. & Jog, C.J., 2010, New Astron., 15, 89
- Bland-Hawthorn et al. (2005) Bland-Hawthorn, J., Vlajić, M., Freeman, K.C. & Draine, B.T., 2005, Astroph. J., 629, 249
- Bottema (1993) Bottema, R., 1993, Astron. Astrophys., 275, 16
- Bottema (1996) Bottema, R., 1996, Astron. Astrophys., 306, 345
- Bottema (1997) Bottema, R., 1997, Astron. Astrophys., 328, 517
- Bottema (2003) Bottema, R., 2003, Mon. Not. R.A.S., 344, 358
- Byun (1998) Byun, Y.-I., 1998, Chin. J. Phys., 36, 677
- Casertano (1983) Casertano, S., 1983, Mon. Not. R.A.S., 203, 735
- Courteau & Rix (1999) Courteau, S. & Rix, H.-W., 1999, Astroph. J. 513, 561
- Dalcanton et al. (1997) Dalcanton, J.J., Spergel, D.N. & Summers, F.J., 1997, Astroph. J., 482, 659
- Debattista et al. (2007) Debattista, V. P., Mayer, L., Carollo, C.M., Moore, B., Wadsley, J., & Quinn, T., 2006, Astroph. J., 645, 209
- de Grijs (1997) de Grijs, R., 1997, Ph.D. thesis, Univ. Groningen
- de Grijs (1998) de Grijs, R., 1998, Mon. Not. R.A.S., 299, 595
- de Grijs & Peletier (1997) de Grijs, R. & Peletier, R.F., 1997, Astron. Astrophys., 320, L21
- de Grijs et al. (1997) de Grijs, R., Peletier, R.F. & van der Kruit, P.C., 1997, Astron. Astrophys., 327, 966
- de Jong (1996) de Jong, R.S., 1996, Astron. Astrophys., 313, 45
- de Jong et al. (2007) de Jong, R.S. et al., 2007, Astroph. J., 667, L49
- Efstathiou et al. (1982) Efstathiou, G., Lake, G. & Negroponte, J., Mon. Not. R.A.S., 199, 1069
- Erwin et al. (2007) Erwin, P., Pohlen, M., Beckman, J.E., Gutierrez, L. & Aladro, R., 2007, Astro-ph 0706.3829
- Fall & Efstathiou (1980) Fall, S.M. & Efstathiou, G., 1980, Mon. Not. R.A.S., 193,189
- Florido et al. (1991) Florido, E., Prieto, M., Battaner, E., Mediavilla, E. & Sanchez-Saavedra, M.L., 1991, Astron. Astrophys., 242, 301
- Florido et al. (2006) Florido, E. et al., 2006, Astron. Astrophys., 455, 467
- Freeman (1970) Freeman, K.C., 1970, Astroph. J., 160, 811
- Freeman (1975) Freeman, K.C., 1975, Stars & Stellar Systems 9, ch. 11
- Freeman (2007) Freeman, K.C.., 2007, Astroph. Space Sci. Proc., 24, 3
- Gunn (1982) Gunn, J.E., 1982, In: Astrophysical Cosmology, Pont. Acad. Sci. Vatican, 233
- Herrmann & Ciardullo (2009) Herrmann, K.A.& Ciardullo, R., 2009, Astroph. J., 705, 1686
- Hohl (1971) Hohl, F., 1971, Astroph. J., 168, 343
- Kapteyn (1922) Kapteyn, J.C., 1922, Astroph. J., 55, 302
- Kennicutt (1989) Kennicutt, R.C., 1989, Astroph. J., 344, 685
- Kregel & Sancisi (2001) Kregel, M. & Sancisi, R., 2001, Astron. Astrophys., 376, 59
- Kregel & van der Kruit (2004) Kregel, M. & van der Kruit, P.C., 2004, Mon. Not. R.A.S., 355, 143
- Kregel & van der Kruit (2005) Kregel, M. & van der Kruit, P.C., 2005, Mon. Not. R.A.S., 358, 481
- Kregel et al. (2002) Kregel, M., van der Kruit, P.C. & de Grijs, R., 2002, Mon. Not. R.A.S., 334, 646
- Kregel et al. (2004) Kregel, M., van der Kruit, P.C. & Freeman, K.C., 2004, Mon. Not. R.A.S., 351, 1247
- Kregel et al. (2005) Kregel, M., van der Kruit, P.C. & Freeman, K.C., 2005, Mon. Not. R.A.S., 358, 503
- Larson (1976) Larson, R.B., Mon. Not. R.A.S., 1976, 176, 31
- Lewis & Freeman (1989) Lewis, J.R. & Freeman, K.C., 1989, A. J., 97, 139
- Matthews & Uson (2008a) Matthews, L.D. & Uson, J.M., 2008a, A. J., 135, 291
- Matthews & Uson (2008b) Matthews, L.D. & Uson, J.M., 2008b, Astroph. J., 688, 237
- McGaugh (2005) McGaugh, S.S., 2005, Astroph. J., 632, 859
-
McGaugh (2009)
McGaugh, S.S., 2009, in: Unveiling the mass,
www.astro.queensu.ca/GalaxyMasses09/data/McGaugh_GMasses09.pdf - Mestel (1963) Mestel, L., 1963, Mon. Not. R.A.S., 126, 553
- Mihos et al. (1997) Mihos, J.C., McGaugh, S.S. & de Blok, W.J.G., 1997, Astroph. J., 477, 79
- O’Brien et al. (2010) O’Brien, J.C., Freeman, K.C. & van der Kruit, P.C., 2010, Astron. Astrophys., in press
- Olling (1996a) Olling, R.P., 1996a, A. J., 112, 481
- Olling (1996b) Olling, R.P., 1996b, A. J., 112, 457
- Olling & Merrifield (2000) Olling, R. & Merrifield, M.R., Mon. Not. R.A.S., 358, 503
- Oort (1932) Oort, J.H., 1932, B.A.N., 6, 249
- Oort (1965) Oort, J.H., 1965, Stars & Stellar Systems 5, ch. 21
- Pohlen et al. (2002) Pohlen, M., Dettmar, R.-J., Lütticke, R. & Aronica, G., 2002, Astron. Astrophys., 392,
- Pohlen & Trujillo (2006) Pohlen, M. & Trujillo, I., 2006, Astron. Astrophys., 454, 759
- Pohlen et al. (2007) Pohlen, M., Zaroubi, S., Peletier, R.F. & Dettmar, R.-J., 2007, Mon. Not. R.A.S., 378, 594
- Sackett (1997) Sackett, P.D., 1997, Astroph. J., 483, 103
- Sanchez-Saavedra et al. (1990) Sanchez-Saavedra, M.L., Battaner, E. & Florido, E., 1990, Astroph. Space Sci.171, 239
- Sellwood & Carlberg (1984) Sellwood, J.A. & Carlberg, R.G., 1984, Astroph. J., 282, 61
- Schaye (2004) Schaye, J., 2004, Astroph. J., 609, 667
- Shostak & van der Kruit (1984) Shostak, G.S. & van der Kruit, P.C., 1984, Astron. Astrophys., 132, 20
- Swaters (1999) Swaters, R.A., 1999, Ph.D. Thesis, University of Groningen
- Toomre (1964) Toomre, A., 1964, Astroph. J., 139, 1217
- van der Kruit (1976) van der Kruit, P.C., 1976, Astron. Astrophys., 49, 161
- van der Kruit (1979) van der Kruit, P.C., 1979, Astron. Astrophys. Suppl., 38, 15
- van der Kruit (1981) van der Kruit, P.C., 1981, Astron. Astrophys., 99, 298
- van der Kruit (1987) van der Kruit, P.C., 1987, Astron. Astrophys., 173, 59
- van der Kruit (1988) van der Kruit, P.C., 1988, Astron. Astrophys., 192, 117
- van der Kruit (1990) van der Kruit, P.C., 1990, Chapter 10 in Gilmore, G., King, I.R. & van der Kruit, P.C., The Milky Way as a Galaxy, Univ. Science Books
- van der Kruit (2002) van der Kruit, P.C., 2002, Astron. Soc. Pac. Conf. Ser., 273, 7
- van der Kruit (2007) van der Kruit, P.C., 2007, Astron. Astrophys., 466, 883
- van der Kruit (2008) van der Kruit, P.C., 2008, Astron. Soc. Pac. Conf. Ser., 396, 173
-
van der Kruit (2009)
van der Kruit, P.C., 2009, in: Unveiling the mass,
www.astro.queensu.ca/GalaxyMasses09/data/vanderKruit_GMasses09.pdf - van der Kruit & de Grijs (1999) van der Kruit, P.C. & de Grijs, R., 1999, Astron. Astrophys., 352, 129
- van der Kruit & Freeman (1984) van der Kruit, P.C. & Freeman, K.C., 1984, Astroph. J., 278, 81
- van der Kruit & Freeman (1986) van der Kruit, P.C. & Freeman, K.C., 1986, Astroph. J., 303, 556
- van der Kruit et al. (2001) van der Kruit, P.C., Jiménez-Vicente, J., Kregel, M. & Freeman, K.C., 2001, Astron. Astrophys., 379, 374
- van der Kruit & Searle (1981a) van der Kruit, P.C. & Searle, L., 1981a, Astron. Astrophys., 95, 105
- van der Kruit & Searle (1981b) van der Kruit, P.C. & Searle, L., 1981b, Astron. Astrophys., 95, 116
- van der Kruit & Searle (1982a) van der Kruit, P.C. & Searle, L., 1982a, Astron. Astrophys., 110, 61
- van der Kruit & Shostak (1982) van der Kruit, P.C. & Shostak, G.S., 1982, Astron. Astrophys., 105, 351
- van der Kruit & Shostak (1984) van der Kruit, P.C. & Shostak, G.S., 1984, Astron. Astrophys., 134, 258
- Verheijen et al. (2007) Verheijen, M.A.W., Bershady, M.A., Swaters, R.A., Andersen, D.R. & Westfall, K.B., 2007, ‘Island Unicverses’ ed. R.S. de Jong, Springer, p.95
- Weiner et al. (2001) Weiner, B.J. Sellwood, J.A. & Williams, T.B., 2001, Astroph. J., 546, 931
- Westfall et al. (2008) Westfall, K.B., Bershady, M.A., Verheijen, M.A.W., Andersen, D.R. & Swaters, R.A., 2008, ASP Conf. Ser. 396, p.41