A kinematic study of the neutral and ionised gas in the irregular dwarf galaxies IC 4662 and NGC 5408††thanks: The radio observations were obtained with the Australia Telescope which is funded by the Commonwealth of Australia for operations as a National Facility managed by CSIRO. All optical observations were collected at the European Southern Observatory, Chile, Proposal-Nos.: 047.01-003, 51.1-0067, 69.D-0143(A), and 077B.-0115(A).
Abstract
The feedback between massive stars and the interstellar medium is one of the
most important processes in the evolution of dwarf galaxies. This interaction
results in numerous neutral and ionised gas structures that have been found
both in the disc and in the halo of these galaxies. However, their origin and
fate are still poorly understood.
We here present new H i and optical data of two Magellanic irregular dwarf
galaxies in the Local Volume: IC 4662 and NGC 5408. The H i line data were
obtained with the Australia Telescope Compact Array and are part of the
“Local Volume H i Survey”. They are complemented by optical images and
spectroscopic data obtained with the ESO New Technology Telescope and the ESO
3.6m telescope. Our main aim is to study the kinematics of the neutral and
ionised gas components in order to search for outflowing gas structures and to
make predictions about their fate. Therefore, we perform a Gaussian
decomposition of the H i and H line profiles.
We find the H i gas envelopes of IC 4662 and NGC 5408 to extend well beyond
the optical discs, with H i to optical diameter ratios above four. The
optical disc is embedded into the central H i maximum in both
galaxies. However, higher resolution H i maps show that the H i intensity
peaks are typically offset from the prominent H ii regions.
While NGC 5408 shows a fairly regular H i velocity field, which allows us to
derive a rotation curve, IC 4662 reveals a rather twisted H i velocity
field, possibly caused by a recent merger event. We detect outflows with
velocities between 20 and 60 in our H spectra of both galaxies,
sometimes with H i counterparts of similar velocity. We suggest the existence
of expanding superbubbles, especially in NGC 5408. This is also
supported by the detection of FWHMs as high as 70 in H, which
cannot be explained by thermal broadening alone. In case of NGC 5408, we
compare our results with the escape velocity of the galaxy, which shows that
the measured expansion velocities are in all cases too low to allow the gas to
escape from the gravitational potential of NGC 5408. This result is
consistent with studies of other dwarf galaxies.
keywords:
galaxies: individual (IC 4662, NGC 5408) – galaxies: ISM – galaxies: kinematics and dynamics – galaxies: structure1 Introduction
The interplay between massive stars and the interstellar medium (ISM) has a large effect on the formation and the evolution of galaxies, especially of dwarf galaxies. Photoionisation is the most likely interaction process. However, stellar winds and supernovae (SNe) explosions of massive stars also contribute significantly to the energy input into the ISM. The radiative and mechanical feedback heat the gas and drive it outwards, sweeping up the ambient gas into a thin shell. A superbubble filled with hot gas evolves and begins to expand into the ISM. Due to Rayleigh-Taylor instabilities, the outer shell can rupture and the hot gas can vent out through so-called chimneys into the halo (Norman & Ikeuchi, 1989).
Numerous ionised gas structures such as supergiant shells or filaments close to the galactic disc of dwarf galaxies, but also at kpc-distances from any place of current star formation, have been detected on deep H images (e.g., Hunter et al., 1993; Bomans et al., 1997; Hunter & Gallagher, 1997; López-Sánchez & Esteban, 2008). Spectroscopic observations of the H line revealed that most of the ionised gas structures expand from the disc into the halo of their host galaxies (e.g., Marlowe et al., 1995; Martin, 1998; Bomans, 2001; van Eymeren et al., 2007). This leads to the question of what the fate of the gas is. One scenario is that the gas cools down in the halo and eventually falls back onto the galactic disc (outflow, galactic fountain scenario, Shapiro & Field, 1976). However, it might also be possible that the gas escapes from the gravitational potential by becoming a freely flowing wind (galactic wind). The detection of large amounts of hot gas in the intergalactic medium (IGM) and the generally low metal content of dwarf galaxies support this scenario.
Hydrodynamic simulations modelling superbubble blow-out in dwarf galaxies (Mac Low & Ferrara, 1999) predict that at least a part of the hot gas has enough kinetic energy to leave the gravitational potential of its host galaxy and to enrich the IGM. The relatively low escape velocities of dwarf galaxies should facilitate the removal of substantial amounts of gas (Larson, 1974). According to Ferrara & Tolstoy (2000) galactic winds occur in dwarf galaxies with gas masses up to M⊙. However, the fate of the gas does not only depend on the mass of the host galaxy and therefore its gravitational potential, but it also strongly depends on the morphology of the ISM distribution. For a spherical distribution, the ISM seems to be more resistant to ejection (Silich & Tenorio-Tagle, 2001).
A recent detailed kinematic study of the neutral and ionised gas in the two irregular dwarf galaxies NGC 2366 and NGC 4861 revealed several outflows in each galaxy (van Eymeren et al., 2009a, b). The measured expansion velocities were of the order of 20 to 50, which is, in comparison with the escape velocities of the host galaxies, too low to allow the gas to leave the gravitational potential. This result confirms earlier observations: no convincing case of a galactic wind in local dwarf galaxies has been reported so far (Bomans, 2005). Note that galaxies like M 82 are not typical dwarf galaxies as they show strong starbursts, are more luminous and have a higher mass.
Altogether, this shows that despite all the detailed observational studies and simulations, we do not fully understand what is going on in these galaxies. Galactic winds are still thought to be necessary ingredients for their formation and evolution, but direct evidence seems to be difficult to get. In order to improve our knowledge about the processes happening in dwarf galaxies, we performed a multi-wavelength study of altogether four irregular dwarf galaxies (van Eymeren, 2008). The results for NGC 2366 and NGC 4861 have already been published (van Eymeren et al., 2009a, b, see also above). We here concentrate on the two remaining galaxies IC 4662 and NGC 5408. We obtained H i line data as well as optical images and spectroscopic data. Some basic properties of both galaxies are given in Table 1.
IC 4662 (HIPASS J1747–64) is classified as a barred irregular galaxy of Magellanic type (IBm). Its distance of = 2.44 Mpc was obtained by Karachentsev et al. (2006) and hence makes it the nearest known representative of blue compact dwarfs (Karachentsev et al., 2006). It seems to be a rather isolated galaxy, belonging to no known groups. de Vaucouleurs (1975) describes IC 4662 as a foreground galaxy in the direction of the NGC 6300 group.
NGC 5408 (HIPASS J1403–41) is classified as an IB(s)m galaxy. It was first
studied by Bohuski
et al. (1972) who found that its nucleus consists of several
bright H ii regions and appears to be undergoing a violent burst of star
formation. As the galaxy reveals an ultra-luminous X-ray source,
NGC 5408 X-1, very close to the main H ii regions, it was a popular object to study over the last decade
(e.g., Soria
et al., 2004; Soria et al., 2006; Strohmayer et al., 2007; Lang
et al., 2007; Kaaret &
Corbel, 2009).
This X-ray source has recently been argued to harbour an intermediate-mass
black hole (Strohmayer &
Mushotzky, 2009). The distance of NGC 5408 of = 4.81 Mpc was obtained by
Karachentsev et al. (2002). Its position on the sky puts NGC 5408 in the
Centaurus A group. The closest known neighbour appears to be ESO 325-G?001 at
a projected distance of 208′.
This paper is organised as follows: in Sect. 2 we give an overview over the observations and the data reduction. In Sect. 3 we describe and compare the morphology of the neutral and ionised gas. Section 4 contains the kinematic analysis of both gas components including a search for expanding gas. The results are discussed in Sect. 5, which is followed by a summary in Sect. 6.
|
2 Observations and Data Reduction
2.1 Optical data
2.1.1 Imaging
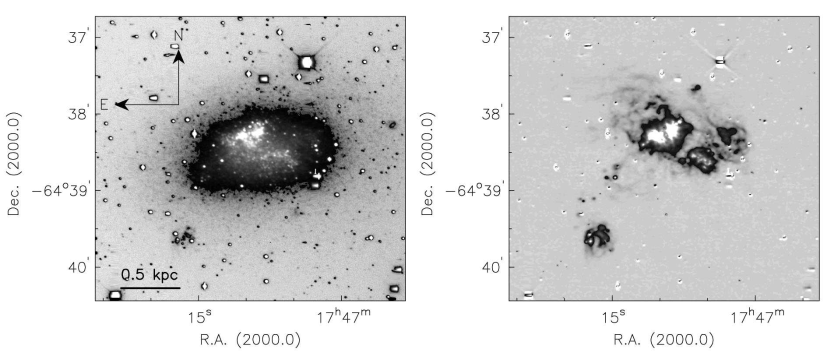
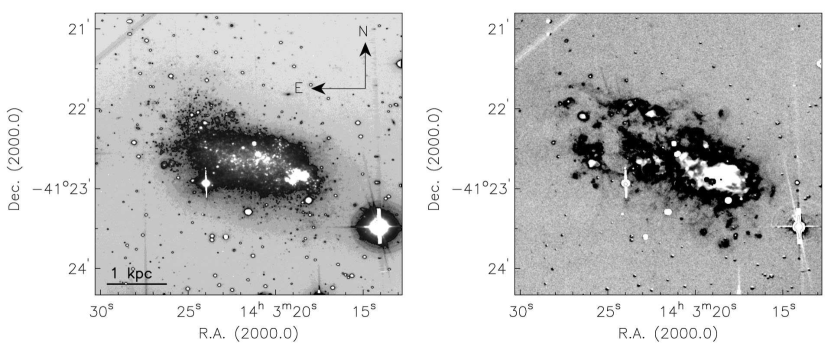
Deep R-band and H images are available for both galaxies. Using the ESO Multi-Mode Instrument (EMMI) attached to the ESO New Technology Telescope (NTT), we obtained a 600 s exposure of IC 4662 in R-band and a 1800 s exposure in H. A 600 s R-band image of NGC 5408 as well as a 1200 s H image, both observed with the ESO Faint Object Spectrograph and Camera (EFOSC) attached to the ESO 3.6m telescope, have been taken from the ESO archive. The data reduction was performed using the software package IRAF (Tody, 1993), and included standard procedures of overscan- and bias-subtraction as well as a flatfield correction. Additionally, we removed cosmic rays by running the IRAF version of L. A. Cosmic (van Dokkum, 2001). In order to get the pure H line emission, we first scaled the flux of the stars in both the continuum and the H images and subsequently subtracted the continuum image from the H image. The seeing was 11 and 08 during the observations of IC 4662 and NGC 5408 respectively. We used adaptive filters based on the H-transform algorithm (Richter et al., 1991) to stress weaker structures in the H images and to differentiate them from the noise. All images are displayed in Fig. 1. Some observational details are given in Table 2.
|
2.1.2 Medium-resolution long-slit spectroscopy
We used archival medium-resolution long-slit spectra of NGC 5408, which have a spectral resolution of about 60, as measured from the night sky lines. As the target of these observations was the ultra-luminous X-ray source NGC 5408 X-1, all spectra were obtained at almost the same position. Therefore, we only analyse one slit position as a representative. The seeing was 09.
We performed further medium-resolution long-slit spectroscopy not only of NGC 5408, but also of IC 4662 from May 1st to May 3rd 2006. As we aimed for very deep spectra and were mainly interested in the H line, only the red part of EMMI was read out. We used grating # 7 centred on the H line with a wavelength coverage of 1300 Å and a dispersion of 0.41 Å/pix. With a slit width of 1″ we achieved a spectral resolution of 112, again as measured from the night sky lines. The pixel size is 0332 and the seeing was about 1″. Spectra of a thorium comparison lamp were taken for the wavelength calibration.
We obtained three spectra each at different positions across the two galaxies. The slit positions were chosen to intersect prominent shell and filamentary structures as visible on the H images. Some details of the observations are given in Table 3.
The data reduction of all spectra (including the archival one) was performed by us using IRAF and included overscan- and bias-subtraction, flatfield correction and a wavelength calibration. A geometric distortion correction was not necessary because the deviations were smaller than one pixel. Again, cosmic rays were removed by running L. A. Cosmic. We also performed a background subtraction to remove the contamination by the night sky lines.
The spectra and their analysis are presented in Sect. 4.4. They were binned by three pixels in spatial direction, which corresponds to about 1″ in order to match the seeing (see above). At positions of very weak emission, ten pixels were summed up to improve the signal to noise ratio (S/N).
|
2.2 ATCA H i synthesis observations
H i line observations of IC 4662 and NGC 5408 were obtained with the Australia Telescope Compact Array (ATCA), and are part of the “Local Volume H i Survey” (LVHIS111LVHIS is a large project that aims to provide detailed H i intensity maps, velocity fields and 20 cm radio continuum observations for a complete sample of nearby, gas-rich galaxies belonging to the Local Volume (LV), a sphere of radius 10 Mpc centred on the Local Group. The ATCA observations include all LV galaxies which were detected in HIPASS and reside south of -30°. Further details can be found at http://www.atnf.csiro.au/research/LVHIS/.; Koribalski, 2008; Koribalski et al., 2010).
The first frequency band was centred on 1418 MHz with a bandwidth of 8 MHz, divided into 512 channels. This gives a channel width of 3.3 and a velocity resolution of 4. The ATCA primary beam is 336 at 1418 MHz, which is sufficient to fully map both galaxies and their surroundings.
In order to ensure excellent uv-coverage and sensitivity to large-scale structures, IC 4662 was observed for a full synthesis (12 h) in each the EW 367, 750A, and 1.5D configurations. The lower resolution data of NGC 5408 (375 and 750D array) were taken from the archive and complemented by high-resolution data within LVHIS (1.5A array).
The data reduction was carried out with the MIRIAD software package (Sault et al., 1995) using standard procedures, including flux- and phase calibrations. Using a first order fit to the line-free channels in the H i data set, the 20 cm radio continuum was separated from the H i emission. We created two different sets of data cubes, a low-resolution cube to detect the extended emission and a high-resolution cube to resolve the inner structure and to make the H i data comparable to the optical data. For the low-resolution cubes of both galaxies, we excluded the longest baselines, which are all baselines to the distant antenna 6 (CA06). The low-resolution data of IC 4662 were made using ’natural’ weighting of the uv-data in the velocity range covered by the H i emission in steps of 4. The low-resolution data of NGC 5408 were made using ’robust’ weighting. The high-resolution data of both galaxies were created by including all baselines to CA06 and using the same weighting as for the low-resolution cubes. The resulting beam sizes are given in Table 4.
1 Jy beam-1 corresponds to an H i column density of atoms cm-2 (IC 4662, low-res.), atoms cm-2 (IC 4662, high-res.), atoms cm-2 (NGC 5408, low-res.), and atoms cm-2 (NGC 5408, high-res.). The moment maps (integrated intensity map, intensity-weighted mean velocity field, and the velocity dispersion) were created from the H i data cubes by first isolating the regions of significant emission in every channel and afterwards clipping everything below a 2.5 threshold. This final step of the data reduction process and the subsequent analysis of the H i data were performed with The Groningen Image Processing System (GIPSY, van der Hulst et al., 1992), complemented by some IRAF tasks.
|
3 General morphology
In order to get a first impression of how the stars and the gas are distributed, we compared the optical and H i morphologies of IC 4662 and NGC 5408.
3.1 IC 4662
The R-band image of IC 4662 (see Fig. 1, upper left panel) reveals a slightly elongated, box-like shape with a position angle of 104° (Table 1). The H image (Fig. 1, upper right panel) shows a large H ii region complex with an H minimum in the south-eastern part of the stellar light distribution, and extended diffuse, filamentary gas structures outside the stellar disc to the north-east. The central two star clusters are offset by about 350 pc to the north-east from the optical centre (see Table 1), which probably explains the extended H emission in this area. They coincide with the two brightest H ii regions visible on the H image. Additionally, a star cluster with associated H emission that appears to be detached from the main body of the galaxy can be seen. It is located 15 or 1.1 kpc to the south-east of the centre. Our deep H image shows an H ii region at the same position that is connected to the main complex by small, compact H ii regions and diffuse filamentary gas structures. We will come back to this feature in Sect. 5.5.
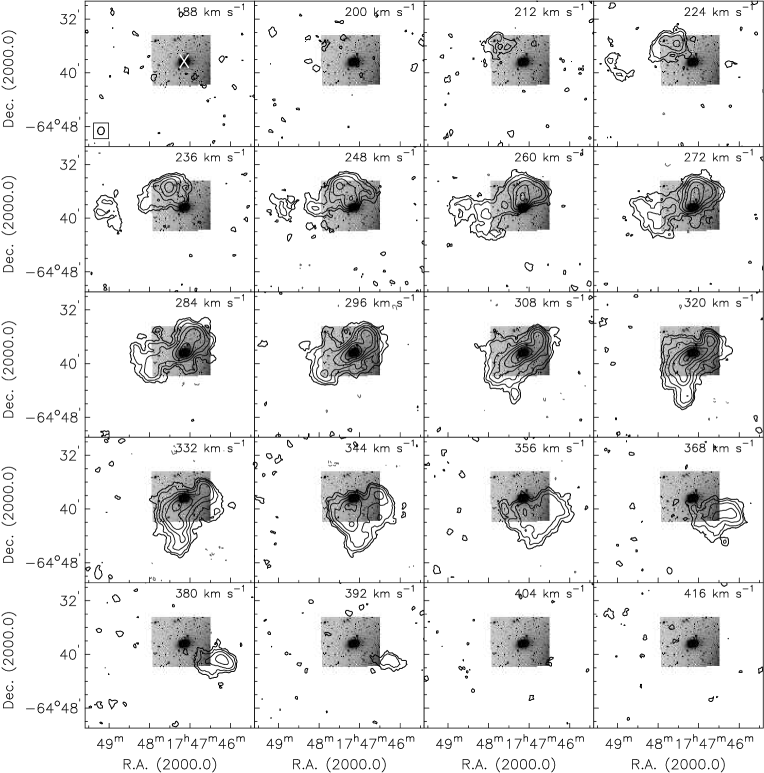
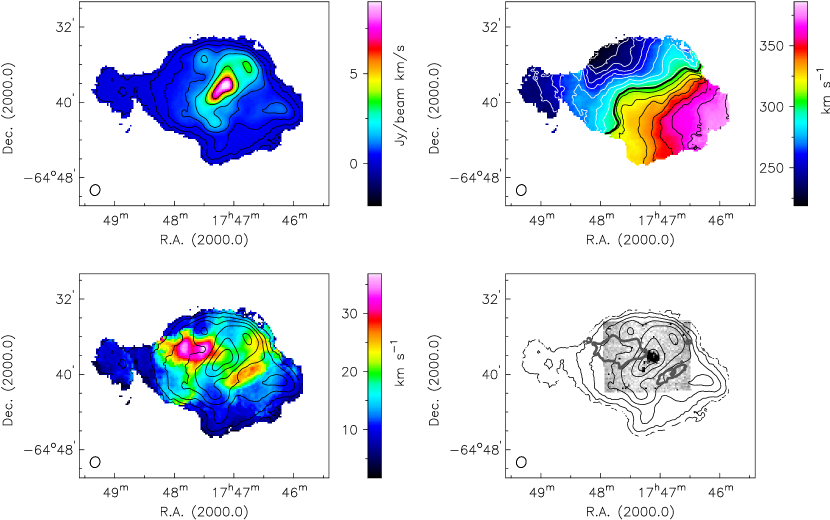
The channel maps of the low-resolution H i data (see Fig. 2) show that the emission is distributed over a velocity range from roughly 200 to 400, i.e., over 200. The neutral gas seems to consist of two systems, an inner system with a position angle of about 135° and an outer part with a position angle of roughly 45°, i.e., perpendicular to the inner system. The integrated H i intensity map (upper left panel of Fig. 3) confirms this feature: it shows an inner high column density system that is perpendicular to the outer low column density system. As displayed on the lower right panel of Fig. 3, the inner system coincides with the optical extent of IC 4662 including the southern H ii region. We can see an additional H i maximum to the north-west of the galaxy, which has no optical counterpart. The H i outer diameter is given in Table 5. Note that the neutral gas is extended by a factor of about six in comparison to the ionised gas, which is among the largest ratios of H i over Hever detected. We measured the flux density to be Jy, from which we derived a total H i mass of M⊙ (see Table 5). This is within the errors of the HIPASS value of Jy (see Table 1), which means that our interferometric observations recover most of the emission detected on single-dish data of IC 4662.
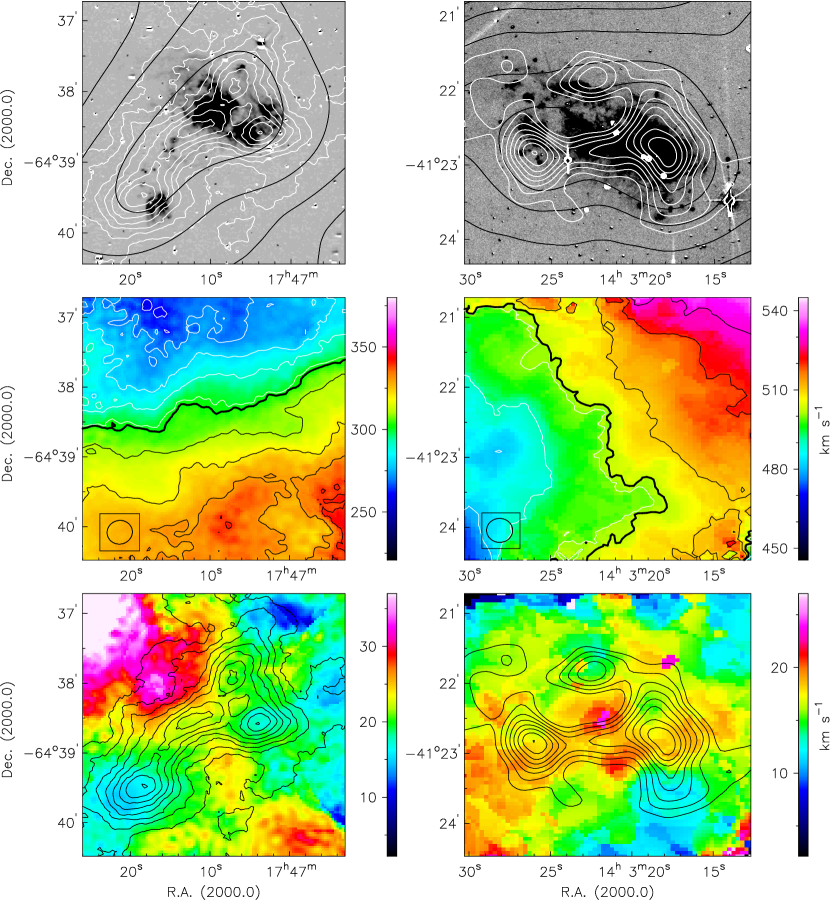
We also show the H i intensity distribution at higher spatial resolution (21″ 20″) for a better comparison with the optical data. In the upper left panel of Fig. 4, the high-resolution H i intensity contours are overlaid in white onto the continuum-subtracted H image. Additionally, the innermost contours of the low-resolution H i intensity distribution are displayed in black. As the high-resolution contours show, the central elongated maximum is split into several smaller, point-like maxima. Interestingly, all these maxima are clearly offset from the most prominent H ii regions.
|
3.2 NGC 5408
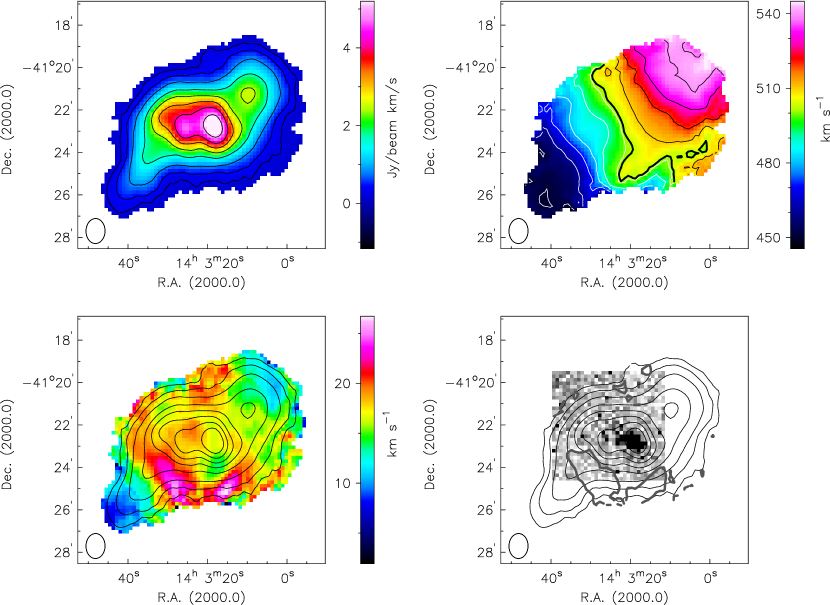
Like IC 4662, NGC 5408 reveals a slightly elongated stellar disc with a position angle of 62°, which leads to a box-like appearance in the optical (see Fig. 1, lower left panel). The main star-forming knots are located along a chain running from the centre to the main star formation area in the south-west. In H, the galaxy is dominated by a bright complex of H ii regions in the south-west (Fig. 1, lower right panel) that coincides with the brightest star clusters. In the eastern part, the ionised gas becomes more patchy with a few holes in the distribution and several filaments emanating from the disc. Indeed, it seems that the eastern part of the galaxy ends in a superbubble as suggested by the shell-like structures visible in the north- and south-east and the big hole in between. Diffuse gas can also be seen across the southern part of the galaxy.
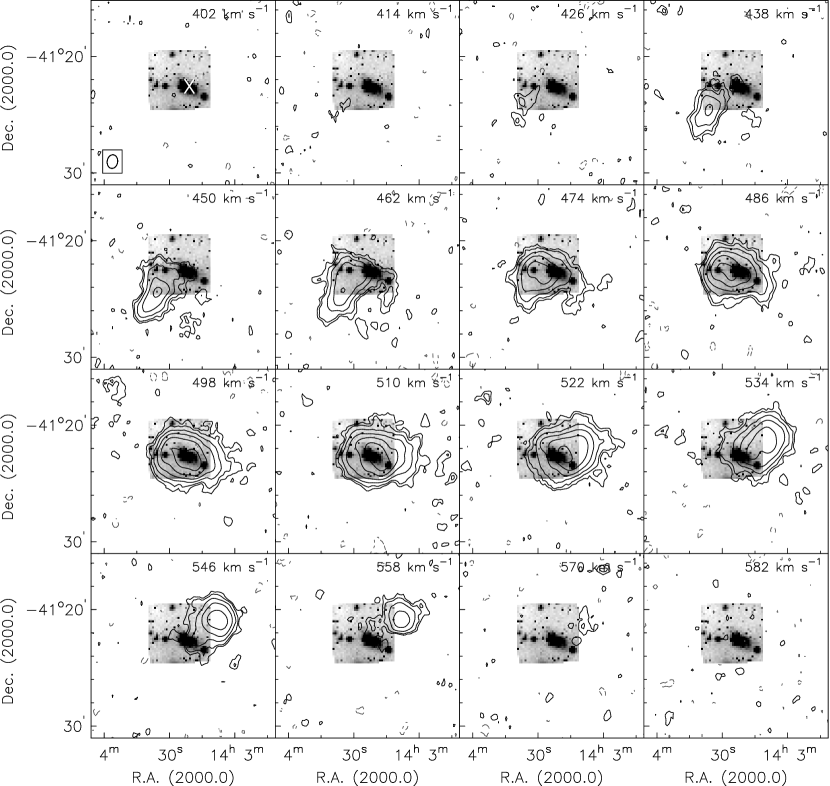
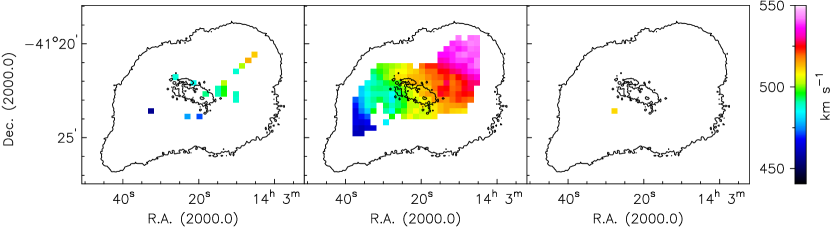
Figure 5 shows the low-resolution H i channel maps of NGC 5408. We detected emission over 130, from 430 to 560. In the inner parts the emission is elongated along the east-west axis (position angle of 90°), whereas in the outer parts it is more extended to the north-west and south-east (position angle of 135°). The integrated H i intensity distribution looks fairly symmetric and reveals two point-like maxima in the centre (see Fig. 5 and upper left panel of Fig. 6). A comparison with the ionised gas distribution shows that the western H i intensity maximum coincides with the centre of the optical emission in NGC 5408 (see Fig. 6, lower right panel). On larger scales, the distribution of the neutral gas seems to be warped in the outer parts, which explains the two orientations seen in the channel maps (Fig. 5). In comparison to the ionised gas, the neutral gas component is four times more extended, which is again an unusually high ratio (for the H i diameter see Table 5). We measured the flux density to be Jy, from which we derived a total H i mass of M⊙ (Table 5). This is again within the errors of the HIPASS value of Jy.
Again, we overlaid the high-resolution H i intensity contours (20″ 20″) in white over the continuum-subtracted H image (Fig. 4, upper right panel). The distribution shows two prominent maxima which coincide with the point-like maxima detected on the low-resolution H i map (black contours). The western extended maximum coincides with the main H ii region complex in NGC 5408, although it is not fully centred on the brightest H ii region. It is connected via a bridge with the eastern maximum which is clearly offset from the southern shell-like structure mentioned above. Additionally, the high-resolution H i intensity distribution reveals a third, weaker maximum in the north, close to, but offset from the northern shell-like structure. In agreement with the distribution of the ionised gas, the H i column density between the shell-like structures is very low. This confirms our findings in the optical data, i.e., the existence of a superbubble in the eastern part of NGC 5408.
4 Kinematic analysis
The comparison of the optical and H i morphology in IC 4662 and NGC 5408 showed that on low-resolution scales, the optical extent coincides very well with the central H i maximum. However, the high-resolution H i maps reveal that the peaks in the neutral gas distribution are typically offset from the H ii regions. On larger scales, the optical appearance of both galaxies is defined by an alignment which is perpendicular to the extended H i distribution (IC 4662) or differs by at least 45° (NGC 5408).
In this section, we analyse the kinematics of the two galaxies in order to study the properties of both their neutral and ionised gas components. All given velocities are heliocentric velocities measured along the line of sight.
4.1 The distorted H i kinematics of IC 4662
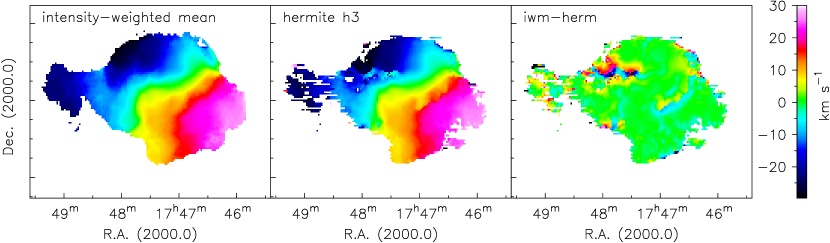
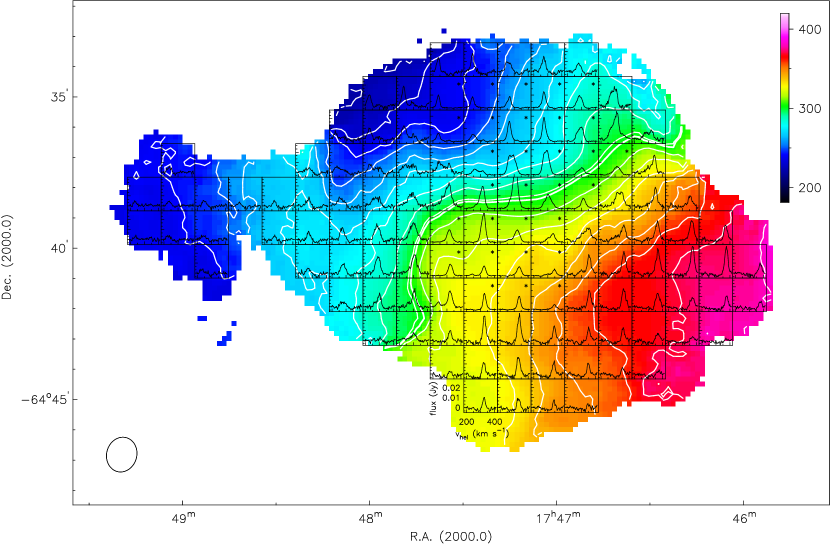
The H i velocity field of IC 4662 (Fig. 3, upper right panel; see also Fig. 4, middle row, left panel) is very disturbed. The overall velocity gradient runs from the north-east with velocities of 220 to the south-west with velocities of 380. The direction of the rotation of the neutral gas seems to change from the western part of the galaxy to the eastern part, causing a sudden change of the position angle of almost 90°. This change is possibly connected with the two perpendicular systems as discussed in Sect. 3.1. The H i velocity dispersion map (lower left panel of Fig. 3, overlaid are the H i intensity contours; see also Fig. 4, lower left panel) shows a dispersion of 20 in the inner and 11 in the outer parts, except for two maxima with almost 40 east of the extended H i intensity maximum.
The large-scale twist in the velocity field makes it impossible to derive a rotation curve for IC 4662. We extracted spectra from the H i data cube to get a better understanding of the kinematics of the neutral gas. They are shown in Fig. 7: each box represents the sum of all spectra within 70″ 70″ (corresponding to one beam size). Stars denote spectra with a flux scale which is four times larger than that of the other spectra. It is obvious that across the whole distorted area, the H i line is often split into two, sometimes clearly separated components. The difference of about 70 is always the same, although the absolute velocities vary according to the rotation of IC 4662.
As already mentioned in Sect. 2.2, we created the velocity field using the intensity-weighted mean (iwm). However, as soon as the velocity distribution of the H i emission is not symmetric, the velocity values are biased to the longest tail of the velocity profiles (de Blok et al., 2008). Therefore, one might argue that the iwm velocity field does not represent the true velocities. A recently more popular approach is to fit the line profiles with Gauss-Hermite polynomials, which allows to define the peak velocities more accurately. This becomes important when components overlap. In the IC 4662 spectra, the two components are clearly separated with one of them dominating the H i profile. Hence, the difference between the iwm and the Hermite velocity field should be negligible. Nevertheless, we created the Hermite velocity field by fitting Gauss-Hermite h3 polynomials to all line profiles using the GIPSY task xgaufit (Fig. 16, middle panel). The right panel of Fig. 16 shows the residuals after subtracting the Hermite velocity field from the iwm. As we expected, the residuals are mostly close to zero, except for an area in the north-east. A look at the spectra (Fig. 7) reveals that the S/N in this area is quite low, which can often not be handled properly by the GIPSY moments task which we used to create the iwm velocity field. As the large-scale distortion is still very pronounced in the Hermite velocity field, we think that it is not a consequence of using the ’wrong’ method to create the velocity field, but that it is a real feature in IC 4662.
4.2 The H i velocity field of NGC 5408
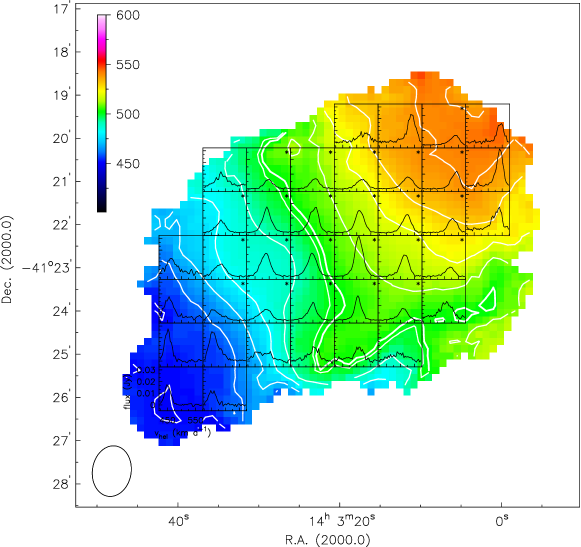
NGC 5408 shows a symmetric H i velocity field (Fig. 6, upper right panel; see also Fig. 4, middle row, right panel) with a velocity gradient running from the south-east with velocities of 450 to the north-west with velocities of 550. The gradient is smooth, even at both ends of the disc where the H i distribution looks warped. It even seems that it better follows the large scale structure than the inner east-west alignment. A local, quite prominent distortion of the velocity field can be seen south of the H i intensity maxima. The H i intensity distribution, however, appears to be smooth and undisturbed (see upper left panel of Fig. 6). The H i velocity dispersion (lower left panel of Fig. 6, overlaid are the H i intensity contours; see also Fig. 4, lower right panel) shows two peaks at 25, which are located on either side of the spur in the velocity field.
Again, we extracted the spectra from the H i data cube in order to analyse the profiles (see Fig. 8). Each box equals a beam size of 60″ 60″. Stars denote spectra with a flux scale which is four times larger than that of the other spectra. In general, the H i profiles look quite simple. The lines are broad with FWHM of 35 to 50, but often also symmetric with no second component clearly standing out. The high velocity dispersion in the south coincides with an area of very low S/N, which is probably again due to the inability of the moments task to properly handle noisy spectra. However, at the eastern edge we detected two components which are separated by about 40.
We tested the quality of the iwm velocity field by subtracting the Hermite velocity field: the residuals are very small except for the area of high velocity dispersion. As in the case of IC 4662, this can be explained by the low S/N and the line-splitting. For a direct comparison we refer the reader to van Eymeren et al. (2009) where the H i kinematics of several dwarf galaxies (among them NGC 5408) have been analysed by using the Hermite velocity fields.
4.3 The H i rotation curve of NGC 5408
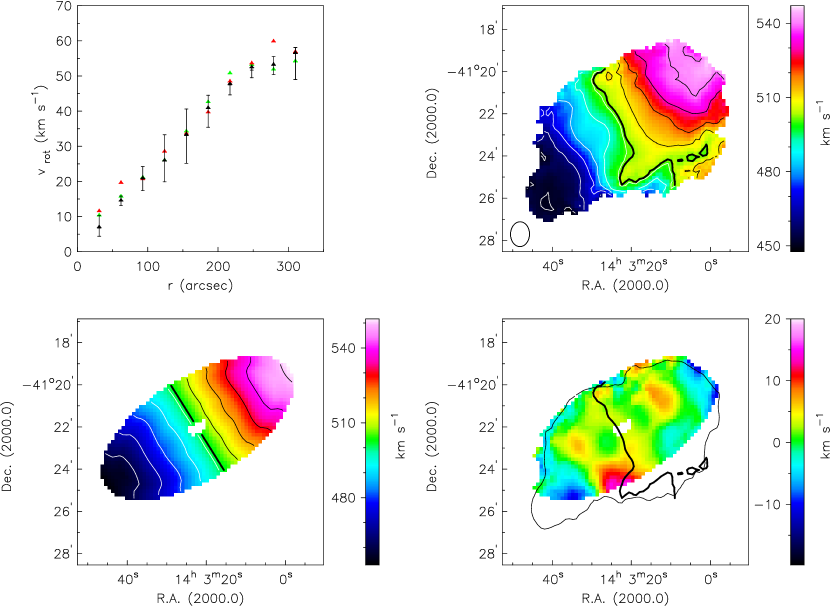
In order to make predictions about the fate of the gas, we need to know some of the kinematic parameters like the inclination and rotation velocity of NGC 5408. Therefore, we derived a rotation curve by fitting a tilted-ring model to the observed velocity field (GIPSY task rotcur, Begeman, 1989). Initial estimates for the relevant parameters (systemic velocity, the coordinates of the dynamic centre, the inclination, and the position angle) were obtained by interactively fitting ellipses to the H i intensity distribution with the GIPSY task ellfit. The width of the rings was chosen to be half the spatial resolution, i.e., 31″. In order to get the most precise values, three different approaches were made by always combining receding and approaching side. The upper left panel of Fig. 9 shows the resulting curves: first, we kept the initial estimates fixed in order to derive the rotation velocities (green (light grey) triangles). The best-fitting values for all parameters were derived by allowing only one parameter to vary with radius while keeping the remaining ones fixed. As no significant variation of any of the parameters over radius was noticed, we derived an average value (given in Table 5). The black triangles represent the resulting rotation velocities. The error bars indicate the values of the receding (top) and approaching side (bottom) when treated separately. In order to reproduce the result of the iterative approach, the so-derived parameters were all left free (red (dark grey) triangles). As the filling factor of the rings drops significantly beyond a radius of 320″, we did not fit the outer parts. That means we also miss most of the distortion at the southern edge of the galaxy.
NGC 5408 has a slowly rising rotation curve coming to a plateau at a radius of 250″. Receding and approaching side show a very similar kinematic behaviour up to a radius of 320″, confirming the impression of an evenly rotating galaxy. The initial estimates already defined the H i kinematics quite well as the green and black triangles are in very good agreement. The ’left-free’ approach is also in good agreement with the other two approaches, except for some scatter between 0″ and 100″. This is still far away from the disturbed region, which can therefore not explain the scatter.
The iterative approach results in an inclination angle of 62°, a position angle of 302°, and a systemic velocity of 502 (see also Table 5). The systemic velocity is slightly lower than the HIPASS velocity of 506 (Koribalski et al., 2004). In comparison to the parameters derived from optical data, the inclination of the neutral gas is higher by 10°. The value of the position angle of the neutral gas is dominated by the extended emission. As the optical disc is differently aligned (see Sect. 3.2), the H i position angle of 302° differs significantly from the optical position angle of 60°.
In order to prove the reliability of the calculated values, a model velocity field was created by using the best-fitting parameters (Fig. 9, lower left panel) and afterwards subtracted from the original velocity field (upper right panel). The residual map is shown on the lower right panel of Fig. 9 with the 3 contour from the low-resolution H i intensity map and the systemic velocity contour overplotted. It is obvious that the original velocity field is very well described by the derived kinematic parameters. The residuals are generally at 5, except for one region in the south, which shows residuals of about 15. This region adjoins the already mentioned distortion in the velocity field and the high velocity dispersion. We examine this issue in more detail in Sect. 4.4.2.
4.4 A detailed kinematic analysis of the H i and H line data
We now want to study the H i and H line profiles of both galaxies in more detail and to compare the peak velocities of the neutral and ionised gas. Therefore, we performed a Gaussian decomposition by interactively fitting the H i and H line emission (IRAF task splot). Only detections above a 3 threshold were considered.
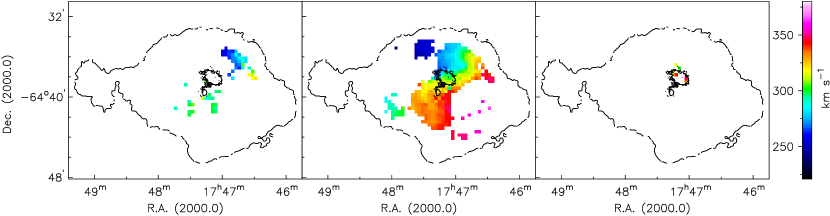
Figures 7 and 8 have already shown that the H i profiles of both galaxies are sometimes split into at least two components. For a better comparison with the H images, we used the high-resolution H i data cubes (see Sect. 2.2) to perform the Gaussian decomposition. As the extracted spectra are often quite noisy, especially in the outer parts of both galaxies, only the central parts are fitted. Figures 10 and 11 show the resulting maps: a map with the blue-shifted gas on the left, a map with the main component (component of highest intensity) in the middle and a map with red-shifted gas on the right. The velocities are averaged over 20″ 20″ in case of IC 4662 and 18″ 18″ in case of NGC 5408, which roughly corresponds to one beam size. For better visualisation, we overlaid the 3 H i intensity contour from the low-resolution data and the 3 H intensity contour from the H images (Fig. 1).
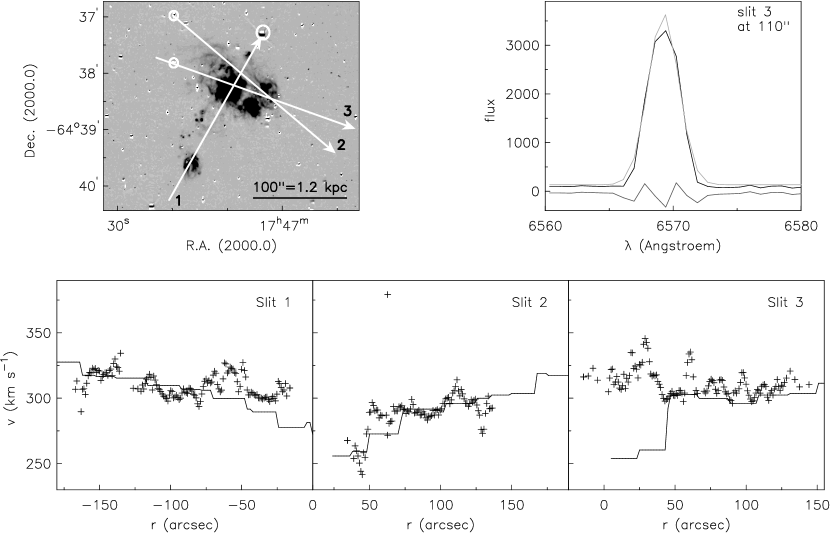
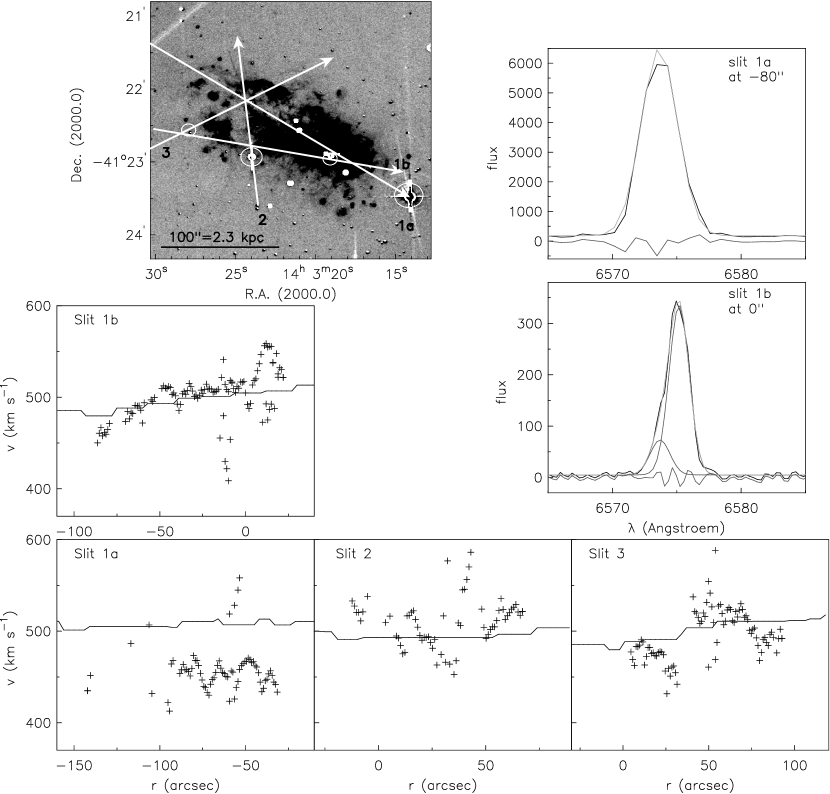
We then performed a Gaussian decomposition of the H line profiles as measured from the long-slit spectra. We measured the peak velocities in order to create position-velocity (pv) diagrams (Figs. 12, lower row and 13, middle left panel and lower row). The H velocities are indicated by + symbols. The corresponding H i velocities (solid lines) were extracted from the peak velocity fields of the main component (Figs. 10 and 11, middle panels). Both the H i and the H velocities are not corrected for inclination. Figures 12 and 13 also show the slit positions, plotted over the H image of each galaxy. Position 0 in the pv diagrams is marked by a small circle; the arrows indicate increasing distance from 0 in a positive sense. Examples illustrating the quality of the spectra and the analysis are given for both data sets in the upper right panel of Fig. 12 and in the upper and middle right panels of Fig. 13.
At first glance, the H emission line is quite broad along all slits. Observations of the ionised gas in other dwarf galaxies revealed outflows with expansion velocities of about 20 to 50 (e.g., Schwartz & Martin, 2004; van Eymeren et al., 2009a, b). For the data used in our analysis, this implies that it will be difficult to separate blended lines because of the relatively low spectral resolution (60 for the archival spectrum of NGC 5408, 112 for all other spectra). Therefore, we fitted the profiles with only one Gaussian unless a fit with two Gaussians gave reasonable values, i.e., . In many cases, a single Gaussian fit led to large residuals, which indicates that the H line is a superposition of at least two components (see, e.g., Fig. 12, upper right panel).
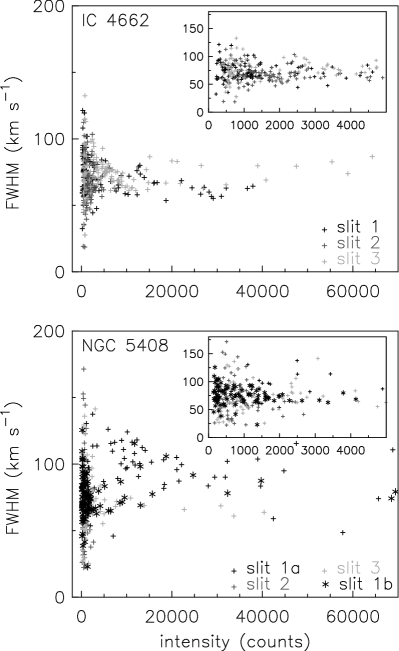
In Fig. 14 we present the FWHMs, corrected for instrumental broadening , of all fitted lines vs. the integrated intensity. Different shades of grey indicate FWHMs measured in spectra from different slit positions. The black stars denote the data of the archival spectrum of NGC 5408.
In the following subsections, we describe the kinematics of the neutral and ionised gas, point out peculiarities, and compare the kinematic behaviour of both gas components.
4.4.1 IC 4662
The high-resolution H i velocity maps of IC 4662 show that the neutral gas often consists of a single component that follows the overall rotation (Fig. 10). Red-shifted gas can be seen in the filamentary north-eastern part of the optical disc of IC 4662, which is offset from the main component by about 55. We did not find any more outflowing neutral gas associated with the optical disc. However, we detected blue-shifted gas north-west and south-east of the optical disc with expansion velocities of about 40 to 50 with respect to the main component, whose morphology gives the impression of some kind of bipolar outflow.
We then used the H i velocity values of the main component as a reference value for the velocities of the ionised gas. We obtained optical spectra of IC 4662 along three slit positions (Fig. 12, lower row). Slit 1 intersects the southern H ii region, the main H ii region complex, and the diffuse gas in between. South of the main H ii region complex, i.e., from ″ to ″, the ionised gas roughly follows the H i velocities. In most cases, however, the subtraction of the fitted Gaussian from the observed profile reveals two residuals which are symmetrically distributed. The FWHM is measured to be 70, which suggests a blue- and a red-shifted component with a velocity offset of 35 with respect to the H i line. Between ″ and ″, the ionised gas appears to be slightly red-shifted by 20 to 30 with respect to the neutral gas.
Slit 2 intersects the northern part of the main H ii region complex. The H emission detected along this slit follows the H i velocities quite well apart from a deviation of up to 20 red-shifted between 50″ and 80″. The FWHM of the lines in this area is quite low in comparison to the other positions along the slit, and the residuals after subtracting a single Gaussian are negligible. That means that here, we directly detected expanding gas located in the north-east of the optical disc.
Slit 3 intersects the central part of the main H ii region complex. The H velocities observed along this slit are in good agreement with the H i velocities from 50″ to 150″. We measured a FWHM of about 70 and detected significant residuals after subtracting a single Gaussian (see, e.g., Fig. 12, upper right panel). Therefore, the ionised gas probably consists of two components, a blue- and a red-shifted one, expanding with 35 with respect to the neutral gas. In the eastern filamentary area, i.e., from 0″ to 50″, the pv-diagram shows a significant deviation of the H velocities from the H i velocities. While the H velocities still seem to follow the velocity gradient of the neutral gas between 50″ and 150″, the H i velocities drop by about 40. Looking at the velocity map of the main component of the neutral gas (see Fig. 10, middle panel), it becomes clear that this drop is part of the large-scale velocity field and coincides with the twist in the central parts where the velocity gradient changes its direction (see also Sect. 3.1). That indicates that the neutral and ionised gas are kinematically decoupled. Still, if we extend the gradient between 50″ and 150″ down to 0″, the ionised gas seems to be red-shifted by 20 to 30. This red-shifted gas component was also detected in H i (see above).
Summarised, it can be said that the neutral and ionised gas are mostly in good agreement. The H residuals often imply the existence of two components, symmetrically distributed around the H i reference value. There are a few obvious discrepancies, which might indicate outflowing ionised gas, but which have also to be discussed in the context of a very disturbed H i velocity field (see Sect. 5.1).
4.4.2 NGC 5408
Similar to IC 4662, the H i line profiles of NGC 5408 often reveal a single component that follows the overall rotation. Coinciding with the northern part of the optical galaxy, the H i shows an additional component, which is blue-shifted with respect to the main line by about 30 (see Fig. 11).
Again, we used the H i peak velocities of the main component as a reference value for the H velocities. We analysed the kinematics of the ionised gas within NGC 5408 using spectra provided by two different observing runs (see Sect. 2.1.2). The panels located in the lower row of Fig. 13 show the pv diagrams of our own data, while the middle left panel represents the archival data.
In comparison to IC 4662, the velocities of NGC 5408 seem to deviate more and stronger from the H i reference value. Although the H line profile is generally well fitted by a single Gaussian, we detected more outflows as the outflowing gas often seems to dominate the intensity distribution.
The centre of the H emission in the south-west harbours a strong blue-shifted component, which has a velocity offset of about 60 in comparison to the neutral gas (see slit 1a). In slit 1b (the archival data), there is a hint of even higher blue-shifted ionised gas (up to 100). However, as only three measurements of this fast expanding outflow are available, we will not further consider it. Additionally, slit 1b shows a red-shifted component with a similar offset as seen in slit 1a of about 50. This component is only visible in the higher resolution data, although a few measurements have been made in slit 1a as well (at ″).
The southern part of the shell structure in the east (see Sect. 3.2) can kinematically be detected in slit 1b, 2, and 3. Slit 1b, that covers the edge of the shell, shows a blue-shifted component with a velocity offset of about 20 (at ″) with respect to the H i reference value. In slit 2, which fully intersects the potential superbubble, the blue-shifted gas is offset by 30 at 30″. Additionally, we see red-shifted gas at 20 along the whole slit and a hint of an even higher red-shifted outflow of 70 at 40″. Slit 3, that also fully intersects the potential superbubble, but at a different angle, shows blue-shifted gas at 30″, offset by 50, and at 80″, offset by 30. The latter outflow coincides with the northern part of the shell. Red-shifted gas at 20 is visible between the two blue-shifted outflows.
As mentioned above, the neutral gas shows a hint of a blue-shifted component in the northern part of the optical disc, offset by about 30 from the main component. This might be the counterpart of the expanding ionised gas. Other than that, the neutral gas does not seem to follow the motions of the ionised gas.
Altogether, the kinematic analysis confirms the suggestion we made in Sect. 3.2, i.e., that we detected an expanding superbubble in the north-east of NGC 5408. However, the relatively low spectral resolution and the poor spatial coverage make it impossible to model this superbubble.
5 Discussion
Our analysis has shown that both galaxies show differences in the kinematic behaviour of the neutral and ionised gas components. Often, this can be interpreted as evidence for outflows of the ionised gas. Sometimes, these outflows are detected in both H and H i. In this section, we discuss our results and make some predictions about the fate of the gas. We will also assess our results with respect to other studies of dwarf galaxies. Finally, we will come back to the peculiar H ii region in the south of IC 4662.
5.1 The outflows and the special case of IC 4662
The outflow velocities vary from 20 up to 60 in both galaxies. In some cases we found an H i counterpart for an expanding ionised gas structure, moving at about the same velocity. NGC 5408 shows little evidence for line-splitting in H i. The neutral gas distribution seems to be warped in the outer parts, which might indicate gas accretion, interaction with gas-rich companions or infall of H i clouds (see Sancisi et al., 2008, and references therein). However, NGC 5408 appears to be quite isolated and no H i clouds could be found in its near vicinity on our deep H i maps. Furthermore, gas infall would result in a lopsided gas distribution, i.e., more gas on one side than on the other, which is definitely not seen in NGC 5408. Therefore, the outflow scenario is much more likely.
From the morphology and the kinematics, we suggest that NGC 5408 harbours at least one expanding superbubble. In comparison to IC 4662, this galaxy shows outflows almost everywhere across the disc.
For IC 4662 no XMM Newton observations are available and the ROSAT X-ray All-Sky Survey does not show a source that could be associated with this galaxy. Nevertheless, IC 4662 is a very complex system: the comparison of the neutral and ionised gas kinematics revealed that it is very difficult to take the H i velocities as a reference value for the H velocities as the H i velocity field is quite distorted. Especially the discrepancy in slit 3 (see Fig. 12, lower right panel) is probably due to the large-scale H i velocity field and not due to an outflow of the ionised gas. The same might be true for slit 2 (between 30″ and 70″) where the H i velocities again drop significantly. However, here, the ionised gas seems to follow that movement. If we just look at the velocities of the ionised gas and try to define a velocity gradient across each slit, a velocity offset of about 20 blue-shifted can be seen, which coincides with the north-eastern filamentary area. From the morphology alone expanding gas is expected, but because of the distorted H i velocity field, and the lack of spatial coverage and spectral resolution of the long-slit spectra, it is difficult to quantify the outflow velocities.
As can be seen very nicely in NGC 5408 (Fig. 13, lower row), the kinematics of the ionised gas are dominated by stellar feedback causing offsets from the rotation velocity of the galaxy. This implies that the H velocities can not be assumed to reflect the rotation of a galaxy; instead, we rely on the H i velocities. However, in the case of IC 4662, the H i velocity field is very distorted as well, which is why we are very careful about our detections.
Looking at the large-scale structure, IC 4662 shows line-splitting of the H i line at many positions across the galaxy (Fig. 7). As already mentioned above (Sect. 4.1), the two components are often separated by about 70. Given the size of the optical galaxy in comparison to the distribution of the neutral gas, this is probably not caused by an interaction of stars and the ISM. As we see global line-splitting, the infall of single H i clouds is also highly unlikely. Instead, the line-splitting is probably a consequence of a large scale distortion like, e.g., a merger process. As IC 4662 is a very isolated galaxy, we may rule out any kind of current tidal interaction with another object. We think that it is more likely that two dwarf galaxies collided in the past and are now in the process of merging. This hypothesis explains the distorted kinematics we observe in IC 4662, the two perpendicular systems as observed in the H i distribution, and also the H i tail we found in the eastern part of the galaxy (see Fig. 3). There is increasing evidence that interactions and mergers of dwarf galaxies trigger star-formation activity in dwarf objects, but such features can only be detected when optical and radio observations are carefully compared (e.g., López-Sánchez et al., 2010).
5.2 Large FWHMs in IC 4662 and NGC 5408
The H line profiles of both galaxies show very large FWHMs (see Fig. 14). In the case of IC 4662, the FWHMs of the low intensity profiles are at about 70. Even for high intensity profiles, this number does not decrease, which means that the high FWHMs are not an effect of low S/N. 70 are far too high to be explained by thermal broadening alone as this would require an electron temperature of 125000°! Taking a reasonable value of the electron temperature of 10000 K gives a contribution of the thermal component of about 23. This still leaves us with 66 that have to be explained by other mechanisms. As shown in Sect. 4.4.1, the residuals after subtracting a single Gaussian from the observed line profile usually indicate that the H line is a superposition of at least two components. As the line has a symmetric shape, this may indicate expanding bubbles.
NGC 5408 also shows quite high FWHMs. Here, it becomes obvious that this result is also not an effect of the spectral resolution as the line widths remain equally broad when measured at higher spectral resolution (from the archival spectrum). In comparison to IC 4662, the FWHMs are more scattered, although they are preferably located in a band centred at 70, which is similar to the average value found for IC 4662. Additionally, the ionised gas observed in slit 1b reaches FWHMs of up to 100. These high values have mainly been found in the western H ii region, which is where the X-ray source is located.
Detailed studies of the velocity dispersion in H ii regions have been carried out by Muñoz-Tuñón et al. (1996) and later by Martínez-Delgado et al. (2007). Their diagrams show very similar patterns compared to ours: a narrow horizontal band and inclined bands at higher velocity dispersion, which they interprete as coming from faint expanding bubbles and shells. Indeed, we found the largest FWHMs to coincide with areas of filamentary structure (IC 4662) or potential superbubbles (NGC 5408).
5.3 Outflow or galactic wind?
As we could not derive a reasonable rotation curve from the distorted velocity field of IC 4662, we focus this analysis on NGC 5408.
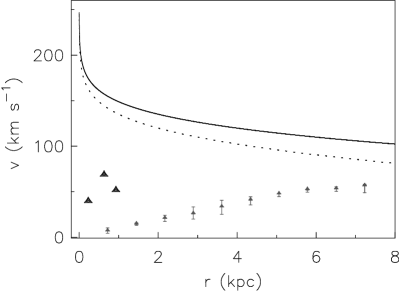
Following the method described in van Eymeren et al. (2009a), we compared the expansion velocities with the escape velocity of NGC 5408 in order to make predictions about the fate of the outflowing gas structures. The escape velocity was estimated by using the cored pseudo-isothermal halo model, which represents the shape of the rotation curves best, especially in the inner few kpcs (e.g., van Eymeren et al., 2009), which is where we detected the outflows. Only the circular velocity and the maximum halo radius have to be known in order to calculate the escape velocity. The circular velocity was estimated from the plateau of the H i rotation curve. We derived the escape velocity for two different radii. First, we took the outer radius of the H i intensity distribution (9.5 kpc) as a lower limit for the halo size. As a second estimate we calculated the escape velocity using twice the H i radius (19 kpc), which we consider to be a more physical assumption. The resulting curves are shown in Fig. 15 (dotted and solid lines respectively). The observed rotation curve is indicated by small grey triangles; the outflows with their distances from the dynamic centre and their velocities compared to the H i velocities are marked by large black triangles. A higher results in an increase of the escape velocity. As the radius of the dark matter halo is probably much higher than assumed, the escape velocities will be even higher than the ones we derived. The curve with gives therefore a lower limit for the escape velocity values. As can be seen, the expansion velocities of the outflows, although partially quite significant, stay far below the escape velocity, even for the lower limit case. This is mainly due to the fact that they were found close to the dynamic centre where the escape velocities are high.
5.4 Comparison with previous work
We now compare our results for IC 4662 and NGC 5408 with similar studies from the literature. Many dwarf galaxies reveal filaments and shell-like structures up to kpc-size on deep H images (see, e.g., Hunter et al., 1993; Bomans et al., 1997; van Eymeren et al., 2007). Spectral line data show H line splitting, indicating outflowing gas, which is often associated with these filaments and shells (e.g., Martin, 1998). Partly, the neutral gas is visibly affected by the expanding ionised gas as can, e.g., be seen in the starburst dwarf galaxy NGC 5253 (Kobulnicky & Skillman, 2008). The neutral gas is pushed by the ionised gas, which leads to the observed expansion velocities. On the other hand, the surrounding neutral gas decelerates the expanding bubble so that it might eventually be stalled by the neutral gas envelope (Kobulnicky & Skillman, 2008). Figure 4 shows very nicely how the expanding gas can affect the neutral gas, as, e.g., NGC 5408 has a local H i minimum in the centre of the potential superbubble. A very similar morphology has been found in NGC 5253 (López-Sánchez et al., 2010). NGC 2366 (van Eymeren et al., 2009a) and NGC 4861 (van Eymeren et al., 2009b) also show H i minima coinciding with expanding ionised gas structures.
The expansion velocities of the galaxies in our sample (including NGC 2366 and NGC 4861) vary between 20 and 60. These values are in good agreement with previous studies: Heckman et al. (1995) and Westmoquette et al. (2008) found expansion velocities between 50 and 100 in NGC 1569; Schwartz & Martin (2004), using absorption line studies, found the expansion velocities of a sample of dwarf galaxies to be about 30. An exception seems to be the Wolf-Rayet blue compact dwarf galaxy He 2-10, where expansion velocities up to 250 have been detected (Méndez et al., 1999). Note that more massive galaxies like M 82 show outflows with expansion velocities higher than 100 (Schwartz & Martin, 2004; Strickland & Heckman, 2007; Westmoquette et al., 2009). In our sample, the highest velocities have been found in NGC 5408.
How high do the expansion velocities have to be to turn an outflow into a galactic wind? Coming back to our sample (including NGC 2366 and NGC 4861, but excluding IC 4662 whose velocity field is too distorted to derive a rotation curve and the associated escape velocity), it could be shown that the expansion velocities of the outflows only account for 30 to 50% of the escape velocities. Note that these velocities were calculated under the assumption that the radius of the dark matter halo equals the H i radius. As is probably much higher, the resulting escape velocities will be higher, which therefore further decreases the possibility of a galactic wind. This result is consistent with studies of other dwarf galaxies (e.g., Martin, 1998; Schwartz & Martin, 2004). An exception is NGC 1569 which rotates very slowly with only 30(Heckman et al., 1995), but harbours outflows with expansion velocities of up to 100 (Heckman et al., 1995; Westmoquette et al., 2008). Still, a galactic wind could not be confirmed, although the chances are much higher than in other dwarf galaxies. Another exception is He 2-10 (Méndez et al., 1999), which however, as mentioned before, shows very fast expanding gas with velocities up to 250.
At first glance, all of these non-detections of a galactic wind look like a contradiction with theoretical models like, e.g., the superbubble model by Mac Low & Ferrara (1999). Note, however, that outflowing gas is mostly detected close to the dynamic centre, where the escape velocities are very high. Only a few kpcs away from the dynamic centre, the escape velocity drops significantly (see, e.g., Fig. 15), increasing the chance of a galactic wind. As the surface brightness goes with with being the electron density, a less dense gas will be much more difficult to detect. This implies that the outer regions of an outflow will easily escape the detection in emission line studies (e.g., Bomans et al., 2007), which means that we consistently miss the fastest moving gas. A study of the interstellar NaI absorption line (which is as an absorption line not affected by the problem) does not help since NaI traces much cooler, denser gas, which is probably not as much accelerated as the diffuse HII.
Additionally, we have to take into account the dynamic masses of our sample galaxies, which are of the order of a few times 109 M⊙, i.e., close to the upper limit of the mass range of dwarf galaxies. As Fig. 2 in Mac Low & Ferrara (1999) shows, at total masses of 109 M⊙, most of the gas is still bound to the disk when the energy input stops. This strong dependence of blow-out on the mass of the galaxy has already been noted by De Young & Heckman (1994). Furthermore, the central star clusters in, e.g., NGC 2366 (Drissen et al., 2001) or NGC 4861 (e.g., Barth et al., 1994) are only a few Myrs old. If we assume that the current star formation episode is the driver of the outflows, it makes a superbubble blowout even more unlikely.
It is also possible that the expansion velocity of the outflows will never get close to or beyond the escape velocity due to the dark matter halo that slows down the gas that was expelled from the disc (Silich & Tenorio-Tagle, 1998). Their 2d calculations of multi-supernova remnants evolving in dwarf galaxies show that the total retention of the outflowing gas is very likely for galaxies with an ISM mass of about 109 M⊙.
Altogether, this means that our observations (including NGC 2366 and NGC 4861) are in good agreement with other observations and with the simulations. All sample galaxies harbour filaments and shells that could be shown to expand, but no evidence for a galactic wind could be found.
As the expansion velocities in IC 4662 are comparable to those detected in the other three galaxies, we suppose that we would find similar results for this galaxy. However, if this galaxy is a merging system, processes with much more impact than star formation activity probably dominate the kinematic behaviour.
5.5 The southern H ii region in IC 4662
The southern H ii region in IC 4662 has been and still is a subject of great interest. It appears to be detached from the main body. Furthermore, Hidalgo-Gámez et al. (2001) pointed out that it differs significantly from the main body in oxygen abundance. Therefore, the question arises whether it is an own system interacting with IC 4662 (e.g., H. Lee, private communication) or just an unusually placed OB association. Our deep H image shows that this bright H ii region is at least connected to the main complex by a chain of small H ii regions and diffuse filamentary gas structures (see Sect. 3 and Noeske et al., 2003). Moreover, together with the main body this region is embedded into the highest column density H i. Additionally, its kinematics do not differ from the main body, but follow the rotation of the whole optical system. All these detections suggest that the southern H ii region is part of IC 4662.
Similar features have been found in the blue compact dwarf galaxy NGC 1140: a chain of H ii regions that emanates south of the main body, and a core which is kinematically decoupled from the rest of the galaxy (Hunter et al., 1994; Westmoquette et al., 2010). Therefore, this galaxy was suggested to be a merger remnant (Hunter et al., 1994). A study of 20 starburst galaxies by López-Sánchez (2010) has shown that in fact almost all of them show signs of interaction or of merging with small companions. They conclude that interactions play an important role in the triggering mechanism of the strong star-formation activity observed in dwarf galaxies.
Taking into account all the observational peculiarities and this similarity to NGC 1140, we definitely need to discuss the detached H ii region in IC 4662 in the context of a possible merger. If IC 4662 indeed consists of two merging or merged systems, the difference in the chemical composition might indicate that the main H ii region complex belongs to one galaxy and the southern H ii region to the second galaxy. Detailed multi-wavelength observations of IC 4662 (and other blue compact dwarf galaxies) are on the way (see also López-Sánchez et al., 2010).
6 Summary
We analysed H i and optical data of the two peculiar dwarf galaxies IC 4662 and NGC 5408 to compare the morphology and the kinematics of the neutral and ionised gas components.
In both galaxies, we detected outflows in H, sometimes with an H i counterpart, which show expansion velocities of 20 to 60. The FWHMs of the H lines are as high as 70, independent of the intensity of the lines. This suggests that other mechanisms apart from thermal broadening are taking place. In many cases, the H line is probably a superposition of at least two components, which indicates that expanding superbubbles might cause the high FWHMs. Higher spectral resolution data are necessary to study the outflows in more detail.
We compared the expansion velocities measured in NGC 5408 with the escape velocity of the galaxy and conclude that it is very unlikely that the gas will be blown away. This is in agreement with many previous studies.
As IC 4662 has a very distorted H i velocity field, we did not perform an analysis of the fate of the gas. Nevertheless, we detected outflowing ionised gas. The neutral gas often consists of two components, separated by 70. We suggest that this galaxy is actually a merger of two independent dwarf systems. The most peculiar feature in IC 4662 is the southern H ii region, whose origin is still not clear. Although our analysis indicates that it is probably a part of the galaxy, it may also be the remnant of one of the two merged systems.
Acknowledgements
The authors would like to thank the anonymous referee for his very constructive feedback which helped to significantly improve this paper.
This work was partly supported by the Deutsche Forschungsgesellschaft (DFG)
under the SFB 591, by the Research School of the Ruhr-Universität Bochum, by
the Australia Telescope National Facility, CSIRO, and by the DAAD. We made
extensive use of NASA’s Astrophysics Data System (ADS) Bibliographic Services
and the NASA/IPAC Extragalactic Database (NED) which is operated by the Jet
Propulsion Laboratory, California Institute of Technology, under contract with
the National Aeronautics and Space Administration.
References
- Barth et al. (1994) Barth C. S., Cepa J., Vilchez J. M., Dottori H. A., 1994, AJ, 108, 2069
- Begeman (1989) Begeman K. G., 1989, A&A, 223, 47
- Bohuski et al. (1972) Bohuski T. J., Burbidge E. M., Burbidge G. R., Smith M. G., 1972, ApJ, 175, 329
- Bomans (2001) Bomans D. J., 2001, ApSS, 276, 783
- Bomans (2005) Bomans D. J., 2005, in AIP Conf. Proc. 783: The Evolution of Starbursts Outflows and galactic winds of dwarf galaxies. p. 98
- Bomans et al. (1997) Bomans D. J., Chu Y., Hopp U., 1997, AJ, 113, 1678
- Bomans et al. (2007) Bomans D. J., van Eymeren J., Dettmar R.-J., Weis K., Hopp U., 2007, New Astronomy Review, 51, 141
- de Blok et al. (2008) de Blok W. J. G., Walter F., Brinks E., Trachternach C., Oh S.-H., Kennicutt R. C., 2008, AJ, 136, 2648
- de Vaucouleurs (1975) de Vaucouleurs G., 1975, Nearby Groups of Galaxies. Galaxies and the Universe, p. 557
- de Vaucouleurs et al. (1991) de Vaucouleurs G., de Vaucouleurs A., Corwin H. G., Buta R. J., Paturel G., Fouque P., 1991, Third Reference Catalogue of Bright Galaxies. Volume 1-3, XII, 2069 pp. 7 figs.. Springer-Verlag Berlin Heidelberg New York
- De Young & Heckman (1994) De Young D. S., Heckman T. M., 1994, ApJ, 431, 598
- Drissen et al. (2001) Drissen L., Crowther P. A., Smith L. J., Robert C., Roy J., Hillier D. J., 2001, ApJ, 546, 484
- Ferrara & Tolstoy (2000) Ferrara A., Tolstoy E., 2000, MNRAS, 313, 291
- Heckman et al. (1995) Heckman T. M., Dahlem M., Lehnert M. D., Fabbiano G., Gilmore D., Waller W. H., 1995, ApJ, 448, 98
- Hidalgo-Gámez et al. (2001) Hidalgo-Gámez A. M., Masegosa J., Olofsson K., 2001, A&A, 376, 386
- Hunter & Gallagher (1997) Hunter D. A., Gallagher J. S., 1997, ApJ, 475, 65
- Hunter et al. (1993) Hunter D. A., Hawley W. N., Gallagher J. S., 1993, AJ, 106, 1797
- Hunter et al. (1994) Hunter D. A., van Woerden H., Gallagher III J. S., 1994, ApJS, 91, 79
- Kaaret & Corbel (2009) Kaaret P., Corbel S., 2009, ApJ, 697, 950
- Karachentsev et al. (2006) Karachentsev I. D., Dolphin A., Tully R. B., Sharina M., Makarova L., Makarov D., Karachentseva V., Sakai S., Shaya E. J., 2006, AJ, 131, 1361
- Karachentsev et al. (2002) Karachentsev I. D., Sharina M. E., Dolphin A. E., Grebel E. K., Geisler D., Guhathakurta P., Hodge P. W., Karachentseva V. E., Sarajedini A., Seitzer P., 2002, A&A, 385, 21
- Kobulnicky & Skillman (2008) Kobulnicky H. A., Skillman E. D., 2008, AJ, 135, 527
- Koribalski (2008) Koribalski B. S., 2008, The Local Volume HI Survey (LVHIS). In Galaxies in the Local Volume, edited by Koribalski, B. S.; Jerjen, H., Berlin: Springer, 2008; p. 41
- Koribalski et al. (2004) Koribalski B. S., et al., 2004, AJ, 128, 16
- Koribalski et al. (2010) Koribalski B. S., et al., 2010, in prep.
- Lang et al. (2007) Lang C. C., Kaaret P., Corbel S., Mercer A., 2007, ApJ, 666, 79
- Larson (1974) Larson R. B., 1974, MNRAS, 169, 229
- Lauberts & Valentijn (1989) Lauberts A., Valentijn E. A., 1989, The surface photometry catalogue of the ESO-Uppsala galaxies. Garching: European Southern Observatory, —c1989
- López-Sánchez (2010) López-Sánchez Á. R., 2010, A&A, in rev.
- López-Sánchez & Esteban (2008) López-Sánchez Á. R., Esteban C., 2008, A&A, 491, 131
- López-Sánchez et al. (2010) López-Sánchez Á. R., Koribalski B., Esteban C., Popping A., van Eymeren J., Hibbard J., 2010, A multiwavelength analysis of Blue Compact Dwarf Galaxies: HI results
- López-Sánchez et al. (2010) López-Sánchez Á. R., Koribalski B., van Eymeren J., Esteban C. e. a., 2010, MNRAS
- Mac Low & Ferrara (1999) Mac Low M., Ferrara A., 1999, ApJ, 513, 142
- Marlowe et al. (1995) Marlowe A. T., Heckman T. M., Wyse R. F. G., Schommer R., 1995, ApJ, 438, 563
- Martin (1998) Martin C. L., 1998, ApJ, 506, 222
- Martínez-Delgado et al. (2007) Martínez-Delgado I., Tenorio-Tagle G., Muñoz-Tuñón C., Moiseev A. V., Cairós L. M., 2007, AJ, 133, 2892
- Méndez et al. (1999) Méndez D. I., Esteban C., Filipović M. D., Ehle M., Haberl F., Pietsch W., Haynes R. F., 1999, A&A, 349, 801
- Muñoz-Tuñón et al. (1996) Muñoz-Tuñón C., Tenorio-Tagle G., Castaneda H. O., Terlevich R., 1996, AJ, 112, 1636
- Noeske et al. (2003) Noeske K. G., Papaderos P., Cairós L. M., Fricke K. J., 2003, A&A, 410, 481
- Norman & Ikeuchi (1989) Norman C. A., Ikeuchi S., 1989, ApJ, 345, 372
- Richter et al. (1991) Richter G. M., Lorenz H., Bohm P., Priebe A., 1991, Astronomische Nachrichten, 312, 345
- Sancisi et al. (2008) Sancisi R., Fraternali F., Oosterloo T., van der Hulst T., 2008, A&ARv, 15, 189
- Sault et al. (1995) Sault R. J., Teuben P. J., Wright M. C. H., 1995, in R. A. Shaw, H. E. Payne, & J. J. E. Hayes ed., Astronomical Data Analysis Software and Systems IV Vol. 77 of Astronomical Society of the Pacific Conference Series, A Retrospective View of MIRIAD. pp 433
- Schlegel et al. (1998) Schlegel D. J., Finkbeiner D. P., Davis M., 1998, ApJ, 500, 525
- Schwartz & Martin (2004) Schwartz C. M., Martin C. L., 2004, ApJ, 610, 201
- Shapiro & Field (1976) Shapiro P. R., Field G. B., 1976, ApJ, 205, 762
- Silich & Tenorio-Tagle (2001) Silich S., Tenorio-Tagle G., 2001, ApJ, 552, 91
- Silich & Tenorio-Tagle (1998) Silich S. A., Tenorio-Tagle G., 1998, MNRAS, 299, 249
- Soria et al. (2006) Soria R., Fender R. P., Hannikainen D. C., Read A. M., Stevens I. R., 2006, MNRAS, 368, 1527
- Soria et al. (2004) Soria R., Motch C., Read A. M., Stevens I. R., 2004, A&A, 423, 955
- Strickland & Heckman (2007) Strickland D. K., Heckman T. M., 2007, ApJ, 658, 258
- Strohmayer & Mushotzky (2009) Strohmayer T. E., Mushotzky R. F., 2009, ApJ, 703, 1386
- Strohmayer et al. (2007) Strohmayer T. E., Mushotzky R. F., Winter L., Soria R., Uttley P., Cropper M., 2007, ApJ, 660, 580
- Tody (1993) Tody D., 1993, in R. J. Hanisch, R. J. V. Brissenden, & J. Barnes ed., Astronomical Data Analysis Software and Systems II Vol. 52 of Astronomical Society of the Pacific Conference Series, IRAF in the Nineties. pp 173
- van der Hulst et al. (1992) van der Hulst J. M., Terlouw J. P., Begeman K. G., Zwitser W., Roelfsema P. R., 1992, in Worrall D. M., Biemesderfer C., Barnes J., eds, Astronomical Data Analysis Software and Systems I Vol. 25 of Astronomical Society of the Pacific Conference Series, The Groningen Image Processing SYstem, GIPSY. pp 131
- van Dokkum (2001) van Dokkum P. G., 2001, PASP, 113, 1420
- van Eymeren (2008) van Eymeren J., 2008, PhD thesis, Astronomisches Institut der Ruhr-Universitaet Bochum, Germany
- van Eymeren et al. (2007) van Eymeren J., Bomans D. J., Weis K., Dettmar R.-J., 2007, A&A, 474, 67
- van Eymeren et al. (2009a) van Eymeren J., Marcelin M., Koribalski B., Dettmar R.-J., Bomans D. J., Gach J.-L., Balard P., 2009a, A&A, 493, 511
- van Eymeren et al. (2009b) van Eymeren J., Marcelin M., Koribalski B. S., Dettmar R., Bomans D. J., Gach J., Balard P., 2009b, A&A, 505, 105
- van Eymeren et al. (2009) van Eymeren J., Trachternach C., Koribalski B. S., Dettmar R., 2009, A&A, 505, 1
- Westmoquette et al. (2010) Westmoquette M. S., Gallagher J. S., de Poitiers L., 2010, MNRAS, pp 173
- Westmoquette et al. (2008) Westmoquette M. S., Smith L. J., Gallagher J. S., 2008, MNRAS, 383, 864
- Westmoquette et al. (2009) Westmoquette M. S., Smith L. J., Gallagher J. S., Trancho G., Bastian N., Konstantopoulos I. S., 2009, ApJ, 696, 192
- Yang et al. (1996) Yang H., Chu Y.-H., Skillman E. D., Terlevich R., 1996, AJ, 112, 146
Appendix A Intensity-weighted mean vs. Hermite velocity field
Here, we present the intensity-weighted mean (iwm) and the Hermite velocity field of IC 4662 (Fig. 16, left and middle panels). By applying Gauss-Hermite h3 polynomials to a set of spectra, the peak velocities can be defined more accurately as this method is not biased by low S/N or blended lines. However, in the case of IC 4662 (and also in the case of NGC 5408), the H i profiles are either symmetric and simple or the components can well be differentiated. This is confirmed if we subtract the Hermite velocity field from the iwm velocity field (Fig. 16, right panel): the two velocity fields only differ in areas of very low S/N. The large scale velocity field remains the same.