Helium reionization and the thermal proximity effect
Abstract
We examine the temperature structure of the intergalactic medium (IGM) surounding a hard radiation source, such as a Quasi-Stellar Object (QSO), as it responds to the onset of helium reionization by the source. We model the reionization using a radiative transfer (RT) code coupled to a particle-mesh (PM) -body code. Neutral hydrogen and helium are initially ionized by a starburst spectrum, which is allowed to gradually evolve into a power law spectrum (). Multiple simulations were performed with different times for the onset and dominance of the hard spectrum, with onset redshifts ranging from to 5.5. The source is placed in a high-density region to mimic the expected local environment of a QSO. Simulations with the source placed in a low-density environment were also performed as control cases to explore the role of the environment on the properties of the surrounding IGM. We find in both cases that the IGM temperature within the He region produced exceeds the IGM temperature before full helium reionization, resulting in a “thermal proximity effect,” but that the temperature in the He region increases systematically with distance from the source. With time the temperature relaxes with a reduced spread as a function of impact parameter along neighbouring lines of sight, although the trend continues to persist until . Such a trend could be detected using the widths of intervening metal absorption systems using high resolution, high signal-to-noise ratio spectra. By contrast, the Doppler widths of H absorption features in mock spectra along neighbouring lines of sight show a weak trend with impact parameter prior to full helium reionization reflecting the behaviour of the underlying density and peculiar velocity fields, but they take on a near constant value after helium reionization, with a median value near at , in good agreement with observations.
keywords:
radiative transfer – quasars: absorption lines – quasars: general – cosmology: large-scale structure of Universe – methods: N-body simulations1 Introduction
An abundance of observational evidence shows that subsequent to the Recombination Era, during which both hydrogen and helium recombined to their neutral forms, the Universe was reionized. The best constraints on the epoch of hydrogen reionization are derived from measurements of the intergalactic Lyman resonance line transitions in the spectra of high redshift Quasi-Stellar Objects (QSOs) and polarization measurements of the Cosmic Microwave Background (CMB). The measured optical depths of intergalactic Ly and Ly absorption in high redshift QSOs show that the Universe was reionized by (Becker & et al, 2001; Fan et al., 2002). This is consistent with CMB measurements by the Wilkinson Microwave Anisotropy Probe (WMAP), which place the hydrogen reionization epoch, if a sudden process, at (Dunkley et al., 2009). The sources of hydrogen reionization are currently unknown, but are strongly suspected of being young star-forming galaxies. More speculative possibilities include pockets of Population III stars, as may arise in isolated star clusters (Madau et al., 1999; Choudhury & Ferrara, 2006), or miniquasars (Madau et al., 2004). Hydrogen reionization by QSOs is untenable based on current estimates of the QSO luminosity function, unless there is a sharp rise at the faint end at high redshifts (Meiksin, 2005; Cowie et al., 2009).
The reionization epoch of helium, by contrast, is far less well constrained. This is primarily because of the need to go to space to measure the intergalactic Lyman series absorption of intergalactic gas in the spectra of high redshift QSOs. The current constraints place the helium reionization epoch, when helium becomes nearly fully doubly ionized, at (Reimers et al., 2005). Because of the high photoelectic threshold energy of He , it is expected that helium was reionized by QSOs rather than stars, most likely in the redshift interval (Madau & Meiksin, 1994; Meiksin, 2005; McQuinn et al., 2009).
Measurements of the He Ly optical depth show the optical depth rises rapidly approaching with an increasing amount of patchiness (Zheng et al., 2004; Fechner et al., 2006). By , the optical depth is immeasurably large (Zheng et al., 2008). The limits are not yet strong enough to demonstrate the epoch of helium has been detected, but the rapid rise in optical depth and degree of patchiness are suggestive of an approach to the helium reionization epoch. This interpretation, however, is not unique: it may also indicate a diminishing attenuation length of He -ionising photons, resulting in large fluctuations in the He -ionising metagalactic background due to large local Poisson fluctuations in the numbers of QSOs contributing to the background (Meiksin, 2007). The uncertainty in QSO counts and the spectral shape of high redshift QSOs still does not allow much earlier reionization, up to , to be excluded (Meiksin, 2005).
In this paper, we examine an alternative means of probing the epoch when helium in the intergalactic medium (IGM) surrounding a QSO was reionized: detections of a heightened IGM temperature above the post-reionization equilibrium value. The temperature following full helium reionization will reach high values as the helium ionization front (I-front) passes, eventually establishing a lower temperature in overdense regions as the gas achieves thermal equilibrium (Meiksin, 1994; Tittley & Meiksin, 2007; McQuinn et al., 2009). If the IGM near the QSO is polluted with metal lines, then a direct determination of the gas temperature may be made by combining the measured linewidths of the metals, provided they are adequately resolved (Rauch et al., 1996; Meiksin, 2007). Because of the low abundances of intergalactic metals, however, measurements have so far been restricted to high H column density systems. The advent of large telescopes, like the Thirty Meter Telescope111http://www.tmt.org or an Extremely Large Telescope222http://www.eso.org/sci/facilities/eelt/, may permit temperature measurements to be extended to much smaller column densities.
Whilst such direct temperature estimates are currently limited to high column density absorbers, the reionization of helium by a QSO will induce a “thermal proximity effect” in which the increased temperature near the QSO will be reflected by broadened hydrogen, as well as helium and metallic, absorption lines. The effect has been exploited as a means of probing the epoch of full helium reionization through the global statistical effect on the distribution of the H Doppler parameters for systems throughout the IGM. Rises in the lower cutoff of the Doppler parameter distribution have been reported by Ricotti et al. (2000) and Schaye et al. (2000), and interpreted, based on calibrations with numerical simulations, as evidence for a sharp temperature jump and reduction in the effective polytropic index towards isothermality near , due to the onset of He reionization. A similar conclusion was reached by Zaldarriaga (2002) in a wavelet-based analysis of QSO spectra. Global reionization simulations and semi-analytic estimates allowing for distributed sources, however, are not clearly in accord with such sharp changes in the absorption line parameters. The results suggest only a gradual rise in the mean IGM temperature should occur during helium reionization (McQuinn et al., 2009; Bolton et al., 2009). Searches for isolated regions of increased temperature, as may arise around a helium-ionising QSO, have been only partially successful. Zaldarriaga (2002) argues at least ten QSO sitelines are required to probe temperature fluctuations at a statistically significant level. Using a similar method, Theuns et al. (2002) find a region across suggestive of a statistically significant elevated temperature in a single QSO siteline out of eight examined.
A more direct means of searching for the reionization signature is to target the region around specific QSOs. The temperature of the IGM gas surrounding a QSO may be probed both using lines of sight towards the QSO and nearby on the sky towards background QSOs. Surveys of QSO neighbours with follow-up spectroscopy along multiple lines of sight are currently underway in an attempt to measure the transverse hydrogen ionization proximity effect and to use transverse spatial correlations in the hydrogen Ly forest as a constraint on the vacuum energy density of the Universe (Marble et al., 2008). The detection of a thermal proximity effect would provide additional support for unification models of Active Galactic Nuclei (AGN). In these models, the variety of AGN activity observed, from radio galaxies to QSOs and from Seyfert 1s to Seyfert 2s, is a consequence of geometry: an obscuring dusty torus or other obstacle blocks the optical/UV radiation from the central engine along some lines of sight, possibly re-radiating it in the infra-red. The observed character of the object then depends on the viewing angle. While good evidence exists for elements of the model (Verma et al., 2005; Antonucci, 1993), direct evidence for optical/UV radiation transverse to the line-of-sight of a putative obscured QSO or Seyfert 1 is generally lacking. Prior to the completion of helium reionization in the IGM, the broadening of Ly absorption features transverse to the line of sight toward bright radio or infra-red galaxies, Type II QSOs, or Seyfert 2 galaxies would provide evidence for intense photoionising UV radiation beamed transverse to the line of sight, as predicted by the unification models.
The purpose of this paper is to use numerical reionization simulations to quantify the impact of He reionization by a QSO on the temperature and absorption line widths produced in the surrounding gas. The simulations are performed using a radiative transfer code coupled to an -body code to model the evolution of the IGM. The method was previously described in Tittley & Meiksin (2007). The details of the simulation volume and sources are given in §2. Results of the simulations are provided in §3 and discussed in §4. Our conclusions are summarised in §5. In an Appendix, we describe modifications to the radiative tranfer code implemented to simulate reionization by a central source.
2 Simulations
We use PMRT (Tittley & Meiksin, 2007) to simulate the expanding ionization front produced by a central source. The simulation code is the merger of a Lagrangian particle-mesh (PM) code (Meiksin et al., 1999), and a grid-based radiative transfer (RT) code based on a probabilistic photon-conserving algorithm (Abel et al., 1999; Bolton et al., 2004). The method assumes the baryons trace the dark matter. The code is thus not able to cope with sudden increases in the pressure forces as the gas is heated and driven out of shallow potential wells or heated by shocks in collapsing structures (Bond et al., 1988; Meiksin, 1994). Whilst pseudo-hydrodynamical methods are no replacement for full hydrodynamics computation for high-precision comparisons with data, comparisons with full hydrodynamics computations show that the method recovers the distribution of Doppler parameters to high accuracy, although the median Doppler parameter may be slightly broadened by (Meiksin & White, 2001), which is an intrinsic limitation to our estimates. An alternative method including an enthalpy-based pseudo-pressure term similar to the HPM scheme of Gnedin & Hui (1998) was found to broaden the lines even more. For this reason we adhere to the more straightforward implementation of Meiksin & White (2001). In future full hydrodynamics computations including radiative transfer would be preferable, and the authors are developing such a scheme. The pseudo-hydrodynamics scheme none the less does have advantages over a fully hydrodynamical one: it runs much more quickly without the hydrodynamics overhead, and the reduced memory requirements permit simulations in larger boxes at the high spatial resolution required to resolve the absorption systems. The latter is important to ensure the simulations both capture the large scale modes required to converge on the Doppler parameters and to resolve the internal structure of the systems (Theuns et al., 1998; Bryan et al., 1999; Meiksin & White, 2001).
The central QSO is modelled as a starburst that gradually develops into a hard QSO spectrum. The starburst spectrum was produced by PÉGASE333http://www2.iap.fr/users/fioc/PEGASE.html (Fioc & Rocca-Volmerange, 1997) for a galaxy 30 Myr after a burst of Pop III (zero metallicity) star formation. The starburst spectrum has a luminosity at the hydrogen Lyman edge of . It is able to ionize hydrogen and some neutral helium to singly ionized helium, but has negligible flux above the ionization threshold of singly ionized helium. The spectral index of QSO sources at these high energies, particularly above the He Lyman edge which is most relevant for this work, is virtually unconstrained by observations. Using HST QSO spectra covering primarily the redshift range , Telfer et al. (2002) report a steep source spectral index of for a fit over the spectral range Ry, still a factor of two short of the He Lyman edge. By contrast, using FUSE data for QSOs at , Scott et al. (2004) find a spectral index of fit over the similar spectral range Ry. A fair fraction of the QSOs have quite hard spectra with The origin of the discrepancy with the HST sample is unclear. The FUSE sample is somewhat fainter, although there is substantial overlap in the QSO luminosities with the HST sample. A correction for any intervening Lyman limit systems and a statistical correction for intervening intergalactic absorption are applied to the HST spectra, which is unnecessary for the lower redshift FUSE sample, so that the FUSE sample may be a truer reflection of the intrinsic QSO spectra at these energies. Alternatively, it may be that QSOs harden at lower redshift, although Telfer et al. (2002) find no such effect in their data. Even if most QSO spectra tend to be softer at higher redshifts, for a given luminosity at the He Lyman edge QSOs with harder spectra will provide a greater number of ionizing photons, and so they may still dominate the reionisation of helium in the IGM. The QSO spectrum in our simulations is approximated as an power law at energies above the H Lyman edge. Although a hard spectrum is suggested by the FUSE data, our choice is primarily motivated by an attempt to address the discrepancy between the measured H Doppler parameters and the predictions of simulations. Detailed comparisons between simulations and data suggest the simulations substantially underpredict the temperature of the gas (Theuns et al., 1998; Bryan et al., 1999; Meiksin et al., 2001). A harder spectrum will produce a higher temperature. If still inadequate, then additional sources of heating or line-broadening (such as winds) may be required. Ultimately an assessment of the impact of He reionization on the gas temperatures will require improved knowledge of the intrinsic spectra of QSOs, particularly at energies above the He Lyman edge.
The QSO spectrum is normalised to provide a peak hydrogen-ionising photon production rate half that of the starburst, with a peak luminosity at the hydrogen Lyman edge of . Three transitions from starburst spectrum to QSO were simulated: a gradual transition over the redshift intervals to , to and to . The starburst spectrum was turned on at in all cases. In principle, an ionization front representing the accumulated ionising photons from a population of galaxies could have been swept across the simulation volume, however we find that the IGM temperatures have relaxed by the time the QSO spectrum turns on, without any memory of the central source, so that initiating hydrogen ionization by a central source adequately produces the expected temperature structure of the IGM prior to the turn-on redshift of the QSO spectrum. In post-processing the spectra, we have added a uniform hydrogen ionization rate to match recent estimates.
To approximate the expected environment of a QSO, we computed mass overdensities in the simulation after smoothing the PM distribution at over a comoving scale of Mpc, and placed the source at an overdensity peak corresponding to a mass of , consistent with recent estimates of QSO dark matter halo masses based on QSO space density and clustering statistics (Shen et al., 2007; White et al., 2008). In order to gauge the importance of the environment to the resulting properties of the IGM, we also computed a set of models with the source placed at the centre of an underdense region. Qualitative effects found in common may then be expected for any source location. Since galaxies are also found in underdense regions, the simulations may in fact describe a plausible helium reionization scenario, since an appreciable fraction of galaxies may have undergone an AGN phase at some stage in their lives so that helium in some underdense regions may have been reionized by a local source residing within them.
| Environment | 3.5 | 4.5 | 5.5 |
|---|---|---|---|
| High density | HD3.5 | HD4.5 | HD5.5 |
| Low density | LD3.5 | LD4.5 | LD5.5 |
For brevity, the labels listed in Table LABEL:table.identifiers will be used henceforth to identify the various simulations with their combination of source location and source power-law turn-on redshift.
All simulations, unless stated otherwise, were performed in a comoving volume. A CDM model was assumed (Spergel et al., 2003), with parameters: , , and , where , , and have their usual meanings as the contributions to from the gas, all matter, and the vacuum energy, respectively. We adopt a helium fraction by mass of .
The initial density perturbations were created by displacing a uniform grid of particles in the box using the Zel’dovich approximation. The initial power spectrum of the density fields was a COBE-normalised power law with index . The same initial conditions were used for all simulations. Since there is no feedback from the RT to the PM code, all the runs have identical gas densities. The simulations were evolved to a redshift of 2.
The reionization computations were carried out on a superimposed polar grid. Details of the scheme are provided in the Appendix. The finite travel time of light is included in the propagation of the radiation field from the source. Because of the intensive computational demands required for accurate temperature determinations associated with reionization, the regions ionized are restricted to slabs kpc (comoving) thick and Mpc (comoving) in radius. This produces a small amount of periodic overlap in the density field at the edges of the polar grid along its cardinal directions, necessary to maximise the usage of the cubic simulation volume.
3 Simulation results
3.1 Physical properties of the IGM
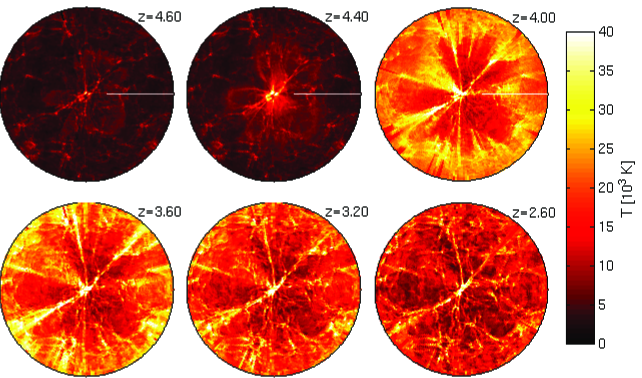
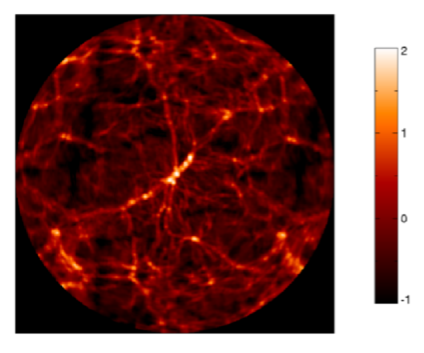
We focus on the thermal state of the gas surrounding the central source before and after the He I-front passes. The evolution of the temperature in a slice through the simulation is shown in Figure 1. The role played by dense structures surrounding the source in restraining the growth of the H and He I-fronts is apparent in the highly anisotropic temperature patterns. For comparison, the density field at is shown in Figure 2. (Since the overdensities change very little over the redshift interval , only the image at is shown.) The gas temperature increases sharply behind the He I-fronts, then relaxes to lower values as the gas achieves equilibrium between photoionization heating and atomic radiative losses. As a consequence, the highest temperatures tend to lie furthest from the source in regions behind the He I-front. Thus, whilst the gas temperature is increased within the He region surrounding the QSO compared with the gas temperature outside, the temperature of the gas within the He region decreases towards the QSO itself. As will be discussed in §4 below, another important contributing factor to the trend is the hardening of the radiation field by the intervening gas between the source and the more distant regions.
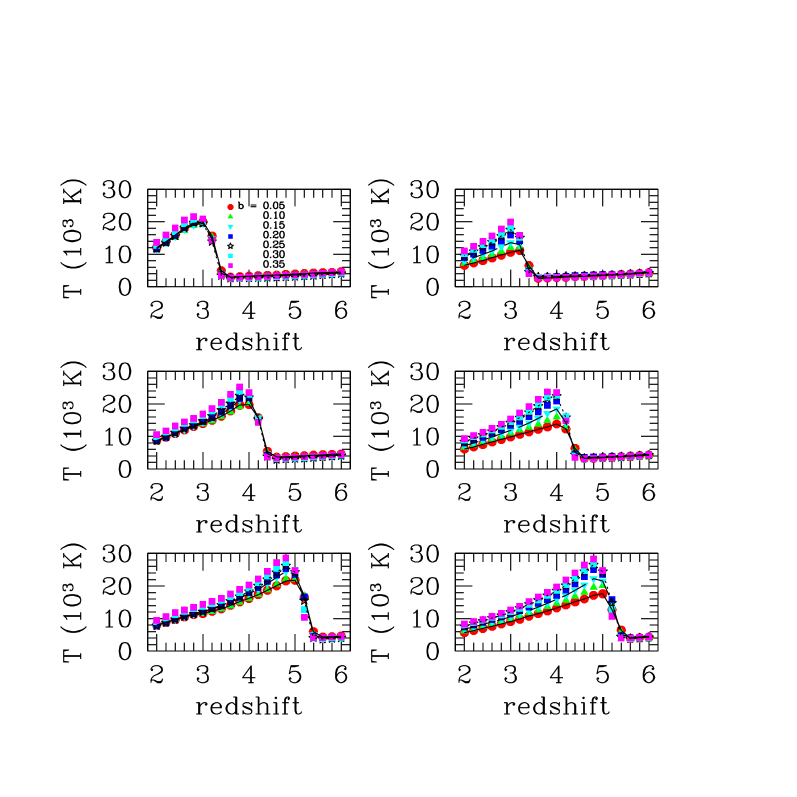
Figure 3 shows azimuthal averages of the median gas temperature along lines of sight drawn around the source with varying impact parameter. Once the power-law source turns on, a steep rise in the temperature with decreasing redshift is found. The rise occurs over a much narrower redshift interval than the transition redshift interval of the source spectrum as the source becomes sufficiently hard to photoionize He . The associated photoionization heating occurs over a redshift interval of approximately , with the temperature peaking at the centre of the transition redshift interval. The median averages show a trend of increasing temperature with increasing impact parameter of the lines of sight after helium is fully ionized. The median temperatures approach convergence with time as photoionization heating comes into equilibrium with atomic radiation losses and adiabatic expansion cooling.
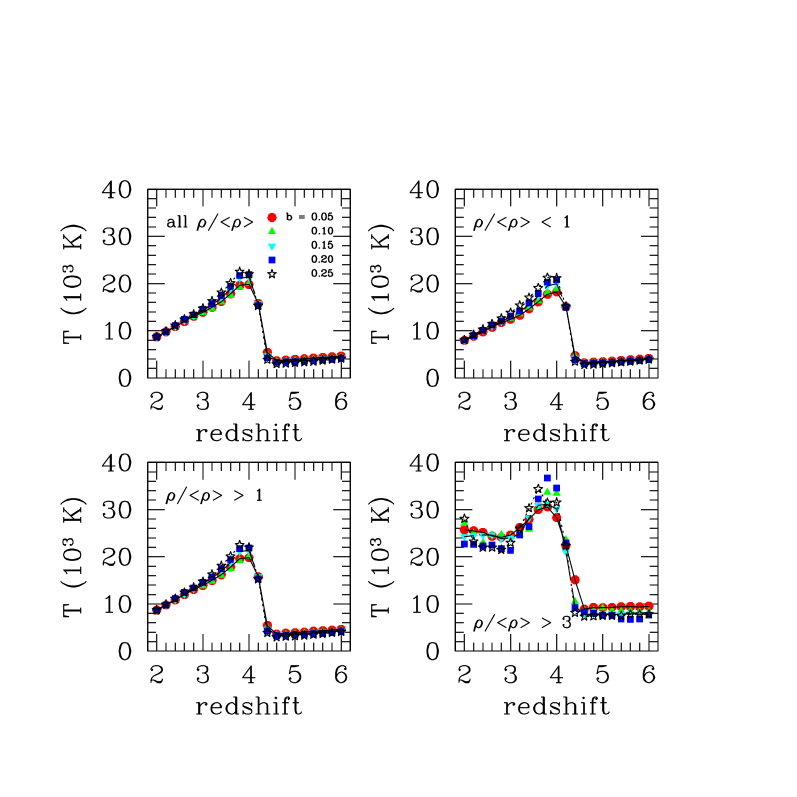
Similar trends are found for both underdense and overdense regions, as shown in Figure 4, with peak temperatures of K after He reionization, diminishing to K by . (Since the projected radii begin to sample the rising density field in the next periodic image of the simulation volume, subsequent plots are truncated to .) At high overdensities, however, the trend is less clear and appears to reverse after helium reionization as a function of impact parameter, as shown by the panel for . This density threshold corresponds to systems with H Ly optical depths of about unity, approximately the minimum for which metal absorption systems have been detected (eg, Aguirre et al. (2008)). For this density cut, after the initial rise the temperature settles to roughly constant values depending weakly on the impact parameter of the line of sight, but now with lower temperatures for the larger impact parameters. The median temperatures are also found to be considerably higher than for most of the gas. The peak median temperature following full helium reionization reaches values of K, decreasing to K as thermal equilibrium between photoionization heating and atomic radiative losses is established.
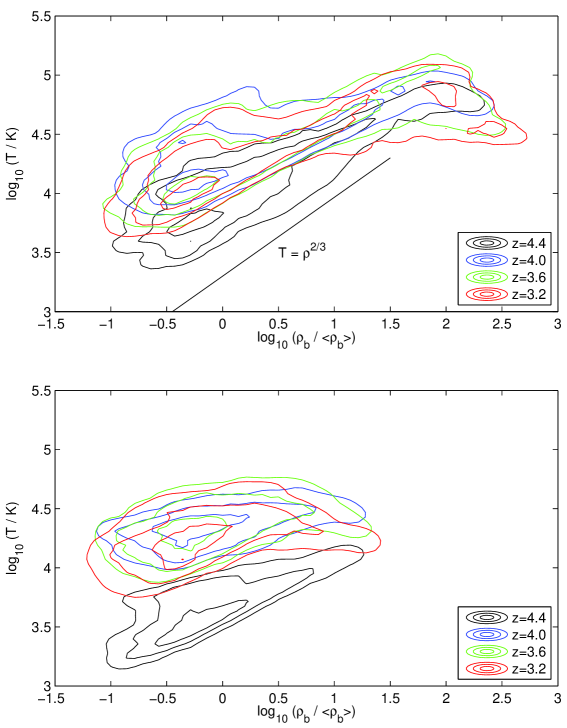
The trend of temperature with impact parameter is thus not a consequence of a narrow equation of state relating the gas temperature to the gas density. The post-ionization gas in fact shows a wide range of temperatures at a given overdensity in reionization computations including radiative transfer (Bolton et al., 2004; Tittley & Meiksin, 2007; Bolton et al., 2009). The dependence between gas temperature and density is shown in Figure 5. The relation has been split into two regions: an inner region within a half radius of the polar grid (top panel), and the complementary outer region (bottom panel). At , just after the power-law source turns on, the temperatures begin to elevate in the inner region as He is photoionized. The gas temperature and density obeys an approximate polytropic relation. This arises in underdense regions from a balance between photoionization heating and adiabatic expansion cooling (Hui & Gnedin, 1997). At densities above (corresponding to for ), however, the gas density is sufficiently high that there is time for thermal balance to be established between photoionization heating and atomic radiative cooling, which results in a trend of decreasing temperature with increasing density (Meiksin, 1994). This turnover is present in the outer region (lower panel). The extension of the polytropic relation to higher overdensities in the inner region reflects the role of adiabatic compression heating within collapsing structures, with and reaching peak temperatures of mainly K, as expected for collapsing structures on scales of 100 kpc (proper) and smaller (Meiksin, 1994). The temperature-density slope is slightly shallower than the adiabatic relation (Figure 5), as radiative cooling limits the temperatures in overdense structures. At virial densities (), for which the gas comes to rest, atomic processes lower the temperature, creating a downward trend in the relationship between temperature and density (upper panel of Figure 5). The highest temperature regions ( K) in Figure 1 align with the densest structures in Figure 2, with the highest temperatures in the dense structure at the centre of the grid.
By , the He I-front has reached the edge of the simulation volume. The temperature-density relation has relaxed to a new polytropic relation in the inner region as adiabatic expansion cooling lowers the temperature of the underdense gas with time (upper panel). The turnover at high densities is consistent with the dominance of atomic processes in establishing the temperature-density relation, as discussed above. By comparison, in the outer region, where the He was more recently photoionized, the temperature-density relation shows a pronounced flattening, gradually settling to a polytropic relation with a slightly steeper gradient with decreasing redshift as adiabatic cooling lowers the temperature of the underdense gas. In both regions, a wide spread in the relationship is found. The high median temperatures ( K), in the inner region at high densities are not reached in the outer regions because of the absence of massive halos comparable to that situated at the centre of the slice.
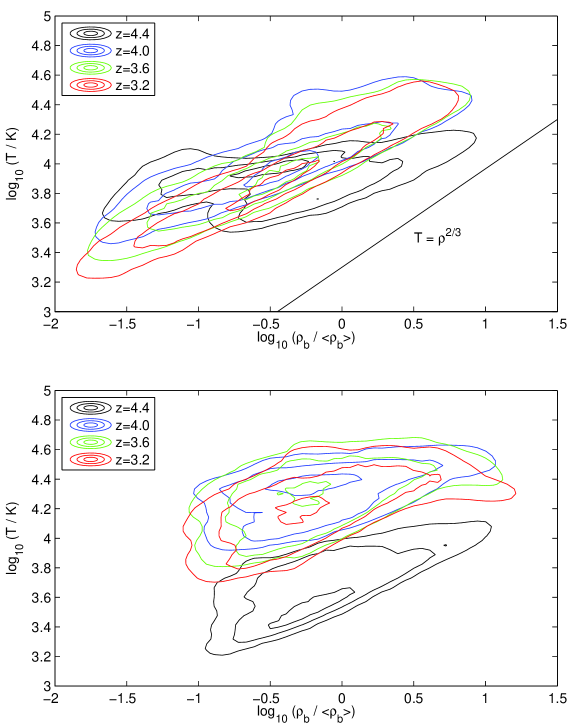
Similar evolution is found for a source turning on in an underdense environment, as shown in Figure 6. In this case, the inner region heats up more quickly after the source turns on, since the He ionization front is able to propagate more quickly. The faster expansion speed in the void surrounding the source results in an increased amount of adiabatic cooling, bringing the gas to lower temperatures in the vicinity of the source (top panel). Since the gas does not reach high overdensities in the inner region, the high temperatures associated with collapsing halos found for the source placed at a density peak do not occur. Further from the source (bottom panel), the temperature evolves similarly to the case with the source placed in a dense environment.
3.2 Absorption line properties of the IGM
Whilst isolated features in the He Ly forest have been detected up to redshifts (Kriss et al., 2001), it becomes increasingly difficult to detect individual He Ly absorption features at , as observations from space are required and the sources tend to be too faint at these wavelengths to readily measure the spectra because of the high He Ly optical depths at these redshifts (Meiksin, 2007). We explore the possibility of detecting the effects of He reionization on the H Ly forest instead. The hydrogen ionization fractions were recomputed allowing for a background metagalactic hydrogen ionization rate in addition to that of the QSO of, in units of per neutral hydrogen atom,
| (1) |
in good agreement with recent estimates (Meiksin & White, 2004; Tytler et al., 2004; Bolton et al., 2005; Faucher-Giguère et al., 2008). Synthetic spectra were generated by casting lines of sight to fictitious background sources azimuthally distributed about the central ionization source. The spectra were computed from the modified H fractions using Eq. 1, and the gas density, temperature and peculiar velocity from the simulations, following the procedure in Meiksin & White (2001). Spectral regions were examined within of the closest point to the QSO along a neigbouring line of sight, a range sufficiently broad to produce a large number of absorption features whilst still within the region of influence of the central QSO. No corrections for the finite travel time of light were made in constructing the spectra except for the time delay between the source at any given position within the grid, which is small. Corrections are important for an ionization front travelling at close to the speed of light, as it will near the source when the source first turns on. In principle, any comparison with observations could correct for the resulting time-delay effects in the observed spectra. The effects, however, are small over the scales presented. By less than the turn-on redshift of the QSO, the He I-front is expanding at less than 0.1c. The QSO ionizes most of the polar grid within of the turn-on redshift, with only highly subluminally expanding patches of He remaining in dense regions or regions obscured from the source by dense intervening lumps of gas. The spectra presented are generally drawn from the simulation either before or after the He I-front passes, except for a brief interval of width during which the I-front is moving sufficiently subluminally that finite speed of light corrections are at the 10 per cent. level or smaller, and so are not included.
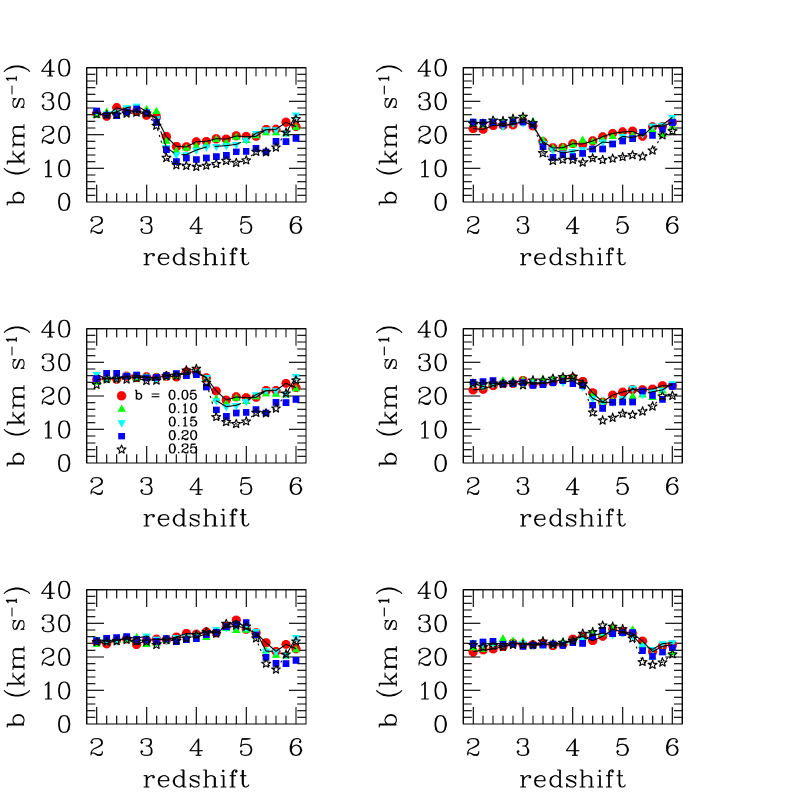


A Voigt-profile absorption line analysis was performed on the spectra using AUTOVP (Davé et al., 1997), modified with additional error controls to render the code more robust. Azimuthal averages of the median values of the resulting Doppler parameters are shown in Figure 7. The Doppler parameters increase as the hard photoionization source turns on, reflecting the behaviour of the median gas temperature in Figure 3, although with a somewhat gentler rise.
There is, however, a remarkable difference in the trend with projected separation of the line of sight. Prior to the onset of the hard photoionization spectrum and the subsequent full reionization of helium, the gas temperature shows little variation with impact parameter from the central source. The small trend indicated in the figure is consistent with the trend with density as a function of offset, as shown in Figure 8. After helium becomes fully ionized, the temperature increases systematically with distance from the source. By contrast, the Doppler parameter shows a strong trend of decreasing value with increasing projected separation from the central source prior to the onset of the hard photoionization spectrum. The trend, along with a gradual decrease with decreasing redshift, is apparent in the high density runs, particularly HD3.5 and HD4.5, as well as in all the low density runs, as shown in Figure 7.
After helium is fully reionized, the trends with impact parameter and redshift gradually disappear. In fact, regardless of the onset of helium reionization in the models, by the median Doppler parameters all take on nearly the same value of about in the high density runs, in good agreement with observations (Meiksin et al., 2001). In the low density runs, a slightly lower median value of about is found.
The near constancy of the median Doppler parameter with both redshift and impact parameter following helium reionization is a surprising result. Since the Doppler parameter increases with gas temperature, trends similar to those found for the temperature may have been expected. The Doppler parameter, however, reflects the underlying peculiar motions of the gas as well as the temperature, although the relation is a complex one. The contribution of peculiar motions to the broadening of the absorption lines is not straightforward to isolate since the motions not only broaden the lines but displace them as well. An attempt to construct spectra without including the peculiar velocity field resulted in qualitatively different absorption structures with relative displacements of line centres and substantially different blending of lines. Since absorption line fitting is a non-linear process, very different absorption lines result with widths that reflect differences in the deblending of the absorption features in addition to the absence of peculiar motions. The total amount of absorption changes as well, making it unclear how to renormalise the spectra for a fair comparison with the correctly computed spectra including the peculiar velocities.
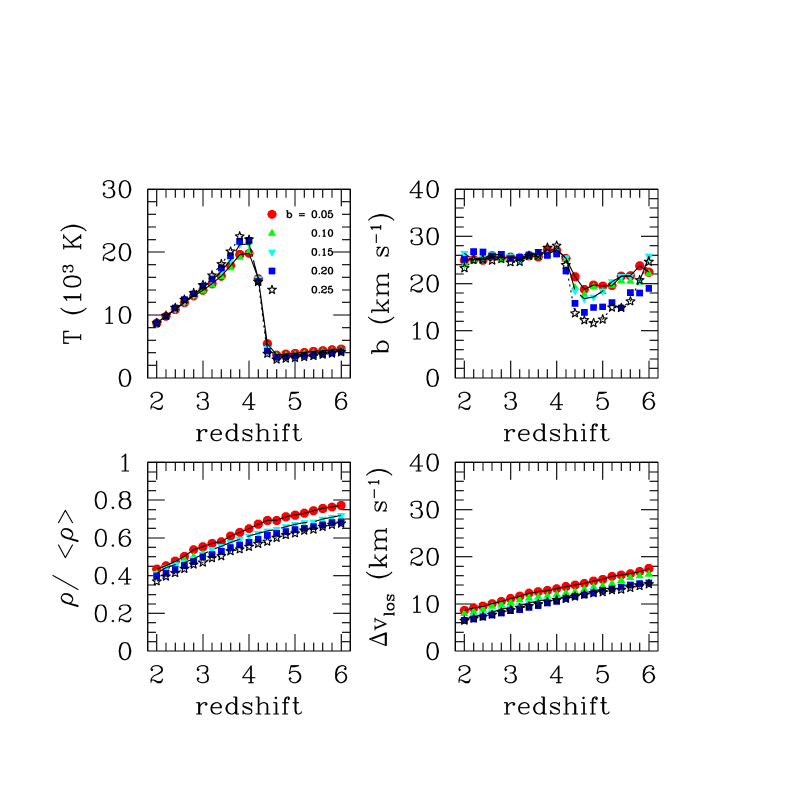
Some insight into the role of peculiar motions in broadening the absorption lines, however, may be made by examining the structure of the peculiar velocity field. The line-of-sight peculiar velocity difference across a 100 kpc (proper) separation, corresponding to the typical thickness of the absorption systems (eg, Zhang et al. (1998)), is found to decrease with decreasing redshift, as well as to decrease the more distant from the source, as shown for case HD4.5 in Figure 8. Prior to helium reionization, when the gas temperatures are relatively low, the Doppler parameters are comparable to the peculiar motion differences and follow the same trend of decreasing value with increasing impact parameter. Once helium is fully ionized, the Doppler parameters become nearly constant both with redshift and with impact parameter. This suggests they are no longer probing the mean evolution in temperature and peculiar motion of the gas, as weighted by volume, but rather the temperature in denser regions which shows little dependence on either redshift or distance from the source, as shown in Figure 4 for regions with . It is these overdense structures which correspond to systems with Ly optical depths near unity and above, which dominate the absorption in the spectra at , in contrast to the lower overdensity structures that dominate the absorption at higher redshifts because of their higher absolute densities (Zhang et al., 1998).
Similar trends are found for a source placed in the centre of an underdense region. Prior to full helium reionization, the Doppler parameter for absorption features along neighbouring lines of sight increases with decreasing impact parameter of the line of sight (Figure 7). This is found to correlate well with an increased difference in the line of sight peculiar velocity over the scale of 100 kpc for smaller impact parameters. At such small impact parameters, nearly the full peculiar expansion velocity of the underdense region will be probed, while at larger impact parameters the contribution of the expansion velocity to the line broadening will be reduced by the decrease in the projection along the line of sight. After reionization, the Doppler parameters are again nearly independent of redshift and impact parameter, suggesting again that they are probing overdense structures for which the gas temperature has little dependence on redshift or distance from the source.
The evolution in the H column density and Doppler parameter joint distribution is shown in Figure 9 for model HD4.5 over the redshift range . The onset of He reionization has two effects. It increases the median Doppler parameter, while narrowing the width of the H column density distribution as the recombination rate is reduced due to the increase in the gas temperature. This enhances the reduction in the number density of high column density systems along a line of sight due to the decrease in the absolute density of the gas as a result of cosmological expansion (Zhang et al., 1998). A clear envelope of minimum Doppler parameters, increasing with , is produced both before and after full helium reionization. For systems with , the envelope is found to rise from to following He reionization, consistent with the increase in gas temperatures.
4 Discussion
Much of the temperature structure of the IGM after helium reionization may be accounted for by the hardening of the radiation field as filtered through the IGM during He reionization. Approximating the spectrum of the radiation field locally as a power law , where is the angle-averaged intensity at the He photoelectric threshold frequency , the ionization and heating rates per He ion are, respectively,
| (2) | |||||
and
| (3) | |||||
where the photoelectric cross-section for ionising He is approximated as , and is the Planck constant. This then gives for the expected energy injected into the gas per ionization
| (4) |
Deviations from this will occur due to spectral structure within the ionization front, especially as the mean free path of high energy photons is long compared with that of photons just above the photoelectric threshold, resulting in a hardening of the spectrum through the I-front. The relation serves to provide an approximate estimate for the expected amount of energy injection and the sensitivity to the hardness of the effective spectral index within the ionization front, which may even achieve negative values () in regions for which more high energy photons are able to penetrate than low.
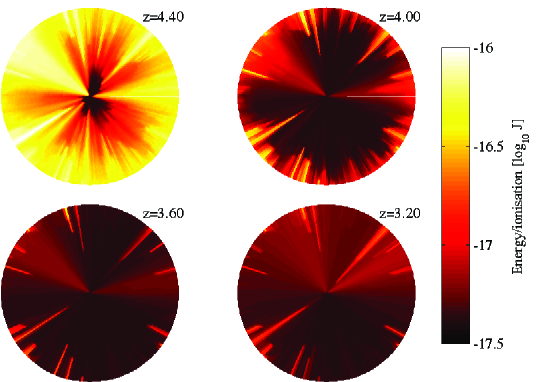
The evolution of the energy per ionization is shown in Figure 10. At early times after the source just turns on (the panels for and ), heating rates per ionization more than an order of magnitude greater than Eq. (4) for (the source spectral index) are found. The helium in these regions is still largely in the form of He , with the He region just beginning to emerge from the source at , and not quite reaching the edge of the polar grid by , as shown in Figure 11.
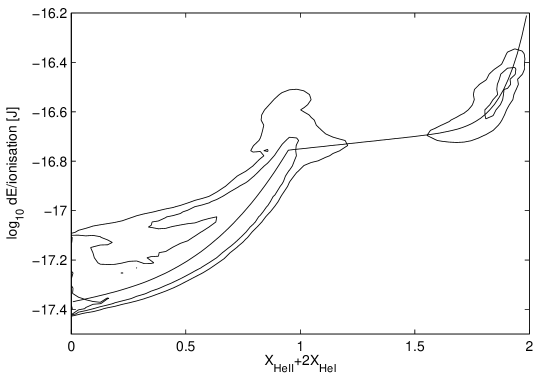
Whilst the He ionization fraction evolves rapidly within the ionization front, it is found that the heating rate per ionization is nearly constant for a given value of . This is illustrated in Figure 12. The energy per ionization is well-described by
| (5) | |||||
where . The right region corresponds to gas that is ionising from He to He , whilst the left region shows the level of He as the helium becomes fully ionized. The bridge between the regions indicates the rapid depletion of He as it is converted into He . As the He is ionized into He , the energy per ionization rapidly declines as the effective ionising spectrum softens towards the intrinsic spectral shape of the source.
The expected boost in the gas temperature, allowing for the injected energy to be shared by all the species present, is
| (6) | |||||
where is the Boltzmann constant. Comparison with Figure 10 shows that the rises in the median temperature in Figure 3 following full helium ionization are of the magnitudes expected, although the actual local increase may be much larger, depending on the evolution of the He ionization fraction within the ionization front. The gas will also rapidly cool in dense regions due to radiative losses, and in underdense regions due to adiabatic expansion cooling. By , the highest heating rates are confined to the periphery of the polar grid (Figure 10), where pockets of continue to survive in shadows cast by overdense clumps blocking the source, as shown by a comparison between Figures 11 and 2. In the inner regions, where the helium is fully ionized, the gas is able to cool through radiative losses and the temperature lowers, leaving the peripheral regions at relatively higher temperatures. This is the origin of the trend of increasing temperature with impact parameter shown in Figure 3. High heating rates are found to persist down to even after most of the helium is fully ionized, and indeed increase by as dense clumps continue to gather near the centrally placed source further filtering the radiation field, demonstrating that radiative transfer effects may continue to affect the temperature of the gas in distant regions even well after helium reionization has completed.
5 Conclusions
Using a coupled radiative-transfer and Particle-Mesh -body code, we study the effects of helium reionization by a QSO source on the surrounding IGM. We consider QSO source turn-on redshifts ranging from to , with the QSO spectrum modelled as a power law. In the overdense environment expected for a QSO, the crossing of the He ionization front boosts the temperature behind the front to median values of K, gradually relaxing to K by as thermal equilibrium between photoionization heating and atomic radiative cooling processes and adiabatic expansion cooling is established. The peak temperature tends to be higher for earlier turn-on redshifts. A “thermal proximity effect” results with a heightened IGM temperature within the He region produced. An identical source placed in an underdense environment shows similar behaviour.
The median gas temperature surrounding the QSO, however, is not uniform; it shows an increasing trend towards the He ionization front, where spectral filtering by the intervening gas still hardens the radiation field from the source in patches and where helium was most recently ionized. We generate synthetic spectra to assess the possibility of detecting the trend in the absorption lines along the lines of sight to background neighbouring QSOs. The spectral signature of the post-helium ionization temperature trends nearly vanishes in the H Doppler parameters, which show both little evolution and little dependence on distance from the source. For a source placed in an overdense region, a median Doppler parameter of at is found, independent of impact parameter and the time of He reionization. A somewhat lower median Doppler parameter of is found for a source placed in the centre of a void. The median values are in good agreement with the measured median Doppler parameter. This is in contrast to simulations without radiative transfer, for which the value is underpredicted by a few to several (Meiksin et al., 2001). Late He reionization appears to account for the higher values. The absence of a dependence of the median Doppler parameter on redshift and impact parameter may be attributed to the absence of any temperature trend with redshift and impact parameter of the denser regions which dominate the Ly absorption spectra. By contrast, a trend is found prior to full helium reionization, with an increase in the Doppler parameters for a smaller impact parameter of the line of sight, reflecting similar behaviour in the peculiar velocity field. Thus the disappearance of a trend with impact parameter may indicate the onset of full helium reionization.
A near polytropic relation is obtained between the gas temperature and density with a slope that is close to adiabatic, extending to overdensities of in the vicinity of the source placed in a massive halo. The temperatures found, approaching K, are those expected for accretion onto halos and sheets, with radiative cooling lowering the temperature at higher overdensities. In regions without a massive halo, the turnover in the temperature occurs at overdensities of only a few, again as expected from radiative cooling losses. No inverted temperature–density relation is found in the underdense gas. Whilst the temperature–density relation flattens soon after He reionization, the temperature in the underdense gas follows a general trend of increasing with density, although with a wide spread in values.
The detection of metal absorption systems would allow a more direct probe of the gas temperature. Because the peculiar velocity contribution to the velocity width of an absorption line would be identical for features arising from different elements, while the thermal contribution (in quadrature) decreases like the mass of the ion, it is possible to separate these two contributions provided absorption features due to two or more elements from the same structure are detected. Such temperatures have been measured for a few systems, although the corresponding H column densities tend to be high, typically exceeding , corresponding to overdensities of a few to several (eg, Meiksin (2007)). The temperature trend as a function of impact parameter is less clearly defined for such overdensities, with a weak trend of higher values for smaller impact parameters. None the less, a spread with impact parameter could indicate the onset of full helium reionization, particularly if very high temperatures exceeding K are found at .
It would be very interesting to use metal absorption features arising in the very diffuse IGM, corresponding to H column densities of and lower, to probe the temperature structure of the IGM, both before and after full helium reionization. There are currently no detections of individual metal absorption features in such low density diffuse systems, but neither do observations preclude them. Exploiting them for temperature measurements, however, may need to await spectroscopy on a much larger future generation of telescopes such as the Thirty Meter Telescope or an Extremely Large Telescope.
Acknowledgements
The computations reported here were performed using the SUPA Astrophysical HPC facility and a facility funded by an STFC Rolling-Grant. E.T. is supported by an STFC Rolling-Grant. C.B. was supported by a grant from the Robert Cormack Bequest.
Appendix A Radiative transfer on a polar grid
The equation of radiative transfer is solved along radii emanating from the source using a photon-conserving probablistic method (Abel et al., 1999; Bolton et al., 2004; Tittley & Meiksin, 2007). The radiative transfer was performed on a polar grid with the start of each line of sight placed at the source. The polar grid is divided into sectors bounded by intervals in radius and angle. Since the optical depth must be computed from the source to each polar cell, a density field must be defined on the polar grid in order to compute the column densities along the radii from the source. We considered three methods to generate a smooth density field matching that of the Cartesian grid. We describe the final method adopted first, but briefly describe two alternative methods as well that were found inadequate for information only should any of these methods be attempted.
In the method used, the PM mass distribution is apportioned to the cells in the polar grid by dividing each particle into 500 sub-particles, spread over a comoving radius of Mpc, and assigning the contributions to the polar grid cells in which each sub-particle lies. The sub-particle density distribution is cone-shaped, declining like in 2D, so that the number per ring of fixed width is constant. (The corresponding distribution in 3D would decline like for an equal number per shell.) The mass density on the polar grid is then computed as the total mass in each cell divided by the cell volume, which increases with radius. The method was found to produce a smooth rendition of the density field without discontinuities and in good agreement with the original density field measured on a Cartesian grid.
We considered two other methods that, though seemingly straightforward, produced undesirable artefacts. In the first, the density field defined on the Cartesian grid was re-mapped onto the polar grid by computing the total mass contributed by the Cartesian grid cells that overlapped a given polar cell. Because of the irregular shapes of the overlap regions, it was found impractical to compute the regions of overlap directly. We instead computed the overlap regions using Monte Carlo integration by populating the Cartesian grid uniformly with a large number of randomly distributed points in order to compute the fraction of overlap with individual polar cells. Each Cartesian grid cell was then assigned a weight for each polar cell according to the amount of overlap. Once computed, the weights were stored, as they need not be computed again for a given source placement. The method, however, was found to produce discontinuities in the density field if the source is placed near a Cartesian cell boundary. The resulting density field on the polar grid was also found to be excessively smoothed compared with the density field defined on a Cartesian grid. A second approach was to compute the density field directly on the polar grid using the N-body particles. A nearest grid point method based on counting the particles in individual polar cells fails, particularly near the centre of the grid, because the cells are so small that large Poisson fluctuations in the density field are produced, including empty cells with zero density. Enlargening the cells near the centre results in poor resolution and over-smoothing.
References
- Abel et al. (1999) Abel T., Norman M. L., Madau P., 1999, ApJ, 523, 66
- Aguirre et al. (2008) Aguirre A., Dow-Hygelund C., Schaye J., Theuns T., 2008, ApJ, 689, 851
- Antonucci (1993) Antonucci R., 1993, ARA&A, 31, 473
- Becker & et al (2001) Becker R. H., et al 2001, AJ, 122, 2850
- Bolton et al. (2004) Bolton J., Meiksin A., White M., 2004, MNRAS, 348, L43
- Bolton et al. (2005) Bolton J. S., Haehnelt M. G., Viel M., Springel V., 2005, MNRAS, 357, 1178
- Bolton et al. (2009) Bolton J. S., Oh S. P., Furlanetto S. R., 2009, MNRAS, 395, 736
- Bond et al. (1988) Bond J. R., Szalay A. S., Silk J., 1988, ApJ, 324, 627
- Bryan et al. (1999) Bryan G. L., Machacek M., Anninos P., Norman M. L., 1999, ApJ, 517, 13
- Choudhury & Ferrara (2006) Choudhury T. R., Ferrara A., 2006, MNRAS, 371, L55
- Cowie et al. (2009) Cowie L. L., Barger A. J., Trouille L., 2009, ApJ, 692, 1476
- Davé et al. (1997) Davé R., Hernquist L., Weinberg D. H., Katz N., 1997, ApJ, 477, 21
- Dunkley et al. (2009) Dunkley J., Komatsu E., Nolta M. R., Spergel D. N., Larson D., Hinshaw G., Page L., Bennett C. L., Gold B., Jarosik N., Weiland J. L., Halpern M., Hill R. S., Kogut A., Limon M., Meyer S. S., Tucker G. S., Wollack E., Wright E. L., 2009, ApJS, 180, 306
- Fan et al. (2002) Fan X., Narayanan V. K., Strauss M. A., White R. L., Becker R. H., Pentericci L., Rix H.-W., 2002, AJ, 123, 1247
- Faucher-Giguère et al. (2008) Faucher-Giguère C.-A., Lidz A., Hernquist L., Zaldarriaga M., 2008, ApJ, 688, 85
- Fechner et al. (2006) Fechner C., Reimers D., Kriss G. A., Baade R., Blair W. P., Giroux M. L., Green R. F., Moos H. W., Morton D. C., Scott J. E., Shull J. M., Simcoe R., Songaila A., Zheng W., 2006, A&Ap, 455, 91
- Fioc & Rocca-Volmerange (1997) Fioc M., Rocca-Volmerange B., 1997, A&Ap, 326, 950
- Gnedin & Hui (1998) Gnedin N. Y., Hui L., 1998, MNRAS, 296, 44
- Hui & Gnedin (1997) Hui L., Gnedin N. Y., 1997, MNRAS, 292, 27
- Kriss et al. (2001) Kriss G. A., Shull J. M., Oegerle W., Zheng W., Davidsen A. F., Songaila A., Tumlinson J., Cowie L. L., Deharveng J.-M., Friedman S. D., Giroux M. L., Green R. F., Hutchings J. B., Jenkins E. B., Kruk J. W., Moos H. W., Morton D. C., Sembach K. R., Tripp T. M., 2001, Science, 293, 1112
- Madau et al. (1999) Madau P., Haardt F., Rees M. J., 1999, ApJ, 514, 648
- Madau & Meiksin (1994) Madau P., Meiksin A., 1994, ApJ, 433, L53
- Madau et al. (2004) Madau P., Rees M. J., Volonteri M., Haardt F., Oh S. P., 2004, ApJ, 604, 484
- Marble et al. (2008) Marble A. R., Eriksen K. A., Impey C. D., Bai L., Miller L., 2008, ApJS, 175, 29
- McQuinn et al. (2009) McQuinn M., Lidz A., Zaldarriaga M., Hernquist L., Hopkins P. F., Dutta S., Faucher-Giguère C.-A., 2009, ApJ, 694, 842
- Meiksin (1994) Meiksin A., 1994, ApJ, 431, 109
- Meiksin (2005) Meiksin A., 2005, MNRAS, 356, 596
- Meiksin et al. (2001) Meiksin A., Bryan G., Machacek M., 2001, MNRAS, 327, 296
- Meiksin & White (2001) Meiksin A., White M., 2001, MNRAS, 324, 141
- Meiksin & White (2004) Meiksin A., White M., 2004, MNRAS, 350, 1107
- Meiksin et al. (1999) Meiksin A., White M., Peacock J. A., 1999, MNRAS, 304, 851
- Meiksin (2007) Meiksin A. A., 2007, ArXiv e-prints, 0711.3358
- Rauch et al. (1996) Rauch M., Sargent W. L. W., Womble D. S., Barlow T. A., 1996, ApJ, 467, L5+
- Reimers et al. (2005) Reimers D., Fechner C., Hagen H.-J., Jakobsen P., Tytler D., Kirkman D., 2005, A&Ap, 442, 63
- Ricotti et al. (2000) Ricotti M., Gnedin N. Y., Shull J. M., 2000, ApJ, 534, 41
- Schaye et al. (2000) Schaye J., Theuns T., Rauch M., Efstathiou G., Sargent W. L. W., 2000, MNRAS, 318, 817
- Scott et al. (2004) Scott J. E., Kriss G. A., Brotherton M., Green R. F., Hutchings J., Shull J. M., Zheng W., 2004, ApJ, 615, 135
- Shen et al. (2007) Shen Y., Strauss M. A., Oguri M., Hennawi J. F., Fan X., Richards G. T., Hall P. B., Gunn J. E., Schneider D. P., Szalay A. S., Thakar A. R., Vanden Berk D. E., Anderson S. F., Bahcall N. A., Connolly A. J., Knapp G. R., 2007, AJ, 133, 2222
- Spergel et al. (2003) Spergel D. N., Verde L., Peiris H. V., Komatsu E., Nolta M. R., Bennett C. L., Halpern M., Hinshaw G., Jarosik N., Kogut A., Limon M., Meyer S. S., Page L., Tucker G. S., Weiland J. L., Wollack E., Wright E. L., 2003, ApJS, 148, 175
- Telfer et al. (2002) Telfer R. C., Zheng W., Kriss G. A., Davidsen A. F., 2002, ApJ, 565, 773
- Theuns et al. (1998) Theuns T., Leonard A., Efstathiou G., Pearce F. R., Thomas P. A., 1998, MNRAS, 301, 478
- Theuns et al. (2002) Theuns T., Zaroubi S., Kim T.-S., Tzanavaris P., Carswell R. F., 2002, MNRAS, 332, 367
- Tittley & Meiksin (2007) Tittley E. R., Meiksin A., 2007, MNRAS, 380, 1369
- Tytler et al. (2004) Tytler D., Kirkman D., O’Meara J. M., Suzuki N., Orin A., Lubin D., Paschos P., Jena T., Lin W.-C., Norman M. L., Meiksin A., 2004, ApJ, 617, 1
- Verma et al. (2005) Verma A., Charmandaris V., Klaas U., Lutz D., Haas M., 2005, Space Science Reviews, 119, 355
- White et al. (2008) White M., Martini P., Cohn J. D., 2008, MNRAS, 390, 1179
- Zaldarriaga (2002) Zaldarriaga M., 2002, ApJ, 564, 153
- Zhang et al. (1998) Zhang Y., Meiksin A., Anninos P., Norman M. L., 1998, ApJ, 495, 63
- Zheng et al. (2004) Zheng W., Kriss G. A., Deharveng J.-M., Dixon W. V., Kruk J. W., Shull J. M., Giroux M. L., Morton D. C., Williger G. M., Friedman S. D., Moos H. W., 2004, ApJ, 605, 631
- Zheng et al. (2008) Zheng W., Meiksin A., Pifko K., Anderson S. F., Hogan C. J., Tittley E., Kriss G. A., Chiu K., Schneider D. P., York D. G., Weinberg D. H., 2008, ApJ, 686, 195