2010 Vol. X No. XX, 000–000
22institutetext: Graduate University of the Chinese Academy of Sciences \vs\no
Received 2010 Mar. 23; accepted 2010 Apr. 28
Radiation-driven Implosion in the Cepheus B Molecular Cloud
Abstract
We analyze large scale mapping observations of the molecular lines in the 12CO (=2-1) , 12CO (=3-2) , 13CO (=2-1) , and 13CO (=3-2) transition emissions toward the Cepheus B molecular cloud with the KOSMA 3m-telescope. The integrated intensity map of the 12CO (=2-1) transition has shown a structure with a compact core and a compact ridge extended in the north-west of the core. The cloud is surrounded by an optically bright rim, where the radiation-driven implosion (RDI) may greatly change the gas properties. The intensities of the CO (=3-2) transition are higher than those of the CO (=2-1) transition along the rim area. We find characteristic RDI structure in position-velocity diagrams. Non-LTE Large velocity gradient (LVG) model analysis shows that the density and temperature at the edge are higher than that in the center. Our results provide evidences that RDI is taking place in Cepheus B molecular cloud.
keywords:
ISM: clouds — star: formation — individual: G110.209+2.6301 Introduction
The association Cepheus OB3 is one of the youngest groups of early type stars associated with the HII region S155 (Sharpless, 1959) at a distance of 0.7 kpc (Blaauw, 1964). The observations in the 12CO (=1-0) line have shown a few bright components named Cepheus A, B, C, D, E, F (Sargent 1977, 1979). Of the six components, the hottest CO feature and abundant dust emission were detected in the Cepheus B, which was surrounded by an arc-like optical HII region S155. The molecular cloud/HII region complex with such a morphology is called bright rimmed cloud (BRC), where star formation activity can be triggered by the radiation-driven implosion (RDI) mechanism.
The radio continuum observations (Felli et al., 1978) by Westerbork Synthesis Radio Telescope (WSRT) confirmed that the UV radiation from a bright O7 star created an arc-shaped ionization front which surrounded the Cepheus B molecular cloud. The observations of the H2CO and recombination lines (Panagia et al., 1981) have suggested that the ionized material was flowing away at about 11 , and the ionization front was moving into the molecular cloud at a velocity of about 2 . 12CO (=3-2) and 13CO (=2-1) observations together with the far-infrared analysis showed that the cloud was externally heated and the edge of the cloud was compressed by the expansion of S155 (Minchin et al., 1992).
Beuther et al. (2000) observed the Cepheus B area at a large scale in the =3-2 and 2-1 transitions of 12CO, 13CO and C18O with the KOSMA 3m-telescope. Based on the volume densities derived from PDR model, they found that Cepheus B was highly clumped and the volume of these clumps fills only 2-4% of the whole cloud. Mookerjea et al. (2006) confirmed this with further observations of [C I] 3P2 - 3P1 and 12CO (=4-3) . Based on the studies of protoplanetary disks, Getman (et al.) found a spatial-temporal gradient of young stars from the molecular core toward HD217086, which identified HD217086 as the primary ionizing source of the cloud.
Although a lot of efforts have been made to characterize the physical conditions of the Cepheus B, the mechanism of the star formation in this region is still not quite clear. We present analysis of a larger scale observation of multiple CO lines, and discuss the RDI as the possible trigger of the star formation in this region.
2 Observations
The observations were carried out with the 3m KOSMA sub-millimeter telescope using the On-The-Fly mode in March, 2004. Mapping observations of CO were made at 12CO (=2-1) (230.538 GHz), 12CO (=3-2) (345.789 GHz), 13CO (=2-1) (220.399 GHz), and 13CO (=3-2) (330.588 GHz) transitions. The dual-channel 230/345 GHz SIS receivers (Graf et al. 1998) were used to simultaneously observe the two transitions of the isotopes. The system temperatures were about 160 K for transitions and 300K for transitions. The pointing accuracy was better than 15′′ and the angular resolutions (FWHM of beam) were 130′′ at 220 GHz and 80′′ at 330 GHz. The efficiency of the telescope Feff was 93%, and the main beam efficiencies of Beff were 68% at 230GHz and 72% at 345GHz. Line intensities were converted on the main beam scale, using (Downes , 1989).
For the 12CO (=2-1) and 12CO (=3-2) transition emissions, a 1515 map were observed centering at RA=\hms225520.708, DEC=\dms622000.02 (B1950), while for 13CO (=2-1) and 13CO (=3-2) , a 1211-point map were made centering at RA=\hms225524.000, DEC=\dms622041.01 (B1950). The grid spacing was 1′. Each point of the grid was observed 5-6 times with a total integration time of 2 minutes and the spectra were averaged in order to increase the signal to noise ratio. The observed data were reduced and plotted with CLASS and GREG of Gildas package (Guilloteau & Lucas, 2000). The CO (=3-2) transitions were smoothed to a resolution of 130′′ of CO (=2-1) transitions.
3 Results
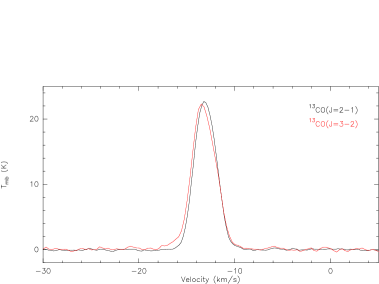
The spectra of 12CO (=2-1) , 12CO (=3-2) , 13CO (=2-1) , and 13CO (=3-2) at the center positions of the observations are shown in Figure 1. The observed spectra show close to Gaussian line shapes. From the 4 lines, the average vLSR is .
We have made integration intensity maps of the 12CO (=2-1) line integrated from -18 to -8 superimposed on the optical POSS2 red plate as shown in Figure 2. O7 star HD217086 and B1 star HD217061 of Cepheus OB3 association are marked, and the former is thought to be the primary ionizing source of the cloud (Getman , et al.). The map has shown a compact core and a compact ridge with a cometary shaped tail extended in south-east direction. There is a steep drop-off in CO emission at northern and western side of the cloud, forming a well-defined boundary edge. Meanwhile an optically bright rim is shown in north-west direction as seen in the POSS2 red plate in gray scale. The compact ridge of the CO integrated intensity contours is surrounded by the bright rim. The average radial velocity of the Cepheus OB3 association is (Garmany , 1973, derived from optial spectra), while in the north-western part the vLSR of our CO observation is also about -15 to -14 (see Figure 3). The agreement between optical and CO velocities confirms that the bright rim and the molecular cloud are physically associated. The morphology of the cloud and the HII region matches well with the scenario of bright-rimmed clouds, which is possibly shaped by the radiation-driven implosion of the ionizing source (Bertoldi, 1989).
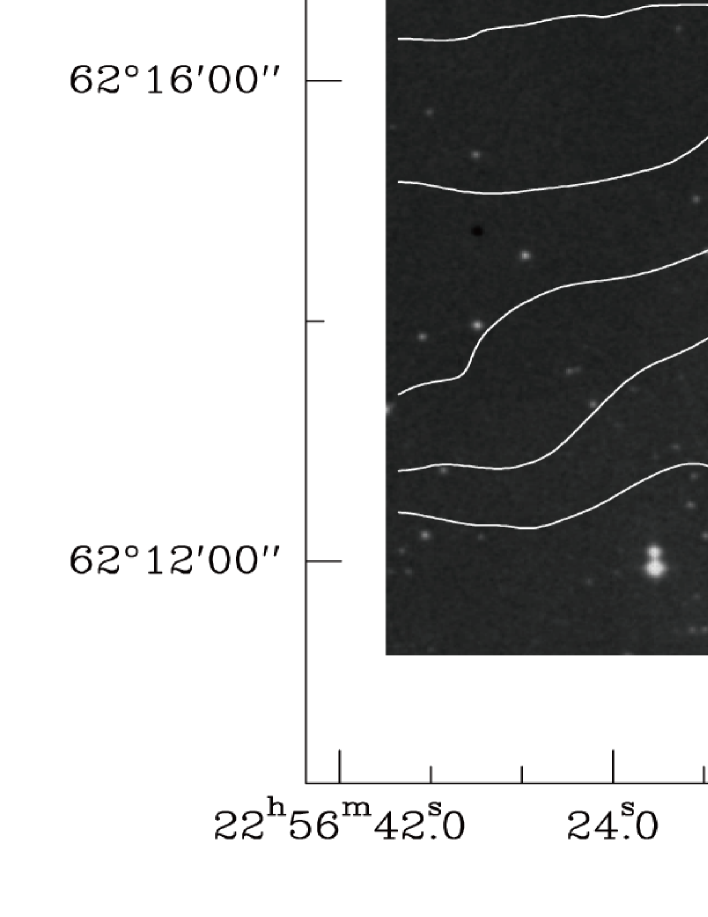
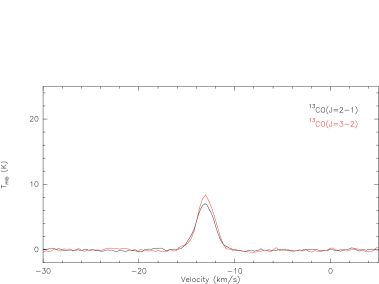
In order to investigate the kinetic and physical conditions in this region, we take position A (offset 1, -1) at the center of the cloud and position B (offset -2, 1) at the edge, as marked in Figure 2. The line properties are compared in Table 1. At position B, the 12CO (=3-2) transition intensity is higher than that of 12CO (=2-1) , while at position A, the 12CO (=2-1) transition intensity is higher than that of 12CO (=3-2) . The reversed line ratio suggests higher density or higher temperature at position B. Further, we plot spectra of the 12CO (=3-2) (red) over 12CO (=2-1) (black) of all grid points in Figure 3. We can see that the A and B positions are not alone in this aspect. The 12CO (=3-2) intensity is higher than 12CO (=2-1) intensity across the bright rim area for most grid positions, indicating the UV radiation is interacting with the molecular cloud and pumping molecular to higher excitation levels.
| Line | vLSR() | FWHM() | Tmb(K) |
|---|---|---|---|
| 12CO (=2-1) (A) | -12.6 (0.1) | 2.8 (0.1) | 24.2 (0.3) |
| 12CO (=3-2) (A) | -12.9 (0.1) | 3.0 (0.1) | 21.9 (0.4) |
| 12CO (=2-1) (B) | -13.7 (0.1) | 2.4 (0.1) | 14.8 (0.8) |
| 12CO (=3-2) (B) | -13.6 (0.1) | 2.6 (0.1) | 19.7 (1.0) |
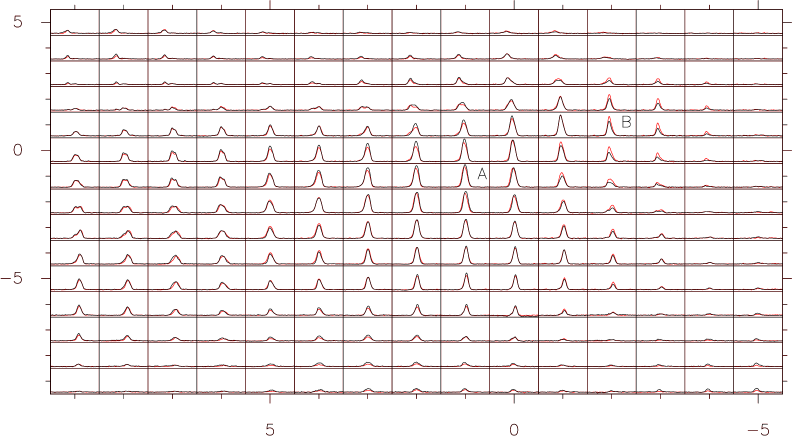
From Figure 3 we also find a spatial shift of vLSR from the head (north-west) to the tail (south-east) of the cloud, which is clearly shown in position-velocity (PV) diagrams along the diagonal direction from north-west to south-east in Figure 4.


4 Discussion
As seen in Figure 2, the observed molecular cloud is surrounded by an ionized bright rim facing the exciting source with a hot core close to the rim and a cometary shaped tail on the side opposite to the rim. This scenario matches well with BRCs which is modeled as externally illuminated, photo-evaporated and ablated into elongated head-tail morphologies by UV radiation of OB stars (Reipurth, 1983). The isolation and simple morphology of BRCs make them ideal environments to investigate the RDI (Bertoldi, 1989) mode of star formation, where pressure from the ionization shock front at the surface propagates through a cloud and overcomes the magnetic, turbulent and thermal pressure trigger cloud collapse, thereby triggering local star formation.
In our case, the spatial shift of vLSR shows strong connections with the RDI mechanism. The PV diagrams in Figure 4 shows a velocity gradient from the head (north-west) of the cloud to the tail (south-east). The blueward elongation toward the head by about 3 from the center indicates that the head part is expanding towards us, while the redward elongation toward the tail by about 4 indicates the tail part is flowing away to the opposite direction. The velocity gradients of the head and tail matches with the RDI model prediction of Lefloch & Lazareff (1994), where the red-shift of the tail is caused by the acceleration of the gas across the tail, and the blue-shift of the head is because the compressed gas in the head moves faster than the gas immediately behind it. Such PV diagrams are reported by various BRC and cometary globule studies (Lefloch & Lazareff, 1995; Sugitani, 1997; White et al., 1997; Bachiller et al., 2002) which are explained by the RDI mechanism, and so are taken as a characteristic structure of the RDI.
The reversed line ratios across the bright rim are another interesting feature. The spatial distribution of the reversed line ratios suggest that they are physically connected with the RDI along the rim area. Higher transitions are more readily excited by higher temperatures or higher densities (Petitpas, 1998), either of which can be a result of RDI. The highly luminous ionizing shock front from the RDI interacts with the molecular cloud, pumping more particles from a lower level to a higher one, which makes the =3-2 emission stronger along the rim area.
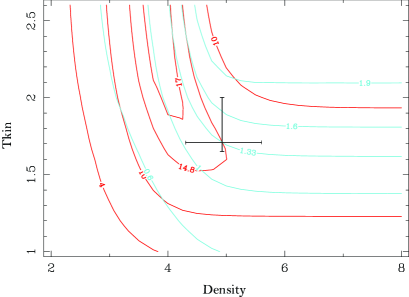
In order to investigate RDI effects and its physical characteristics quantitatively, we made further analysis with a large velocity gradient (LVG, Goldreich et al., 1974; Qin et al., 2008a) radiative transfer model in the MIRIAD software package. In this model, the molecular cloud is considered spherically uniform and the non-LTE excitation properties are calculated based on the kinetic temperature (Tkin), the column density per unit velocity interval (NCO/V), and the H2 density (n). In this case, we use the line intensity of 12CO (=2-1) and the line ratio of 12CO (=3-2) /12CO (=2-1) to determine the volume density n and kinetic temperature Tkin at the two selected positions A and B, assuming the column density in a range of to , and V=1 . Representative solutions that can be fitted to the observations are listed in Table 2. A typical case is shown in Figure 5.
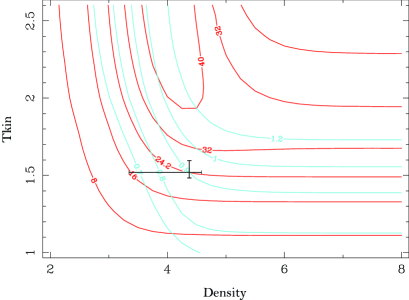
| Position | NCO (1016 cm-2) | n(H2) (104 cm-3) | Tkin (K) |
|---|---|---|---|
| A | 3.2 | 1.6 | 40 |
| 6.8 | 3.2 | 31 | |
| 10 | 4.0 | 31 | |
| 22 | 2.0 | 30 | |
| 46 | 1.0 | 30 | |
| 68 | 0.63 | 30 | |
| 100 | 0.20 | 32 | |
| B | 1.1 | 4.0 | 71 |
| 1.2 | 8.9 | 50 | |
| 1.3 | 50 | 45 |
For position A, various column densities are possible to explain the observation results self-consistently covering a range from to , with corresponding volume densities ranging from to . The average value of the possible volume densities is . For position B, the few self-consistent solutions require the column densities in a tiny range of to . The average density derived is , nearly one order of magnitude higher than that at position A. The average kinematic temperature of B (61 K) is also twice as high as that of A (32 K). Even in the cases that both positions have similar densities (e.g. ), the kinematic temperature required at position B is still 2.3 times than that at position A. Therefore we can conclude that the reversed line ratios along the bright rim are produced by either high densities, or high temperatures, and likely both. Both possibilities can be explained by radiation and pressure of the ongoing RDI, where ionizing shock wave of the RDI propagates into the molecular cloud, compressing it at the edge, and thus makes the density and temperature of the edge even higher than the center.
In comparison with the LVG analysis results, we have also calculated the column densities assuming LTE conditions. Taking the upper energy level temperature of 16.6 K (Qin et al., 2008b), the column density of CO is given by (Garden et al., 1991):
| (1) |
and
| (2) |
where the beam filling factor is assumed to be 1, and the cosmic background temperature is taken as 2.732 K. With the 12CO (=2-1) line properties listed in Table 1, we derive a CO column density of for position A, and for position B. Because 12CO (=2-1) is always considered optically thick, the column density derived here should be a lower limit. Compared with the column densities from LVG analysis, we find that LVG results at position A roughly agree with the LTE calculation, but for position B, all the LVG solutions are lower than the LTE lower limit. This result agrees with the scenario that at position B the LVG calculation requires less column density than LTE to explain the observing results because it takes into account enhanced photon escape probability due to greater velocity gradient at the bright rim, where the nearby HII region agitates the molecular cloud with strong FUV radiation pressure and heating, exhibiting a case of RDI.
5 Summary
We present analysis of large scale mapping observations of the molecular lines 12CO (=2-1) 12CO (=3-2) 13CO (=2-1) and 13CO (=3-2) transition emissions toward the Cepheus B molecular cloud. The target lies at the edge of HII region S155, and is surrounded by an optically bright rim. The CO =3-2 emission is stronger than =2-1 emission along the bright rim. PV diagrams of this region show a velocity gradient from the head of the cloud to the tail, which is characteristic of RDI. According to the LVG analysis, the density and temperature at the edge of the cloud are higher than that at the center. All of our results provide evidences that RDI is taking place in Cepheus B molecular cloud.
Acknowledgements.
We would like to thank Sheng-Li Qin, Martin Miller and Nimei Chen for permission to use observation data and useful directions and discussions. We would also like to thank Rui Xue for his kind and helpful advice.References
- Blaauw (1964) Blaauw, A. 1964, ARA&A, 2, 213
- Bachiller et al. (2002) Bachiller, R., Fuente, A., & Kumar, M. 2002, A&A, 381,168
- Bertoldi (1989) Bertoldi, F. 1989, ApJ, 346, 735
- Beuther et al. (2000) Beuther, H., Kramer, C., Deiss, B., & Stutzki, J. 2000, A&A, 362, 1109
- Downes (1989) Downes D., 1989, In: Appenzeller I., Habing H.J., Lena P. (eds) Evolution of Galaxies, Astronomical Observations. Springer Verlag, Heidelberg
- Felli et al. (1978) Felli, M., Tofani, G., Harten, R. H., & Panagia, N. 1978, A&A, 69, 199
- Lada (1987) Lada, C. J. 1987, Star Forming Regions, 115, 1
- Lefloch & Lazareff (1994) Lefloch, B., & Lazareff, B. 1994, A&A, 289, 559
- Lefloch & Lazareff (1995) Lefloch, B., & Lazareff, B. 1995, A&A, 301, 522
- Garden et al. (1991) Garden, P. R., Hayashi, M., Hasegawa, T., Gatley, I., & Kaifu, N. 1991, ApJ, 374, 540
- Garmany (1973) Garmany, C. 1973, AJ, 78, 185
- Getman (et al.) Getman, K., Feigelson, E., Luhman, K., Sicilia-Aguilar, A., Wang J., & Garmire G. 2009, ApJ, 699, 1454
- Goldreich et al. (1974) Goldreich, P., Kwan, J. 1974, ApJ, 189, 441
- Jarrett et al. (2000) Jarrett T.N., Chester T., Cutri R., Schneider S., Skrutskie M., Huchra J.P., 2000, AJ, 119, 2498
- Kurtz et al. (1994) Kurtz, E.Churchwell, D.O.S. Wood 1994, Ap&SS, 91, 659
- Minchin et al. (1992) Minchin N., Ward-Thomson D., White G., 1992, A&A265, 733
- Mookerjea et al. (2006) Mookerjea, B., Kramer, C., Roellig, M., Masur, M. 2006, A&A, 456, 235
- Panagia et al. (1981) Panagia, N., & Thum, C., 1981, A&A, 98, 295
- Qin et al. (2008a) Qin, S.-L., Zhao, J.-H., Moran, J. M., Marrone, D. P., Patel, N.A., Wang, J.-J., Liu, S.-Y. & Kuan, Y.-J., 2008a, ApJ, 677, 353
- Qin et al. (2008b) Qin, S.-L., Wang, J.-J., Zhao, G., Miller, M., & Zhao J.-H., 2008b, A&A, 484, 361
- Reipurth (1983) Reipurth, B., 1983, A&A, 117, 183
- Sargent (1977) Sargent, A. I. 1977, ApJ, 218, 736
- Sargent (1979) Sargent, A. I. 1979, ApJ, 233, 163
- Sharpless (1959) Sharpless, S. 1959, ApJS, 4, 257
- Sugitani (1991) Sugitani, K., Fukui, Y., & Ogura, K. 1991, Ap&SS, 77, 59
- Sugitani (1995) Sugitani, K., Tamura, M., & Ogura, K. 1995, ApJ, 455, L39
- Sugitani (1997) Sugitani, K., Morita, K., Nakano, M., Tamura, M., & Ogura, K. 1997, ApJ, 486, L141
- Testi et al. (1995) Testi, L., Olmi, L., Hunt, L., Tofani, G., Felli, M., & Goldsmith, P. 1995, A&A, 303, 881
- Weintraub (1996) Weintraub D. A., Kastner J. H., 1996, AJ, 458, 670
- White et al. (1997) White, G., Lefloch, B., Fridlund, C. Aspin, C., Dahmen, G., Minchin, N., & Huldtgren, M. 1997, A&A, 323, 931