Formation of Dark Matter Haloes in a Homogeneous Dark Energy Universe
Abstract
Several independent cosmological tests have shown evidences that the energy density of the Universe is dominated by a dark energy component, which cause the present accelerated expansion. The large scale structure formation can be used to probe dark energy models, and the mass function of dark matter haloes is one of the best statistical tools to perform this study. We present here a statistical analysis of mass functions of galaxies under a homogeneous dark energy model, proposed in the work of Percival (2005), using an observational flux-limited X-ray cluster survey, and CMB data from WMAP. We compare, in our analysis, the standard Press-Schechter (PS) approach (where a Gaussian distribution is used to describe the primordial density fluctuation field of the mass function), and the PL (Power Law) mass function (where we apply a nonextensive q-statistical distribution to the primordial density field). We conclude that the PS mass function cannot explain at the same time the X-ray and the CMB data (even at 99% confidence level), and the PS best fit dark energy equation of state parameter is , which is distant from the cosmological constant case. The PL mass function provides better fits to the HIFLUGCS X-ray galaxy data and the CMB data; we also note that the parameter is very sensible to modifications in the PL free parameter, , suggesting that the PL mass function could be a powerful tool to constrain dark energy models.
pacs:
98.80.Es; 95.35.+d; 98.62.SbI Introduction
In the last few years, several experiments and observations have shown strong evidences that the expansion of our Universe is accelerating, under the influence of a mysterious dark energy componentObserv ; Sper07 . The dark energy presents an equation of state parameter and represents about 74% of the Universe. When we have the special case of the cosmological constant - or vacuum energy - as responsible for the Universe acceleration (it is the standard cosmological model).
We also know that around 26% of the Universe are composed by matter (baryonic + dark matter); analyzing the growth of these matter density fluctuation, we can describe the formation of the large structures, such as clusters and super-clusters of galaxies.
The mass function of galaxies is a powerful tool to study the large scale structure formation in the Universe. The standard analytical approach was developed in 1974 by Press and SchechterPS74 (hereafter PS), and it is still used today, for its success and simplicity. The PS approach uses a Gaussian distribution to describe the primordial matter density fluctuation field.
Inspired by Tsallis -nonextensive statisticsTsal88 and kinetic theoryRS00 ; ZER , we have proposed a new mass functionL04 ; L07 ; L08 , replacing the Gaussian by a non-Gaussian distribution - a Power Law (PL) distribution. The PL mass function has a physically motivated free parameter (related with the long range gravitational correlations between particles), which provides malleability to fit observational data. Also, if we recover the original Gaussian distribution. The PL mass function is an extension of the PS one, and presents the same analytical simplicity.
We have compared the PS mass function with the PL one, in the special case of the cosmological modelL08 . Using the X-ray flux-limited sample of galaxy clusters from Reiprich and Boehringerreiprich02 (HIFLUGCS) in a statistical analysis, and applying independent cosmological tests (BAO and Shift Parameter) to better constrain the results, we concluded that the PS approach presents incompatibilities with the independent CMB data. On the other hand, using the PL mass function, we have better cosmological parameters, and we note an overlap with the CMB data for a large range of values of its free parameter. These results, although encouraging, are limited to the model ().
The mass function could be used to probe the dark energy behavior in the Universe, and works using homogeneous and non-homogeneous dark energy in the large scale structure formation are beginning to flourish in the literature. In this work we use a model of homogeneous dark energy from PercivalPerci1 . By allowing other values for the dark energy parameter, we can compare the applicability of the PS and the PL mass functions to probe dark energy models.
II The Mass Function Equations
The distribution of bound objects with masses between and , using the Gaussian distribution to describe the primordial density fluctuation field (The PS approach) readsPS74 :
| (1) |
where is the mean squared fluctuation, and is the critical for collapse.
Now, if instead of Gaussian we use the PL distribution for the initial fluctuations, we derive the follow expressionL04 ; L07 ; L08
| (2) | |||||
where the factor is a one-dimensional normalization constant. In the limit the above PL expression reduces to the standard Gaussian approach.
III Results and Future Perspectives
We performed a statistical procedure using the X-ray HIFLUGCS data samplereiprich02 , and so we determined the statistical confidence contours (from to errors) for the pair of parameters, and . We applied the homogeneous dark energy model of PercivalPerci1 , and we marginalized over all possible values of the dark energy equation of state parameter .
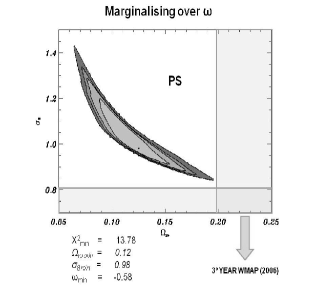
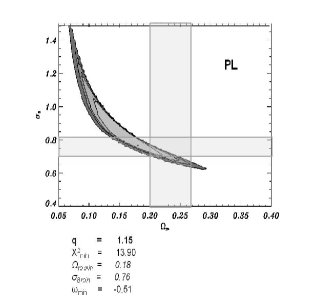
In Figure 1 we show the contours in the - plane obtained by using the PS and the PL approaches. The left panel shows the PS results: the best-fit to the HIFLUGCS X-ray galaxy cluster data are , and . The best fit values of and are, respectively, very low and very high when compared to the nowadays independent CMB resultsSper07 . the solid vertical and horizontal lines show the minimum and maximum CMB limits (from WMAP 3 years data) for the and parameters. The contours using the Gaussian distribution (the left panel) does not intercept the CMB values. In the other hand, by using the PL mass function with a certain free parameter (the right panel of Figure 1), we could overlap the WMAP independent data, for almost the same dark energy parameter (in this example, we use ). In Figure 1 we see that, for almost the same particular model of dark energy (), we obtain better cosmological parameters using the PL mass function, while the standard PS mass function cannot explain the independent WMAP data even at confidence level.
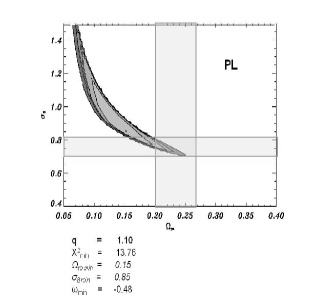
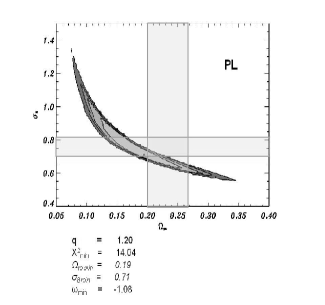
In Fig. 2, we plot two statistical contours in the - plane, using the HIFLUGCS data with the PL mass function, under the dark energy model of PercivalPerci1 . Again we marginalize over all possible values of . By fixing in the PL mass function, we obtain as best-fit a dark energy , and (and the plot overlap the independent WMAP data with this configuration). When we fix the plot continues to overlap the WMAP data, with almost the same best-fit for and , but it presents a huge modification in the best-fit dark energy parameter ( here, close to the cosmological constant case). So, in the range , the PL mass function provides better fits to the HIFLUGCS X-ray galaxy data and the independent data from CMB. Also, the sensibility over the parameter, as we change the free parameter, indicates that the PL mass function could be a powerful tool to constrain dark energy models.
It must to be noted, however, that we are using the standard Press & Schechter approach, in this present work. This approach smooths the initial density fluctuations, and uses the spherical model to calculate the epoch of critical overdensity for collapse of the density perturbations ( - critical linear density contrast at collapse time). Such simple model eventually fail in detail, given structure formation complexities like, for example, the asymmetrical gravitational collapse; meanwhile, recent mass function improvements from numerical simulations have now quantified these problems - e.g. the Sheth & Tormen ellipsoidal collapse (1999 - hereafter ST)ST , and the universal function of Jenkins et al. (2001 - hereafter Jenkins)Jenkins .
In this work, we use the Percival critical overdensity for collapse (), with growth factor derived from the special case of flat dark energy models with constant parameter (equations 19 to 21 from reference Perci1 ). This critical overdensity is only weakly dependent on cosmological parameters, and the cumulative mass function, using the numerical fit of ST, presents very little difference for different cosmologies (different dark energy parameters) at low redshifts ( close to zero); but as we go further back in time (towards higher redshifts), the difference becomes appreciable (figure 6 from Perci1 ). We see that the evolution of the mass function is strongly dependent on , due to the evolution of the linear growth factor (which affects directly).
It is worth to discuss, at this point, the results from the work of Matthew et al. (2009 - hereafter Matthew)Mat . Matthew studied the role of the linear density contrast at collapse time, , in Early Dark Energy (EDE) models - where dark energy has a non-negligible importance since the beginning of the structure formation process. Using a pure numerical approach to compute , Matthew found that, at redshift , the EDE mass functions are not greatly altered compared to the LCDM cosmological model, but the difference increases with redshift - the same conclusion as Francis et al. (2008, hereafter Francis)Francis . Matthew also demonstrates that the EDE model presents a basic agreement between the ST and the Jenkins mass functions, even if we use a cosmology dependent , derived from the spherical collapse model. However, when we compare the Jenkins mass function (which is ’blind’ to the growth history of the universe) to the ST mass function with a fixed (), or deriving ST from the spherical model (where the history of the universe - the growth history - counts), we can see small differences between these mass functions in the high mass end (); despite these differences, the most up-to-date numerical simulations have not sufficient accuracy at this high mass range to discriminate between these two approaches.
So, we observe a general agreement between the conclusions of Percival, Matthew and Francis, concerning dark energy models in the structure formation. All dark energy mass functions, ST or Jenkins, have almost the same behavior as the LCDM model at , and at high redshifts we can perceive differences between the cosmological models, due to the evolution of the linear growth function. In the work of Percival, the focus is the difference based on the dark energy parameter, and in the work of Matthew and Francis, the focus is the difference between the ST (with fixed or evolving ) and the Jenkins mass function.
In this present work we use, as said before, the standard PS approach, with a Gaussian and a non-Gaussian (PL) initial distribution function. We use in this work a low-redshift X-ray galaxy cluster survey, but even at small redshifts we show a strong mass function dependence on the dark energy parameter, using the PL approach, and the statistical procedure show significant contour differences between the dark energy mass function and the LCDM cosmological model. This show clearly the power of the PL mass function free parameter to fit observational data; and if this malleability is observed to galaxy clusters at , we should expect even more exciting results using high redshifts catalogs, to probe the characteristics of the dark energy, in a close future. Also, we intend to study these dark energy models using ST and Jenkins mass functions as well, studying the influence in the process, to compare our results with the previous conclusions of Percival, Matthew and Francis.
IV Conclusions
In this work we perform a statistical analysis, using the X-ray galaxy cluster data named HIFLUGCSreiprich02 , and the independent Cosmic Microwave Background radiation (CMB) data from WMAPSper07 , to study the influence of galaxy mass functions under a homogeneous dark energy background, from the work of PercivalPerci1 . Performing a analysis and marginalizing over the dark energy equation of state parameter, we compare the standard Gaussian Press-Schechter mass functionPS74 to the PL mass function (based on the non-extensive thermodynamics and kinetic theory), which presents a physically motivated free parameter, L04 ; L07 ; L08 .
We conclude that the PS mass function cannot explain at the same time the X-ray and the CMB data, even at confidence level, which imposes a problem to the standard Gaussian scenario. Also, the PS approach presents a best fit dark energy equation of state parameter of , which is clearly distant from independent estimates of (a cosmological constant).
Observing the contours of Figure 2, in the range , the PL mass function provides better fits to the HIFLUGCS and the CMB independent data, with almost the same best-fit for and , but with a huge modification in the best-fit dark energy parameter, as we change . This strongly suggests that the PL mass function could be a powerful tool to constrain dark energy models. Future analysis, based on the next generation of cluster surveys in medium and high redshifts, will certainly provide better constraints to the dark energy model that accelerates de Universe.
Acknowledgements
The author are grateful to ECT-UFRN and FAPESP, for the financial support provided, and to Lima J.A.S. for helpful discussions.
References
- (1) A. G. Riess et al., Astrophys. J. 659, 98 (2007); R. G. Carlberg et al., ApJ. 462, 32 (1996); A. Friaca, J. S. Alcaniz and J. A. S. Lima, Mon. Not. R. Astron. Soc. 362, 1295 (2005), ArXiv:0504031 [astro-ph]; S. W. Allen, R. W. Schmidt and A. C. Fabian, MNRAS 334, L11 (2002); J. A. S. Lima, J. V. Cunha and J. S. Alcaniz, Phys. Rev. D 68, 023510 (2003), ArXiv:0303388 [astro-ph]; J. V. Cunha, L. Marassi and R. C. Santos, IJMPD 16, 403 (2007); J. V. Cunha, L. Marassi and J. A. S. Lima, MNRAS 379, L1-L5 (2007), ArXiv:0611934 [astro-ph].
- (2) D. N. Spergel et al., Astrop. J. Suppl. 148, 175 (2003); D. N. Spergel et al., Astrophys. J. Supl. 170, 377 (2007); J. Dunkley et al., ArXiv:08030586 [astro-ph]; E. Komatsu et al., ArXiv:08030547 [astro-ph].
- (3) W. H. Press, P. Schechter, ApJ 187, 425 (1974).
- (4) C. Tsallis, J. Stat. Phys. 52, 479 (1988).
- (5) R. Silva, J. A. S. Lima and J. Santos, Phys. Rev. E61, 3260 (2000); F. Valentini, Phys. Plasmas 12, 072106 (2005).
- (6) J. R. Bezerra, R. Silva and J. A. S. Lima, Physica A 322, 256 (2003).
- (7) J. A. S. Lima and L. Marassi, IJMP D13, 1345 (2004).
- (8) L. Marassi and J. A. S. Lima, IJMP D16, 445 (2007).
- (9) L. Marassi, J. V. Cunha and J. A. S. Lima (2008), ArXiv:08070444 [astro-ph].
- (10) T. H. Reiprich and H. Boehringer, Astrophys. J 567, 716 (2002).
- (11) W. Percival, A&A, 309, 823 (2005).
- (12) R. K. Sheth and G. Tormen, MNRAS, 308, 119 (1999).
- (13) A. Jenkins, C. S. Frenk, S. D. M. White, J. M. Colberg, S. Cole, A. E. Evrard, H. M. P. Couchman, and N. Yoshida, MNRAS, 321, 372 (2001).
- (14) J. F. Matthew, F. L. Geraint and V. L. Eric, MNRAS, 393, L31 (2009).
- (15) M. J. Francis, G. F. Lewis and E. V. Linder (2008),ArXiv:08082840 [astro-ph]..