Near-Infrared Spectroscopy of Low Mass X-ray Binaries :
Accretion Disk Contamination and Compact Object Mass Determination in
V404 Cyg and Cen X-4
Abstract
We present near-infrared (NIR) broadband (0.80–2.42 m) spectroscopy of two low mass X-ray binaries: V404 Cyg and Cen X-4. One important parameter required in the determination of the mass of the compact objects in these systems is the binary inclination. We can determine the inclination by modeling the ellipsoidal modulations of the Roche-lobe filling donor star, but the contamination of the donor star light from other components of the binary, particularly the accretion disk, must be taken into account. To this end, we determined the donor star contribution to the infrared flux by comparing the spectra of V404 Cyg and Cen X-4 to those of various field K-stars of known spectral type. For V404 Cyg, we determined that the donor star has a spectral type of K3 III. We determined the fractional donor contribution to the NIR flux in the H- and K-bands as and , respectively. We remodeled the H-band light curve from Sanwal et al. (1996) after correcting for the donor star contribution to obtain a new value for the binary inclination. From this, we determined the mass of the black hole in V404 Cyg to be . We performed the same spectral analysis for Cen X-4 and found the spectral type of the donor star to be in the range K5 – M1V. The donor star contribution in Cen X-4 is in the H-band while in the K-band, the accretion disk can contribute up to 10% of the infrared flux. We remodeled the H-band light curve from Shahbaz et al. (1993), again correcting for the fractional contribution of the donor star to obtain the inclination. From this, we determined the mass of the neutron star as . However, the masses obtained for both systems should be viewed with some caution since contemporaneous light curve and spectral data are required to obtain definitive masses.
1 Introduction
V404 Cyg and Cen X-4 belong to the class of low-mass X-ray binaries (LMXBs) in which mass transfer from a late type star to a black hole (BH) or a neutron star (NS) takes place via an accretion disk. By determining the mass of the compact object, we can constrain models for the formation and evolution of black holes and neutron stars in close binary systems (Brown et al.,, 1998; Fryer & Kalogera, 2001; Nelemans & van dan Heuval,, 2001). Of the 16 BH systems with BH masses determined to accuracies of 5–30%, most of the masses range from 4 – 16 M⊙ with only one system, J0422+32, with a BH mass 5 M⊙ (Charles & Coe, 2006; Casares, 2006; Gelino & Harrison, 2003). This result is not in agreement with the predictions of BH mass distributions from theoretical modeling which predict a continuous decreasing mass distribution from neutron star masses up to 10 – 20 (Fryer & Kalogera, 2001; Belczynski et al., 2008). However, there currently are not enough systems with precise mass determinations to allow us to distinguish between observational biases and/or theoretical limitations as the source of the disparity. To increase the number of LMXBs with precise compact object mass determinations, we have undertaken NIR spectroscopy of several systems to determine the relative contributions of the donor star and the accretion disk to the NIR light curves, from which accurate binary inclinations and, in turn, stellar masses are derived. In this paper, we present results for two LMXBs, the BH binary V404 Cyg and the NS binary Cen X-4.
V404 Cyg went into outburst on May 22, 1989 and was subsequently discovered with the all-sky monitor aboard the Ginga satellite. A high X-ray luminosity of ergs/sec suggested that the system was a close binary system with a black hole or a neutron star as the accretor (Marsden, 1989). During the outburst, the visual magnitude of V404 Cyg increased from V=18.3 to V=11.6. One year after its discovery, it had fallen back to V=18.0 (Wagner et al., 1992). Since then, V404 Cyg has been studied in quiescence at optical and infrared wavelengths, establishing most of the system parameters. Casares et al. (1992) established the mass function, the minimum mass of the compact object, as which was later refined by Casares & Charles (1994) to be . They determined the donor star to be of spectral type K0IV and obtained the binary mass ratio from the rotational broadening of the absorption lines in the donor star spectrum. The ellipsoidal modulation of the donor star has been modeled in the NIR to determine the binary inclination and the black hole mass: in the K-band by Shahbaz et al. (1994) and in H by Sanwal et al. (1996). The resulting black hole mass determinations were 12 M⊙ and 12.5 M⊙, respectively, where one of the key differences between their results was that Shahbaz et al. (1994) assumed that the donor star was the only source of flux in the NIR, while Sanwal et al. (1996) found evidence for accretion disk contamination. Shahbaz et al. (1996) tested this assumption by performing NIR spectroscopy of V404 Cyg. By comparing the NIR spectrum to scaled template spectra from spectral type standard stars, they determined that the donor star contributes 10011 % of the K-band flux. However, for this analysis they relied on fits to the 12CO bands in K, which in other LMXBs (and cataclysmic variables) have been found to be affected by metallicity variations in the carbon abundance (Froning et al., 2007). As a result, a broader spectral analysis that examines multiple atomic and molecular species is required to firmly tie down the donor star contribution in the NIR.
Cen X-4 was discovered on May 23, 1969 by the satellite (Conner et al., 1969) when it went into X-ray outburst. During its second outburst in 1979, it increased in visual magnitude by 6 magnitudes from its pre-outburst phase (Canizares et al., 1980). Matsuoka et al (1980) identified the mass accreting star as a neutron star due to the fact that it displayed a Type I burst. Shahbaz et al. (1993) modeled the H-band light curve to obtain a binary inclination of 31∘–54∘ and the mass of the neutron star as 0.5–2.1M⊙. In quiescence, Torres et al. (2002) performed high-resolution optical spectroscopy on Cen X-4 and determined the mass of the compact object as . They determined the mass function to be , which was later refined by D’Avanzo et al. (2005) to . The system parameters were again refined by Casares et al. (2007) and much tighter constraints were imposed on the radial velocity semi-amplitude, km s-1, the orbital period, d and the binary mass ratio, . The mass function adopted for this paper is calculated from the and values of Casares et al. (2007), which is . However, as with V404 Cyg, in all the above cases, it was assumed that the donor star was the only NIR flux source, an assumption that has not been tested in Cen X-4.
In this paper, we present broadband (0.8–2.42 m) NIR spectroscopy of V404 Cyg and Cen X-4 obtained with SpeX on the IRTF. By comparing the spectra to field stars of known spectral type, we determine the donor star contribution to the infrared flux for both systems. We use these results to remodel previously obtained light curve data to determine the binary inclinations and to derive precise compact star masses for both targets.
2 Observations
V404 Cyg and Cen X-4 were observed on June 7–9, 2007 with SpeX at the NASA Infrared Telescope Facility (Rayner et al., 2003). The weather was clear with good seeing conditions (). All observations were made using the Short XD (SXD) mode through the slit (R=1200), which covers the entire wavelength range, 0.8–2.4m, simultaneously in 6 orders. Due to the good seeing conditions and the narrow slit used, the observed spectrum is uncontaminated by an accidental companion star at from V404 Cyg. An A0V star was observed hourly for the purpose of telluric correction. Observations were taken in ABBA pairs in two positions along the slit with a 300 sec exposure time at each position. The slit was oriented along the parallactic angle throughout the observations, limiting the relative flux calibration uncertainties to (Vacca et al., 2003). Table 1 lists the observations along with the corresponding cumulative exposure times and orbital phases observed.
Data reduction consisted of calibration (sky subtraction, flat-fielding, wavelength calibration), optimal spectral extraction, and telluric correction, all of which were carried out using the idl based package Spextool (Cushing et al., 2004). Each exposure was shifted to the rest frame of the donor star, using the orbital ephemeris from Casares & Charles (1994) for V404 Cyg and from Casares et al. (2007) for Cen X-4. The individual shifted exposures were median-combined and all 6 orders were merged to obtain the time-averaged spectrum. Using the magnitudes of the A0V star, the telluric correction tool, xtellcor, also flux calibrates the spectra. Given our excellent observing conditions, the absolute fluxes should be fairly accurate, although we have not made any attempt to quantify the accuracy of those values, as they are not necessary for our analysis.
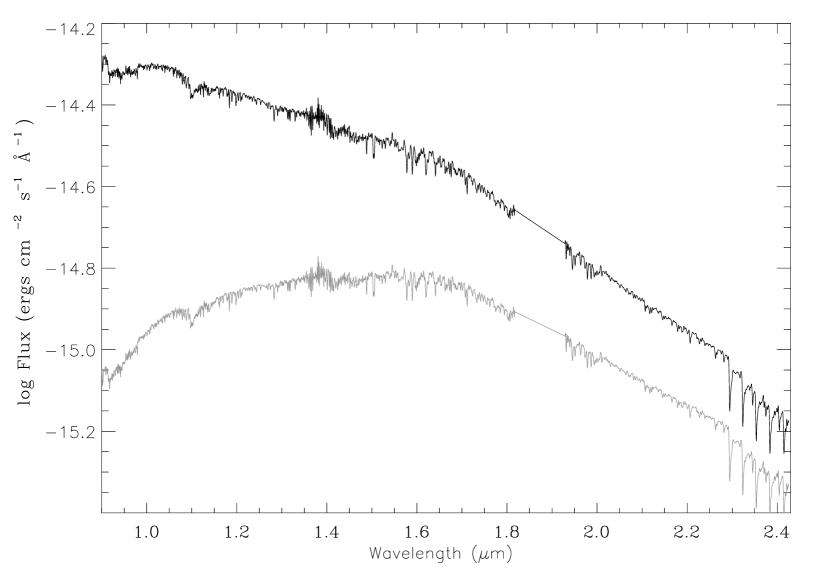
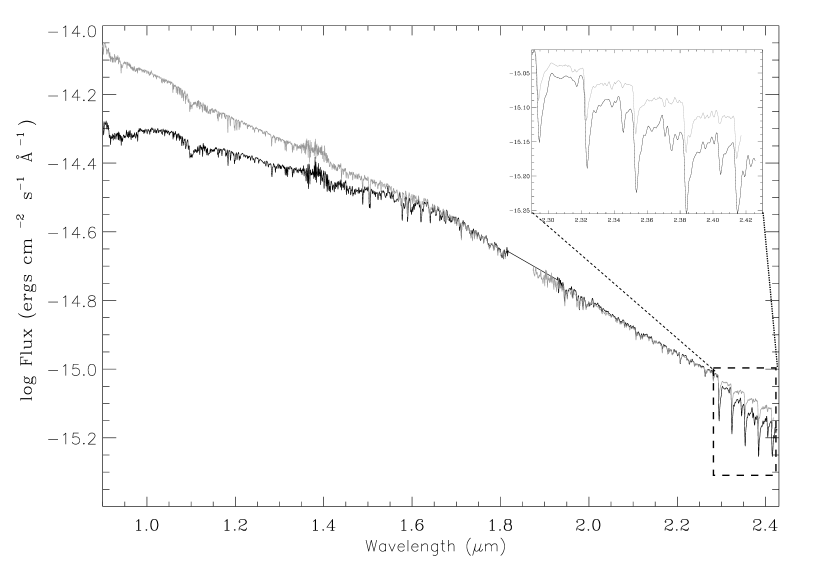
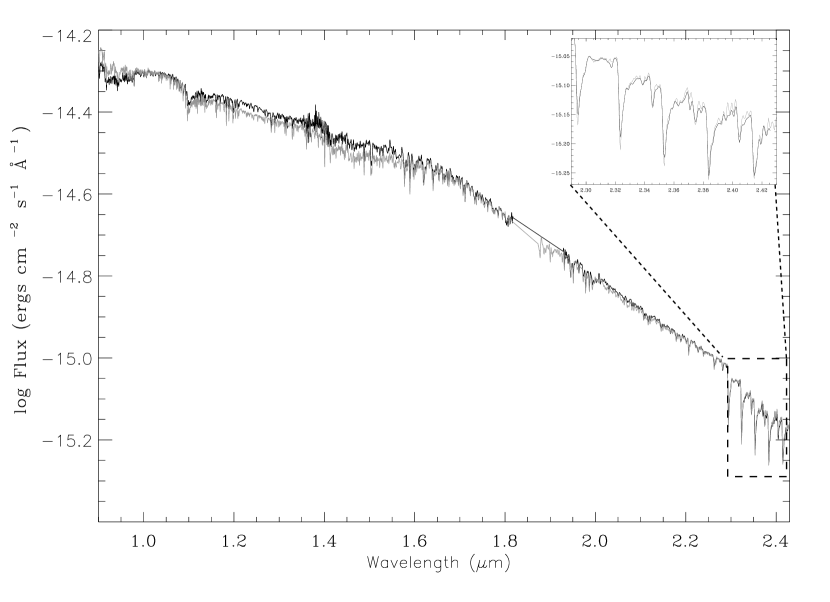
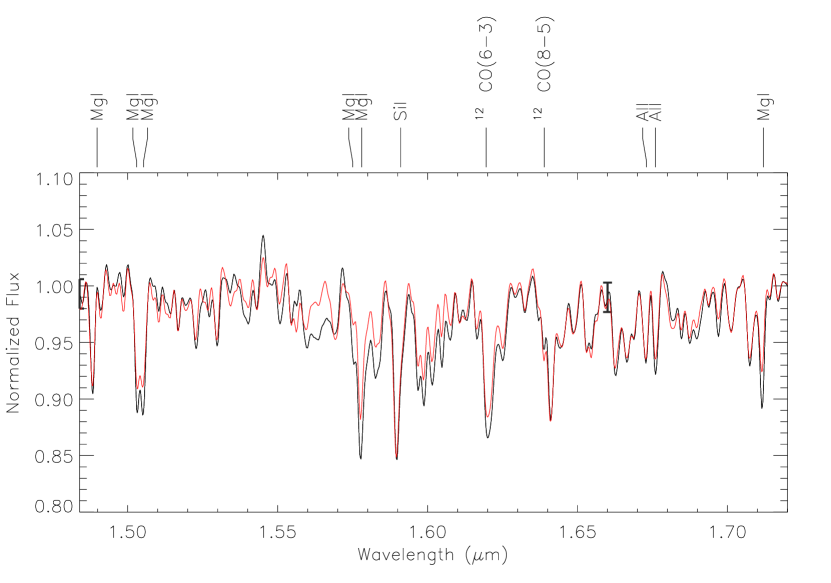
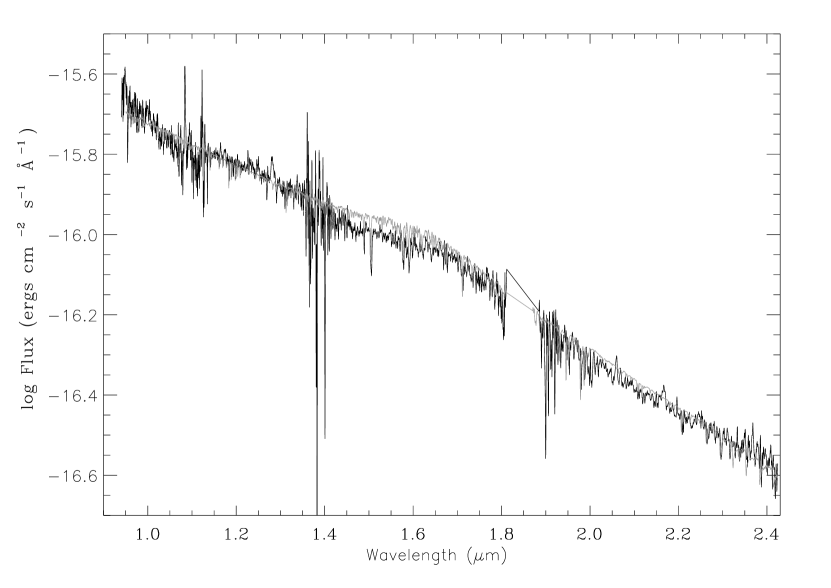
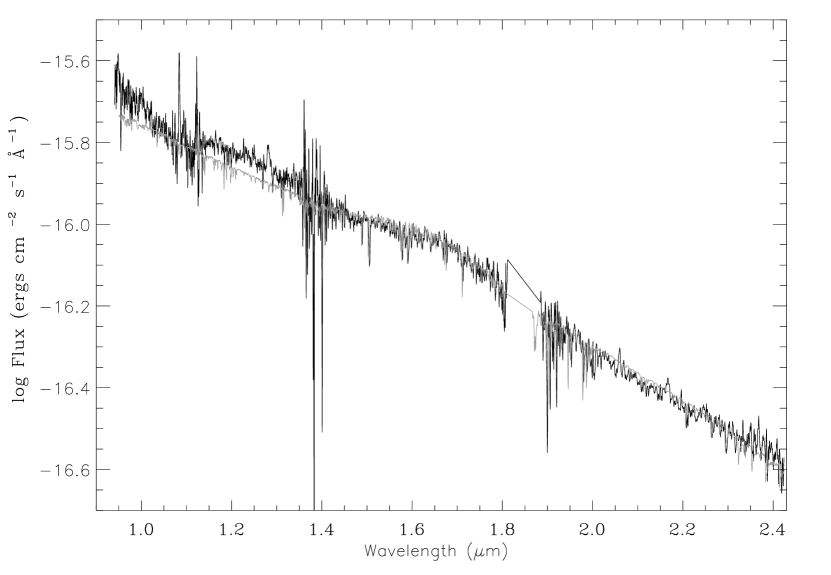
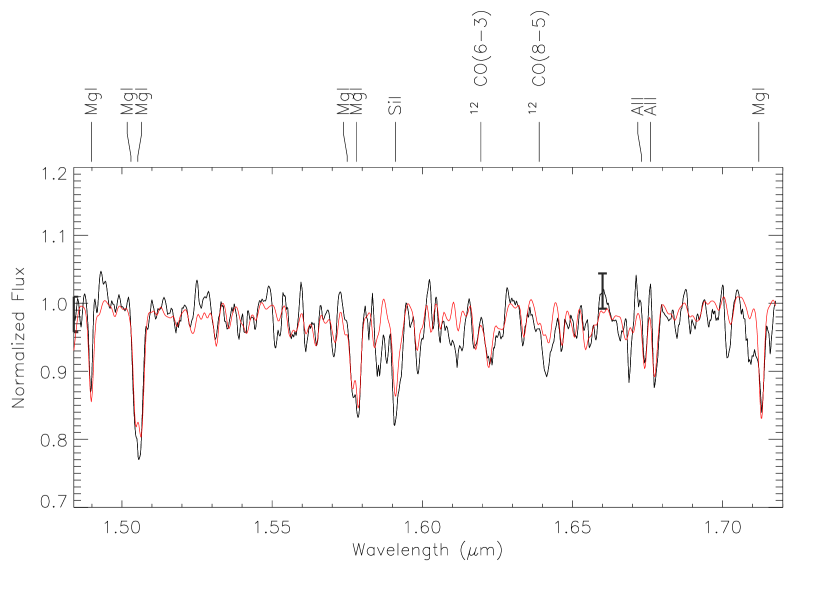
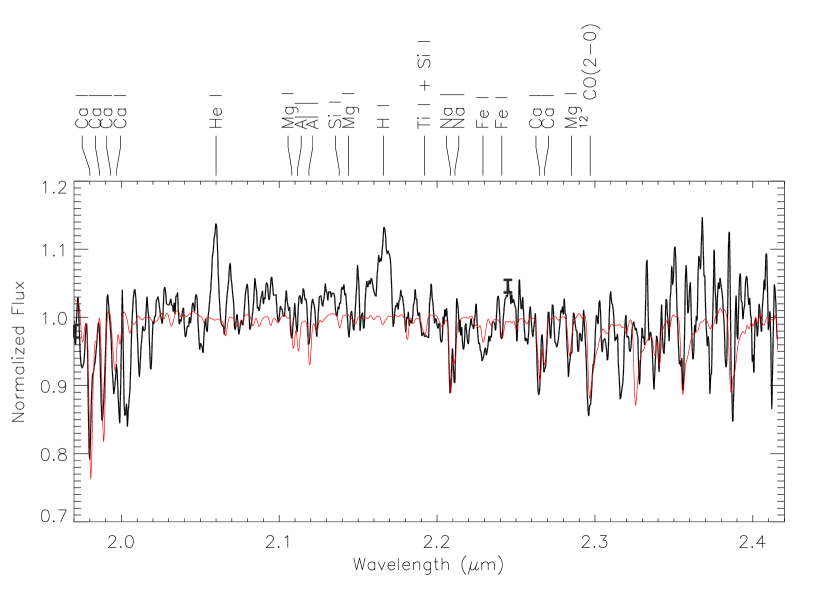
Figure 1 shows the time-averaged spectrum of V404 Cyg. The spectrum has been boxcar smoothed by 3 pixels, corresponding to one resolution element. Statistical errors were propagated through all the data reduction and processing steps. The spectrum was corrected for interstellar reddening using a dereddening value of E(B-V)= 1.303 (Hynes et al., 2009; Miller-Jones et al., 2009). The spectrum in red in Figure 1 is the dereddened spectrum of V404 Cyg. Shown in Figure 2, 3, and 4 are the J-, H-, and K-band spectra. We have labeled the prominent spectral features using line identifications from Wallace & Hinkle (1997), Wallace et al. (2000), Kleinmann & Hall (1986), Meyer et al. (1998), Kirkpatrick et al. (1993), and the Atomic line list111http://www.pa.uky.edu/ peter/atomic. Figure 5 shows the time-averaged spectrum of Cen X-4. It has been boxcar smoothed by 3 pixels and dereddened assuming E(B-V)= 0.1 (Blair et al., 1984). Figures 6, 7, and 8 shows the J-, H-, and K-band spectra of Cen X-4. We estimated the S/N in the time-averaged spectra of V404 Cyg and Cen X-4 by fitting straight lines through various continuum-dominated regions and measuring the scatter around these fits. For Cen X-4 we obtained a S/N 15–20 in J and K, and 25–30 in H. As the donor in V404 Cyg is likely a giant or sub-giant, there are fewer regions of pure continuum. Therefore, we obtained a lower limit to the S/N of 100 in H and K, and 50 in J.
3 Analysis
3.1 V404 Cyg
The spectrum of V404 Cyg shows prominent narrow absorption lines of neutral metals including Al I, Na I, K I, Mg I, Fe I, Si I, Mg I, Ti I and Ca I . The H-and K-bands also show molecular absorption bands of 12CO and 13CO. The absorption lines originate in the donor star. In contrast to many other X-ray binaries, V404 Cyg does not show any strong emission lines in its infrared spectrum. Shahbaz et al. (1996) performed K-band spectroscopy of V404 Cyg and found no strong emission features either, implying that the accretion disk contribution in V404 Cyg in quiescence is probably very low at all times. In the K-band, we see both 12CO and 13CO features which are a strong indication of an evolved donor star. In this paper, we make use of the entire broadband infrared spectrum to ascertain the spectral type of the donor star and then obtain a precise value for the relative contributions of the donor star and the accretion disk.
First, we compared the broadband spectrum of V404 Cyg to field stars of different spectral types. These spectra were obtained from the IRTF Spectral Library222http://irtfweb.ifa.hawaii.edu/ spex/WebLibrary/index.html which consists of SpeX SXD spectra of stars of known spectral type (Rayner et al., 2009). The template stars used in our analysis have roughly solar metallicities and similar S/N to each other. We only used non-variable stars for our analysis. Earlier work done on the spectral type of the donor star in V404 Cyg suggested a K0IV spectral type (Casares & Charles, 1994). In the IRTF spectral library, the closest available spectral type to a K0 IV is a K1 IV. In Figure 9, we compare the spectrum of a K1 IV (HD165438) star to the spectrum of V404 Cyg, normalizing the spectrum to that of V404 Cyg just blueward of 2.29m. It is evident that the CO bands in the template spectrum are much weaker compared to those in V404 Cyg. Also, if the template is normalized to V404 Cyg in K, its flux exceeds the J-band flux in V404 Cyg flux by , indicating that a K1 IV spectrum is too blue to match the donor star spectrum in V404 Cyg, unless there is another NIR flux source diluting its contribution.
Hynes et al. (2009) did a multiwavelength study of the spectral energy distribution (SED) of V404 Cyg in quiescence and found no substantial contribution from the accretion disk from near-UV to near-IR. They also found that for the donor, the spectrum of a K0 III star was in agreement with the data from UV to near-IR. At the same time, their multiwavelength SED comparison with a G8 III and a K2 III star could not be distinguished from a K0 III. We find that a K2 III (HD 132935) spectrum exceeds most of the J-band (.8 – 1.1 m) flux by 7% when normalized in K, indicating that a K2 III donor star spectral type would require a diluting flux source in the NIR. Also, the CO bands in a K2 III appear too weak to match that of V404 Cyg in the K-band. In Figure 10, we compare a K3 III (HD 221246) spectrum to that of V404 Cyg. In this case, the match is much closer, both in the broadband shape and spectral fluxes and in the relative depths of the CO bands. When normalized to a 100% in K, we find that the K3 III template exceeds the J-band, near the band edge (.8 – .9 m) by at most 5%. On the other hand, the K4 III (HD 207991) spectrum falls below the V404 Cyg spectrum in J by 20%, so that if that spectral type is correct, the donor star may dominate the NIR flux in H and K, with an increasing disk contribution at bluer wavelenghs. In conclusion, both the spectral shape and the strength of the CO bands in V404 Cyg are inconsistent with a K1 IV spectral type for the donor star and indicate that a more evolved spectral type is better match to the donor star. In the next section, we calculate the equivalent widths of various lines of V404 Cyg and compare that to the same features in field star populations to determine the spectral type more precisely.
3.1.1 Equivalent width analysis
Förster Schreiber (2000), hereafter FS, used the equivalent width (EW) ratios of various NIR absorption lines in a population of field giants and supergiants (also a few dwarfs) as indices to determine stellar effective temperature and gravity as well as evidence of dilution from non-stellar sources. In Table 2, we list the equivalent widths for V404 Cyg for the diagnostic features in FS. The error bars represent uncertainties in continuum placement only. By comparing our EWs to those in Figure 5 of FS, we obtain a donor effective temperature range of 4200–4600 K, implying a spectral type between K2 III and K4 III, assuming that the donor star is the only NIR flux source. FS also demonstrated how the EW ratios of certain lines would change if there was a source of diluting continuum emission. In their Figure 8 they plotted dilution-free indices (ratios of atomic/molecular EWs) and directional indicators to show how the indices would change as the contribution from a diluting source increases. A comparison of the same EW ratios in V404 Cyg to their indices shows that the V404 Cyg ratios fall on their plots for the non-diluted sources, suggesting that the amount of dilution in V404 Cyg in both H and K is negligible.
3.1.2 Field star fits to V404 Cyg
To obtain the fraction of NIR continuum emission originating from the donor star, , we compared the spectrum of V404 Cyg with those of field stars ranging from K2 III to K4 III spectral types. The spectrum of the template star was convolved with a Gaussian of 38.8 km s-1 FWHM in order to take into account the rotational velocity of the donor star in V404 Cyg (but we note that this correction was negligible given the 250 km s-1 resolution of our spectra). Before fitting, we normalized the spectra of both V404 Cyg and the template by fitting cubic splines along the local continuum surrounding the lines under analysis. The continuum points were picked by eye.
We determined the donor fraction as follows: after normalizing both the target and the template spectra, we multiplied the latter by a fraction, , which was incremented from 0 to 1 in steps of 0.01. The result was subtracted from the spectrum of V404 Cyg to obtain the residual. We then minimized the chi-square, , between the residual and the mean of the residual to obtain the donor fraction that gave us the best fit. In cases where the template had weaker absorption features compared to V404 Cyg, we let the donor fraction, , take on values greater than 1. Even though this represents an unphysical scenario, it is useful as a guide to constrain the correct spectral type of the donor star by calculating the extent of weakness of the absorption feature in a particular template. For the fitting procedure, we selected only the strongest absorption features and fit absorption features for individual species separately. There were cases where absorption features of two different species occurred very close together in wavelength. If we were not able to separate them and identify the continuum around those absorption features, we did not include them in our analysis.
In order to better account for the uncertainty associated with the data, we divided our individual exposures into two sets. They were then separately combined and the result of one divided by the other. The deviation from the mean was then determined for each spectral order separately to assign the errors. Since the J-band comprises of three orders, we obtained the mean of these to assign the error bars for the J-band. We used these errors for the analysis for V404 Cyg as it was clear that the statistical error bars are too small and do not account for systematic uncertainties in the data reduction process. For the template stars we used the statistical errors provided with the template spectra, but we note that the uncertainties for V404 Cyg dominate over the error in the template stars while fitting various spectral features.
Table 3 shows the donor fractions calculated for K2 III, K3 III and K4 III spectral types along with the values. When we compare the values for fits across the entire K and H-band at once, we obtain K3 III as the best match for the donor in V404 Cyg. However, in order to make our final choice on the donor spectral type, we also looked at all the individual absorption features selected for our analysis.
In the K-band, we fit the CO bands together from 2.29 – 2.42 m and obtained the best fit with a K3 III spectral type. There is a Na I feature near 2.34 m included in the fit region but the fit is dominated by the prominent CO-features. Generally, the K3 III star has the lowest for fits to individual absorption features compared to the K2 III or the K4 III template stars. For the K2 III star all the absorption features are consistently weak in the template compared to V404 Cyg (resulting in the unphysical fit, ). The K4 III template has fewer deviations than for the K2 III star, but some of the lines cannot be fit with and the values are generally larger than for a K3 III template. Even for the K3 III template, some lines give including the Mg I, Ca I and the Al I feature near 2.28 m, 1.98 m and 2.112 – 2.128m, respectively. These features deviate less from for a K3 III star than for the other templates but may indicate systematic mismatches (in temperature, gravity, or metallicity) between V404 Cyg and the field star templates. Overall, a K3 III star provides the most consistent match to the K-band spectrum of V404 Cyg.
In the H-band, looking at the CO features, we find for the K2 III template, implying very weak 12CO features in the template compared to V404 Cyg, whereas in K3 III and K4 III, the value of is and , respectively. In case of the K2 III star, the value of donor fraction is consistently for all the individual features in the H-band also indicating that most of its absorption features are weaker than in V404 Cyg. With the K3 III and K4 III stars, we find that Mg I is always weaker in the template than in V404 Cyg (except for one feature at 1.71m when compared against a K4 III template). This trend is also observed for Mg I line in K. The same is true for the Al I feature in the H-band though it is close to for the K3 III template. In the H-band too, we find that a K3 III star is the most consistent match to the donor star spectrum in V404 Cyg in terms of as well as the strength of the lines indicated by the donor fraction.
In the J-band too, we find that when we compare the values and also the strength of the absorption features of the template with respect to V404 Cyg for the three different spectral types, a K3 III spectral type best matches the donor type in V404 Cyg. From our analysis with the spectral energy distribution, equivalent width calculation of various lines and direct determination of donor fractions, we conclude that the donor star in V404 Cyg has a K3 III spectral type. We see from Table 3 that the Mg I features for a K3 III spectral type has been consistently weaker in the template than in V404 Cyg (except the one feature near .856m). This suggests an abundance mismatch between the template and V404 Cyg for this species. The same is perhaps true for Al I but there are not enough features to establish a consistent trend. For this reason, we did not include Mg I in our final donor fraction calculation.
Even though there is a good qualitative match between the spectrum and the K3 III template, our statistics are poor, ranging from for fits to individual lines in J and H to for fits to individual lines in H and broadband fits in H and K. We attempted to take into account the systematic uncertainties that dominate in NIR ground-based spectra by recalculating the error bars as described above, but it is clear that our error bars are still too large in J and portions of K and too small in H. Due to this, we did not rely on statistics to obtain our final donor fraction. Instead, we determined the donor fraction in V404 Cyg by taking an average of the best fits to multiple absorption features using a K3 III template and used the standard deviation between these line fits to represent the uncertainty on the final value of . We believe this is a better tracer of systematic uncertainties in our fitting process particularly because it also takes into account the possibility of slight mismatches between the V404 Cyg and the stellar template. Using this method, we obtained a H-band donor fraction of and a K-band fraction of . Thus, we find no substantial NIR contribution from the accretion disk in V404 Cyg similar to Hynes et al. (2009) and Shahbaz et al. (1996).
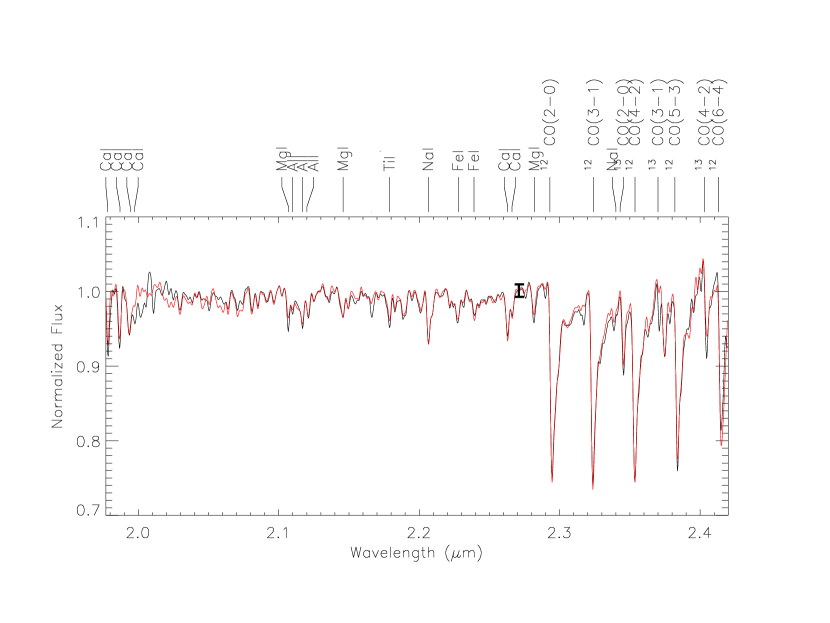
In Figure 11, we show the the K-band spectrum of V404 Cyg overplotted with the spectrum of a K3 III star scaled by a factor of 0.97. The close qualitative match between the template and spectrum is evident. The Mg I lines at 2.10 and 2.28 m are weaker in the template spectrum than in the V404 Cyg. Shown in Figure 12 is the spectrum of V404 Cyg in the H-band over plotted with a scaled K3 III spectrum using . The Mg I lines at 1.50m, 1.58m and 1.71m in the template are weaker than in V404 Cyg but the other absorption features give satisfactory fits.
3.2 Cen X-4
The spectrum of Cen X-4 shows broad emission lines of H I and He I and narrow absorption lines of neutral metals including transitions of Na I, Mg I, Al I, Si I, Ca I, Fe I and molecules including 12CO. The absorption lines originate in the cool donor star while the emission lines originate in the accretion disk. Chevalier et al. (1989) observed Cen X-4 in quiescence and determined the donor star to be of spectral type K5V – K7V. They also estimated that 25-30 of the total light was contributed by the accretion disk at visual wavelengths. In the infrared, the contribution of the accretion disk to the total flux has traditionally been expected to be even less. Shahbaz et al. (1993) obtained the H-band light curve of Cen X-4 and predicted the contribution from the accretion disk to be significantly less than 10.
Our spectrum of Cen X-4 is noisier compared to that of V404 Cyg which will make a precise spectral type determination more challenging. We compared the spectrum of Cen X-4 with field dwarfs ranging from K5 – M1 V. The normalization was done at a wavelength just blueward of the 12CO bandhead near 2.29 m. If the donor star in Cen X-4 is the only contributor to the infrared flux, we find that the spectral types K5 – K7 V can be excluded. When the flux of a K5V star is normalized to that of Cen X-4 in the K-band, it exceeds the flux in the H-band by . This excess in flux decreases as we move to cooler stars. For example, in Figure 13 we find an excess of in a K7 V star in the H-band and in the short J-band when normalized in K. From the comparisons, we conclude that if the donor star in Cen X-4 is the only NIR flux contributor, then it must be of spectral type later than K7 V; otherwise, some dilution must be present. For later spectral types, the flux of the donor star falls below that of Cen X-4 in the J-band and matches the H-band, as seen for an M0 V star in Figure 14. We also find (less than the error in the K-band) excess in the shorter K-band in all spectral types including an M0 V, indicating that some dilution, if quite small, may be needed for later spectral types as well.
3.2.1 Equivalent width analysis
The analysis in FS focuses more on giants and supergiants than dwarfs, making use of his temperature and dilution indices ideal for V404 Cyg but less so for Cen X-4. However, we calculated the equivalent widths of the absorption features used by FS. Table 4 lists the values obtained for the equivalent widths of several absorption lines in Cen X-4. Due to the lack of data on dwarfs in FS coupled with a low S/N Cen X-4 spectrum, we obtained a large scatter in the values. We relied on just the prominent lines in Cen X-4 like the Ca I line at 2.26m, the 12CO bandhead at 2.29m, the Na I line at 2.2m, and the 12CO bandhead at 1.62m to constrain the spectral range of the donor. For Ca I at 2.26m in FS, there are no data on dwarfs for the EW we obtained. With the remaining lines, we find K7 V – M1 V as the spectral range of the donor star in Cen X-4 in the event of no dilution.
Ali et al. (1995) have performed a similar analysis as FS but with emphasis on dwarfs ranging from F3 – M6 V. We calculated the equivalent widths for Ca I, Mg I, Na I and the 12CO (2-0) band using the integration limits defined in their paper, which we show in Table 5. (Note that the FS and Ali et al. (1995) EWs are typically different for the same spectral features because of different choices in the integration limits over which the EWs were calculated.) We compared the EWs obtained for Cen X-4 with Figures 3 and 4 of Ali et al. (1995). Again, if we use only the prominent lines we find that the EW from Na I points to a spectral type K5 – K7 V and that Ca I predicts a spectral type later than K7 V. The EW of the 12CO bandhead at 2.29m gives inconclusive results as it falls within the flat portion of their data as well as Mg I. Ali et al. (1995) also noted that the sensitivity of CO to gravity makes it less useful as a temperature diagnostic. In the absence of dilution, we estimate the range of the spectral type of the donor in Cen X-4 as K5 – M1 V.
Our conclusion from the EW calculation using the absorption features of Ali et al. (1995) is different from the estimate of FS in that we cannot rule out K5 V as a possible donor type. At the same time, from a spectral energy distribution comparison, if a spectral type as early as K5 V or K7 V were to be a possible donor in Cen X-4, we should expect to find some amount of dilution. We will examine the full K5 V – M1 V range to find out the best spectral type for the donor in Cen X-4. In the next section, we present the results obtained from performing a dilution analysis..
3.2.2 Field star fits to Cen X-4
We compared the spectrum of Cen X-4 with those of field dwarfs: K5 V (HD36003), K7 V (HD237903) and M1 V (HD19305) spectral types from the IRTF spectral library using the same procedure used in calculating the donor star fraction in V404 Cyg. The spectrum of the template star was convolved with a Gaussian of 43 km s-1 FWHM to account for the rotational velocity of the donor in Cen X-4. The same procedure for determining the donor fraction in V404 Cyg was used for Cen X-4. For the fitting process, we chose only the most prominent absorption features in the spectrum of Cen X-4. The absorption features of individual species were fit separately and when such features occurred too close in wavelength such that the continuum region around an individual species could not be separated, we did not include that in our analysis. Due to the lower S/N, we fitted fewer lines than in V404 Cyg.
In order to better account for the systematic uncertainties, we determined the error bars in Cen X-4 by fitting straight lines through various continuum-dominated regions in the J-, H- and K-bands. For Cen X-4, we find this a more reliable method for error determination than the method of dividing the data into half used for V404 Cyg. (Since the NIR spectra of giants have fewer regions of continuum without strong line absorption, this method could not be applied in the error determination of V404 Cyg.) We propagated the error from the template stars as well in our analysis although the values are dominated by the uncertainty from the Cen X-4 spectrum.
Table 6 shows the best fit donor fractions along with the values obtained in Cen X-4 for various wavelength ranges with K5 V – M0 V template stars. When we compare the values for fits across the entire K and H-band at once (after masking out the emission lines), we obtain an M0 V and a K5 V as the best matches, respectively. The entire J-band could not be normalized satisfactorily at once and hence is absent in Table 6. We also looked at the values and the donor fractions for individual lines. In the K-band, a K5 V star has the lowest for most of the features while in the H- and the J-bands, it is an M0 V and a K5 V star, respectively. For all the features, we also examined the donor fractions for cases where . From Table 6, it is seen that in the K-band, an M0 V satisfies for most cases and a K5 V does not; whereas in the H-band, all three spectral types are almost equally good, though the Si I feature (1.585 – 1.605 m) gives for all three templates. The same can be said of the J-band considering that the fractions and obtained for a K7 V and an M0 V in the Mg I feature are close to (especially given the low S/N of Cen X-4). From this examination, it is evident that that data will not support narrowing the spectral type of the donor star from the K5V – M0V range under consideration.
Three features (the Na I line in the K-band, the Si I features in the H- and J-band and the Fe I feature in the J-band) are consistently weaker in all the templates than in Cen X-4. This might represent abundance mismatch between the donor in Cen X-4 and the templates akin to the mismatch seen in the Mg I feature in V404 Cyg. FS has noted that the temperature and luminosity variations of Ca I, Na I and Fe I features in the K-band are primarily governed by a blend of those species with Sc I, Ti I and V I which could explain why it is challenging to self-consistently match templates to these features. (A similar problem was encountered in K-band fits to the spectrum of A0620-00; Froning et al. 2007.) These features cannot be eliminated from the final donor fraction calculation, however. Owing to the presence of only a couple of these species in the entire spectrum, it is not possible to make a decisive statement about abundance mismatch for specific elements. Other notable features are the 12CO features in the K-band and in the H-band, which in other X-ray binaries such as A0620-00 have been anomalously weak. The CO feature in the K-band is much weaker in the template for a K5 V and a K7 V compared to Cen X-4, but all of the spectral types give consistent results of for the H-band feature. A better S/N spectrum of Cen X-4 is required to make a conclusive argument about this discrepancy especially as the S/N deteriorates sharply in the long K region where the CO bandheads occur.
We determined the final donor fraction by averaging over all the individual selected features from Table 6 for all three of the spectral type templates from K5 – M0 V. We obtain a mean donor fraction of in the H-band and obtain in K. Thus, the accretion disk can contribute up to 10% in the K-band. If a K5 V were to be excluded from the donor spectral type (based on its weak K-band features), we find a disk contribution of up to 17% in K. This is consistent with the H -band fraction of 0.94, which would imply a 6 – 10% dilution in K (depending on the template spectral type). The H-band donor fraction contribution of remains the same whether the K5V star is included or not. Since the mass of the NS in Cen X-4 will be obtained from the H-band light curve data of Shahbaz et al. (1993), the inclusion or exclusion of a K5 V star will not affect the final mass. Figure 15 and 16 shows a comparison of the spectrum of Cen X-4 in the H- and K-band respectively, after scaling a K7 V and an M0 V template by a donor fraction of .94 and 1.0 respectively.
4 Discussion
4.1 V404 Cyg
4.1.1 Accretion disk contamination and mass of the black hole in V404 Cyg
Previous estimates have given K0 IV as the donor type in V404 Cyg (Casares & Charles, 1994). Our high S/N NIR spectrum shows strong 12CO and 13CO features that point to a more evolved star. By comparing the spectral energy distribution with various field stars, EW diagnostics and dilution analysis, we found that a K3 III star is the best match to the donor star of V404 Cyg with minimal accretion disk contribution. From a comparison of the spectrum of V404 Cyg with a scaled K3 III star, one can appreciate the close qualitative match in the two spectra. In the K-band, the CO bands and most metals are consistent with the K3 III spectral type but Mg I appears supersolar in both the H- and K-bands. Unlike other compact binaries like A0620-00 (Froning et al., 2007), XTE J1118+480 (Haswell et al., 2002) and some cataclysmic variables (Harrison et al., 2000, 2004) that show weak CO bandheads and depleted carbon abundances, the CO bandheads in V404 Cyg are consistent with the solar abundance K3III template spectrum.
Sanwal et al. (1996) obtained an H-band light curve of V404 Cyg. We retrieved their data from their Table 2 and remodeled the light curve taking into account the (small) dilution of the donor star flux. The light curve modeling program is the same as used for A0620-00 (Froning & Robinson, 2001). The parameters used for the model are Teff=4300 K, a gravity darkening exponent of 0.08 (Lucy, 1967) and a limb darkening coefficient from Claret & Gimenez (1995) for a value suitable for a K3 III star (Berdyugina & Savanov, 1994; Cayrel De Strobel et al., 1980). For the error bars on the light curve, we used the scatter on the reference field star observed by Sanwal et al. (1996) (.02 mag) and equally weighted the points. For a mass ratio of q = 0.060 and (Casares & Charles, 1994), the mass of the BH can be written to one unknown as MBH = () , where is the inclination of the binary. We varied the donor fraction from .93 – 1.00 and obtained a best fit ( = 3.3) to the H-band light curve data for an inclination of where the uncertainty in the inclination is propagated from the fractional donor star contribution. Figure 17 shows the best fit light curve of V404 Cyg obtained for and . The uncertainty was dominated by the change in the donor fraction. Accordingly, we obtained the mass of the black hole in V404 Cyg as for .
It has been shown in Cantrell et al. (2008, 2010) that fitting ellipsoidal models to the light curves of A0620-00 in its passive state increases the binary inclination considerably and results in reduced mass of the black hole than previous studies. The variability in the light curve shape (which can change from night to night) has been attributed to the disk component. Since V404 Cyg has a high S/N, we tested the stability of the donor fraction from the spectrum obtained for each individual night and found it to be fairly constant for each night. V404 Cyg exhibits fast strong variability which is likely produced by the disk (Sanwal et al., 1996). To test what effect that would have on the inclination and the black hole mass, we picked points from the lower envelope of their light curve data in Figure 1 by eye. We found a best fit for an inclination of which translates to a reduction of black hole mass by about 1M⊙ which is still in agreement with Sanwal et al. (1996).
Shahbaz et al. (1996) obtained a 100 contribution of the donor star to the infrared flux in the K-band which implies a binary inclination of . Despite our comparable result for the minimal accretion disk contribution, their inclination does not agree with our value within the error bars. They used the light curve from Shahbaz et al. (1994) to determine the inclination. Sanwal et al. (1996) recalculated their K-band model light curve by equally weighing each night of data and obtained a significant improvement on the variance of the model light curve. From Figure 2 of Sanwal et al. (1996), for a mass ratio of q=.07, the absolute lower limit to the inclination corresponds to 60∘. They established an upper limit of 12.5M⊙ for the mass of the black hole in V404 Cyg and our result is consistent with their limits with respect to both the inclination and the BH mass.
4.1.2 Accretion disk contamination and Mass of the neutron star in Cen X-4
From a comparison of the spectrum of Cen X-4 to those of various field dwarfs, we found that the donor star in Cen X-4 is probably not the only source of NIR flux. We found that in the H-band, a fraction, , of the NIR flux comes from the donor star while in the K-band this fraction is . Earlier estimates for the donor type in Cen X-4 include a K7 V star (Shahbaz et al., 1993) , a K3 V–K5V star (Torres et al., 2002) and a K3 V–K5 V star (D’Avanzo et al., 2005). We have estimated the donor type in Cen X-4 to lie between a K5 V and an M1 V. If the donor star is a K5 or K7V, there must be at least 5 – 15% K-band dilution to reconcile the NIR spectral energy distribution in Cen X-4 with the template SED. A later type donor star of M0V or M1V requires only a few percent dilution in K to match the broadband SED. Higher signal to noise data is required to constrain the donor spectral type even further.
We use the orbital parameters from Casares et al. (2007) and determine the mass function is found to be . Using this value of the mass function and the binary mass ratio, , the mass of the neutron star in Cen X-4 can be written upto one uknown as (0.28.01) .
For modeling purposes, we chose K for a K7 V. We chose a value of =4.5 appropriate for a K7 V star to obtain the corresponding limb darkening coefficients (Claret & Gimenez, 1995). We also chose a value of 0.08 for the gravity darkening coefficient assuming that the donor has a convective envelope (Lucy, 1967; Sarna, 1989).
The flux from the accretion disk will reduce the apparent amplitude of the ellipsoidal modulations which in turn will underestimate the binary inclination and overestimate the mass of the neutron star. We determined that the contamination from the accretion disk could be up to 20% in H. We can make an initial estimate of the mass of the neutron star in Cen X-4 by combining our dilution estimate with the H-band light curve observations of Shahbaz et al. We read in their light curve data from their Figure 1. Their data points include uncertainties in both magnitude and orbital phase, which was derived from how they binned their data (rescaling their errors in each phase bin to get = 1 and then averaging the points). We could not read these values off their graph, so we assumed an equal weighting on each point using the 0.006 mag error for their reference star measurement.
In order to take into account the uncertainties in the orbital phase by Shahbaz et al. (1993), we varied the donor fraction in Cen X-4 from 0.80 1.00 along with a phase-offset that gave the lowest for a certain inclination. We obtained an inclination of for the binary from which we obtained the mass of the neutron star as . Figure 18 shows the best fit ( = 9.57) to the H-band light curve (dashed line) of Cen X-4 for q = 0.20 and i= 36∘ for a phase-offset of .03, after it was modeled with a K7 V donor plus 6% constant dilution contribution. The solid line represents the best fit for no phase-offset ( = 12.2). Note, however, that the uncertainty on our final result only reflects the uncertainty in varying the donor star fraction. It does not include the uncertainty in the light curve measurements. As a result, our derived neutron star mass and uncertainty should be viewed with some caution.
With that caveat, the value we find is consistent with past estimates found by Casares et al. (2007), Torres et al. (2002), D’Avanzo et al. (2005) and Shahbaz et al. (1993). To include the spectral types between M0 V – K5 V we varied the temperature, Teff from 3700 K to 4500 K, and found that the inclination changes by . We obtain the same variation in the inclination if we use =4.0 if the donor in Cen X-4 were to be a sub-giant. The mass ratio value also has a negligible effect on the inclination. Upon varying the mass ratio within its uncertainties (0.200.03), we found the inclination to change by less than a degree. The biggest uncertainty comes from varying the donor fraction compared to any other parameters.
Both Chevalier et al. (1989) and Shahbaz et al. (1993) have argued that the donor in Cen X-4 is more likely a subgiant than a dwarf. They pointed out that based on the orbital period alone, if the donor were to be a main sequence star, it would underfill the Roche-lobe by a factor of 2. The CO bands would provide the best tracer of whether the donor star is evolved. We could not test this hypothesis here, both because of the relatively poor data quality in the long wavelength end of the K-band where the strongest CO bandheads occur and because of the dearth of subgiant stars in the IRTF spectral library. Hence, the possibility that the donor in Cen X-4 could be a subgiant (later than K1 IV) remains open at this point .
It has been seen that pulsar masses are typically higher ( 1.50 M⊙) in neutron star–white dwarf systems than in neutron star–neutron star systems and this is attributed to higher accretion in these systems (Nice et al., 2008). It has been pointed out by Shahbaz et al. (1993) that either the neutron star (NS) in Cen X-4 was formed as it reached the end of nuclear evolution in the progenitor’s core or it could have collapsed to form a neutron star by gradual accretion on to a dwarf with electron degenerate core. In the latter case, mass of the neutron star could be higher than typical neutron star masses as they can accrete up to several tenths of solar mass during their lifetimes (Casares, 2006; Bhattacharya & van dan Heuvel, 1991). Our value of the mass of the neutron star in Cen X-4 exhibits a range with the most probable value of 1.5. The error on the mass needs to be constrained further in order to realize whether Cen X-4 could be a potential system for understanding nuclear matter and ruling out different equations of state similar to the neutron star LMXB candidate, Cyg X-2 (Casares et al., 1998).
In the analysis done for both V404 Cyg and Cen X-4, there are areas that contribute to systematic uncertainties which may not be accounted for in our final uncertainties. One of these is using a field star to duplicate the Roche-lobe filling donor stars. In V404 Cyg, we found that a K3 III field star with near-solar abundance matched the donor of V404 Cyg quite well except for the Mg I lines. For Cen X-4, we find that after applying the final donor fraction, some of the lines in the template were still weaker than Cen X-4. Using a field dwarf with solar abundances to represent a Roche-lobe filled star in Cen X-4 could be a plausible explanation for this discrepancy, as could minor mismatches between template and donor star in temperature, gravity, or metallicity. We attempted to mitigate this potential error source in Cen X-4 by averaging over fits to multiple lines and multiple spectral types to obtain the fraction and its uncertainty. Fortunately, our results are dominated by the H-band donor fraction where we obtained consistent results for all three template stars.
Previous studies have assumed that the light curve shape is consistent throughout quiescence. However, it has been shown in several systems that this assumption is not valid and will lead to systematic errors in the determination of the compact star masses (Cantrell et al., 2008, 2010). We obtained the spectra of our targets in 2007 whereas the light curve data for V404 Cyg and Cen X-4 were obtained in 1993 and 1990-91 respectively. This wide time gap between obtaining the light curve data and the spectra adds to the uncertainty associated with the mass of the compact objects. In V404 Cyg, the accretion disk contribution is very small and has remained so over multiple observations (Shahbaz et al., 1996; Hynes et al., 2009). Our fractional contribution for the donor star agrees with the value obtained by Shahbaz et al. (1996) within their statistical uncertainties implying that the small disk contamination in the K-band has changed negligibly in the time gap between the two observations. For Cen X-4, we do not have as much information about the long-term variability of the system. However, the uncertainty on our donor star fraction ( in H) and resulting uncertainty on the neutron star mass is broad enough to span the observed range of variability in the system. We also note that the 1.5 result is consistent with the masses measured in other NS LMXBs. Contemporaneous light curve and spectral data are recommended to obtain a definitive NS mass in Cen X-4.
5 Conclusion
We have obtained broadband near infrared spectroscopy of V404 Cyg and Cen X-4 in order to directly evaluate the relative contributions in the infrared light due to the donor star and the accretion disk and determine precise compact star masses. We determined the spectral type of the donor star in V404 Cyg to be a K3 III. We performed dilution analysis based on individual prominent metal lines and groups of lines and determined the donor star fraction to be in the H-band and in the K-band. With previous light curve data in the H-band, we obtained the inclination of the binary as and a mass for the BH of M⊙ . In Cen X-4 we performed a similar analysis but restricted our fits to the strongest absorption lines due to the lower S/N of the spectrum. We determined the spectral type of the donor star to lie within the range K5 – M1 V but could not constrain it further. The dilution fraction was determined to be in the H-band and in the K-band. From past H-band data we modeled the light curve with a donor star plus a constant flux from the accretion disk and determined the mass of the neutron star in Cen X-4 as which agrees well with past estimates. These mass measurements should be viewed with some caution however, since contemporaneous light curve and spectral data are required to obtain definitive masses.
References
- Ali et al. (1995) Ali, B.,Carr J.S., Depoy D.L., Frogel J. A. Sellgren K.,1995, AJ, 110, 2415
- Bailyn et al. (1998) Bailyn, C.D., Jain, R.K., Coppi, P. Orosz, J. A., 1998, ApJ, 499,367
- Belczynski et al. (2008) Belczynski, K., Kalogera, V., Rasio, F. A., Taam, R. E., Zezas, A., Bulik, T., Maccarone, T. J., Ivanova, N., 2008, ApJS, 174, 223
- Berdyugina & Savanov (1994) Berdyugina, S.V. & Savanov, I.S., 1994, AstL, 20, 755
- Bhattacharya & van dan Heuvel (1991) Bhattacharya, D., van den Heuvel, E. P. J., 1991, Phys. Rep., 203, 1
- Blair et al. (1984) Blair, W. P., Raymond, J. C., Dupree, A. K., Wu, C.-C., Holm, A. V. & Swank, J. H, 1984, ApJ, 278, 270
- Brown et al., (1998) Brown, E.F., Bildsten, L. Rutledge, R.E., 1998, ApJ, 504, L95
- Canizares et al. (1980) Canizares, C.R., McClintock, J.E. & Grindlay, J.E., 1980, Astro-phys. J. Letters, 236, L55
- Cantrell et al. (2008) Cantrell, A. G., Bailyn, C. D., McClintock, J. E., Orosz, J. A., 2008, ApJ, 673, L159
- Cantrell et al. (2010) Cantrell, A. G., Bailyn, C. D., Orosz, J. A., McClintock, J. E., Remillard, R. A., Froning, C. S., Neilsen, J., Gelino, D. M. & Gou, L., 2010, ApJ, 710, 1127
- Casares et al. (2007) Casares, J., Bonifacio, P., Gonz lez Hern ndez, J. I., Molaro, P. & Zoccali, M., 2007, A&A, 470, 1033
- Casares (2006) Casares J., in The Many Scales in the Universe: JENAM 2004 Astrophysics Reviews ed Del. Toro Iniesta et al., (Springer: Dordrecht), p. 145
- Casares et al. (1998) Casares, J., Charles, P. A. & Kuulkers, E., 1998, ApJ, 493, L39
- Casares et al. (1992) Casares, J., Charles, P.A. & Naylor, T., 1992, Nature, 355, 614
- Casares & Charles (1994) Casares, J. & Charles, P.A., 1994, MNRAS, 271, L5
- Cayrel De Strobel et al. (1980) Cayrel De Strobel, G., Bentolila, C., Hauck, B. & Curchod, A., 1980, A&AS, 41, 405
- Charles & Coe (2006) Charles, P.A. & Coe, M.J. 2006, in: W.H.G. Lewin & M. van der Klis (eds.), Compact Stellar X-ray Sources, Cambridge Astrophysics Series No. 39 (Cambridge: Cambridge University Press)
- Chevalier et al. (1989) Chevalier, C., Ilovaisky, S. A., van Paradijs, J., Padersen, H. & van der Klis, M., 1989, A&A, 210, 114
- Claret & Gimenez (1995) Claret, A. & Gimenez, A., 1995, A&AS, 114, 549
- Conner et al. (1969) Connor, J.P., Evans, W.D. & Belian, R.D., 1969, ApJ, 157, L157
- Cowley et al. (1987) Cowley, A.P., Hutchings, J.B., Schmidtke, P.C., Hartwick, F.D.A., Crampton, D. & Thomson, I.B., 1987, AJ, 95, 1231
- Cushing et al. (2004) Cushing, M.C., Vacca, W.D. & Rayner, J.T., 2004, PASP, 116, 362
- D’Avanzo et al. (2005) D’Avanzo, P., Campana, S., Casares, J., Israel, G. L., Covino, S., Charles, P. A. & Stella, L., 2005, A&A, 444, 905
- Eggleton (1983) Eggleton, P.P., 1983, ApJ, 268, 368
- Förster Schreiber (2000) Förster Schreiber, N. M., 2000, AJ, 120, 2029
- Froning et al. (2007) Froning, C.S, Robinson, E.L. & Bitner, M.A., 2007, ApJ, 663,1215
- Froning & Robinson (2001) Froning, C.S. & Robinson, E.L., 2001, AJ, 121, 2212
- Fryer & Kalogera (2001) Fryer, C.L. & Kalogera, V., 2001, ApJ, 554, 548
- Gelino & Harrison (2003) Gelino, D. M., Harrison, T. E., 2003, ApJ, 599, 1254
- Gonzalez Hernandez et al. (2005) Gonzalez Hernandez, J.I., Rebolo, R., Israelian, G., & Casares, J., 2005, ApJ, 630, 495
- Hameury et al. (1986) Hameury, J.M., King, A.R.& Lasota, J.P., 1986, A&A, 162, 71
- Harrison et al. (2000) Harrison, T.E., McNamara, B.J., Szkody, P., & Gililand, R.L. 2000, AJ, 120, 2649
- Harrison et al. (2004) Harrison, T.E., Osborne, H.L., Howell, S.B. 2004, AJ, 127, 3493
- Haswell et al. (2002) Haswell, C.A., Hynes, R.I., King, A.R., Schenker, K., 2002, MNRAS, 332, 928
- Hynes et al. (2009) Hynes, R. I., Bradley, C. K., Rupen, M., Gallo, E., Fender, R. P., Casares, J. & Zurita, C., 2009, MNRAS, 399, 2239
- King (1993) King, A.R., 1993, MNRAS, 260, L5
- Kirkpatrick et al. (1993) Kirkpatrick, J. D.,Kelly, D. M., Rieke, G. H., Liebert, J., Allard, F. & Wehrse, R., 1993, ApJ, 402, 643
- Kleinmann & Hall (1986) Kleinmann, S.G. & Hall, D.N.B., 1986, ApJS, 62, 501
- Lewin & van der Klis (2006) ————-. 2006, in Compact Stellar X-ray Sources, ed. Lewin, W. and van der Klis, M., (Cambridge : Cambridge University Press)
- Lucy (1967) Lucy, L. B., 1967, ZAp, 65, 89
- Makino (1989) Makino, F., 1989, IAU Circ. 4782
- Marsden (1989) Marsden, B.G., 1989,IAU Circ. 4783
- Matsuoka et al (1980) Matsuoka, M., Inoue, H., the Hakucho team:1980, Astrophys. J. Letters, 240, L137
- McClintock & Remillard (1990) McClintock, J.E.& Remillard, R.A., 1990, ApJ, 350,386
- Meyer et al. (1998) Meyer, M. R., Edwards, S., Hinkle, K. H. & Strom, S. E., 1998, ApJ, 508, 397
- Miller-Jones et al. (2009) Miller-Jones, J. C. A., Jonker, P. G., Dhawan, V., Brisken, W., Rupen, M. P., Nelemans, G., Gallo, E., 2009, Astro-phys. J. Letters, 706, L230
- Nelemans & van dan Heuval, (2001) Nelelmans, G. & van dan Heuval, E.P.J., 2001, A&A, 376, 950
- Nice et al. (2008) Nice, D. J., Stairs, I. H. & Kasian, L. E, 2008, in AIP Conf. Proceed., 40 YEARS OF PULSARS: Millisecond Pulsars, Magnetars and More, 983, 453
- Podsiadlowski (1991) Podsiadlowski, Ph., 1991, New A, 350, 136
- Rayner et al. (2009) Rayner, J. T., Cushing, M. C. & Vacca, W. D., 2009, ApJS, in press
- Rayner et al. (2003) Rayner, J. T., Toomey, D. W., Onaka, P. M., Denault, A. J., Stahlberger, W. E., Vacca, W. D., Cushing, M. C. & Wang, S., 2003, PASP, 115,362
- Sanwal et al. (1996) Sanwal, D., Robinson, E. L., Zhang, E., Colome, C., Harvey, P. M., Ramseyer, T. F., Hellier, C. & Wood, J. H. 1996, ApJ, 460, 437
- Sarna (1989) Sarna, M.J., 1989, A&A, 224, 98
- Shahbaz et al. (1993) Shahbaz, T., Naylor, T. & Charles P.A., 1993, MNRAS, 265, 655
- Shahbaz et al. (1996) Shahbaz, T., Bandopadhyay, R., Charles, P.A. & Naylor,, T., 1996, MNRAS, 282, 977
- Shahbaz et al. (1994) Shahbaz, T., Ringwald, F. A., Bunn, J. C., Naylor, T., Charles, P. A. & Casares, J., 1994, MNRAS, 271, L10
- Torres et al. (2002) Torres, M.A.P., Casares, J., Martinez-Pais, I.G. & Charles, P.A., 2002, MNRAS, 334,240
- Vacca et al. (2003) Vacca, W.D., Cushing, M.C. & Rayner, J.T., 2003,PASP,115, 389
- Van Paradijs et al. (1987) van Paradijs, J., Verbunt, F., Shafer, R. A. & Arnaud, K. A., 1987, A&A182, 47
- Wagner et al. (1992) Wagner, I.M., Kreidl, T.J., Howell, S.B. & Starfield, S.G., 1992, ApJ, 401, L97
- Wallace & Hinkle (1997) Wallace, L. & Hinkle, K., 1997, ApJS, 111,445
- Wallace et al. (2000) Wallace, L., Meyer, M.R., Hinkle, K. & Edwards, S., 2000, ApJ, 535,325
| Object | Date | Exposure time(min) | Orbital Phase |
|---|---|---|---|
| 06/07/07 | 100 | 0.59-0.61 | |
| 06/08/07 | 190 | 0.74-0.76 | |
| 06/09/07 | 150 | 0.89-0.91 | |
| 06/07/07 | 100 | 0.80-0.92 | |
| 06/08/07 | 30 | —– | |
| 06/09/07 | 110 | 0.97-0.05 |
| Feature | Symbol | Integration limits | Equivalent width() |
|---|---|---|---|
| 1.5870-1.5910 | 3.36 0.07 | ||
| 1.6175-1.6220 | 4.10 0.08 | ||
| 2.2053-2.2101 | 2.03 0.10 | ||
| 2.2248-2.2293 | 1.22 0.74 | ||
| 2.2367-2.2402 | 0.76 0.12 | ||
| 2.2611-2.2662 | 2.06 0.23 | ||
| 2.2788-2.2840 | 1.18 0.18 | ||
| 2.2924-2.2977 | 9.11 0.76 | ||
| 2.3218-2.3272 | 9.15 0.28 | ||
| 2.3436-2.3491 | 3.30 0.56 |
Note. — The equivalent widths were calculated using the integration limits from Förster Schreiber (2000). The error bar on the measurements are based on continuum placement uncertainties.
| Band | Wavelength range(m) | Feature | (K2 III) | (K3 III) | (K4 III) | |||
|---|---|---|---|---|---|---|---|---|
| entire K-band | 1.05 | 8.90 | 0.95 | 5.83 | 0.84 | 8.79 | ||
| Ca I | 1.36 | 2.55 | 1.07 | 4.50 | 1.18 | 9.53 | ||
| Al I | 1.50 | 0.20 | 1.05 | 0.52 | 1.57 | 0 .35 | ||
| Na I | 1.50 | 0.24 | 0.94 | 0.15 | 1.07 | 0.23 | ||
| Ca I | 1.24 | 0.21 | 0.85 | 0.15 | 0.98 | 0.26 | ||
| Mg I | 1.60 | 0.89 | 1.25 | 0.87 | 1.87 | 0.73 | ||
| CO bands | 1.05 | 13.0 | 0.95 | 6.70 | 0.87 | 17.80 | ||
| entire H-band | 1.33 | 21.2 | 1.09 | 13.42 | 1.05 | 18.76 | ||
| Mg I | 1.53 | 3.57 | 1.19 | 4.34 | 1.40 | 5.96 | ||
| Mg I | 1.43 | 7.00 | 1.15 | 4.99 | 1.19 | 6.78 | ||
| Si I | 1.07 | 3.70 | 0.94 | 2.44 | 0.98 | 2.50 | ||
| CO bands | 1.24 | 10.5 | 0.98 | 6.33 | 0.95 | 9.00 | ||
| Al I | 1.32 | 3.77 | 1.03 | 2.14 | 1.17 | 1.85 | ||
| Mg I | 1.56 | 4.00 | 1.18 | 5.57 | 0.98 | 5.00 | ||
| Mg I | 1.02 | 1.27 | 0.91 | 0.51 | 0.95 | 1.05 | ||
| Ca I | 1.03 | 1.71 | 0.89 | 1.62 | 0.93 | 2.15 | ||
| Fe I | 1.11 | 0.08 | 0.83 | 0.10 | 1.09 | 0.12 | ||
| K I | 1.23 | 0.04 | 0.96 | 0.07 | 1.11 | 0.08 | ||
| Mg I | 1.33 | 0.19 | 1.12 | 0.09 | 1.24 | 0.05 | ||
| Fe I | 1.08 | 0.09 | 0.85 | 0.02 | 0.90 | 0.03 | ||
| Si I | 1.23 | 0.04 | 1.05 | 0.02 | 1.17 | 0.03 | ||
| Ti I | 1.59 | 0.23 | 1.38 | 0.21 | 1.59 | 0.40 | ||
| Mn I | 0.99 | 0.05 | 0.88 | 0.02 | 0.95 | 0.03 | ||
| Al I | 1.23 | 0.15 | 1.09 | 0.10 | 1.16 | 0.08 |
| Feature | Symbol | Integration limits | Equivalent width() |
|---|---|---|---|
| 1.5870-1.5910 | 3.08 0.41 | ||
| 1.6175-1.6220 | 1.90 0.13 | ||
| 2.2053-2.2101 | 2.56 0.21 | ||
| 2.2248-2.2293 | 2.25 0.36 | ||
| 2.2367-2.2402 | 0.51 0.38 | ||
| 2.2611-2.2662 | 3.30 0.55 | ||
| 2.2788-2.2840 | 0.89 0.48 | ||
| 2.2924-2.2977 | 4.50 0.44 | ||
| 2.3218-2.3272 | 3.01 0.43 | ||
| 2.3436-2.3491 | 1.0 0.59 |
Note. — The equivalent widths were calculated using the integration limits from Förster Schreiber (2000). The error bar on the measurements are based on continuum placement uncertainties.
| Feature | Symbol | Integration limits | Equivalent width() |
|---|---|---|---|
| 2.204-2.211 | 3.33 0.33 | ||
| 2.258-2.269 | 5.89 1.23 | ||
| 2.279-2.285 | 1.65 0.57 | ||
| 2.289-2.302 | 5.27 1.09 |
Note. — The equivalent widths were calculated using the integration limits from Ali,1995. The error bar on the measurements are based on continuum placement uncertainties.
| Band | Feature | Wavelength range(m) | (K5 V) | (K7 V) | (M0 V) | |||
|---|---|---|---|---|---|---|---|---|
| K-band | 1.00 | 6.76 | 0.90 | 7.40 | 0.93 | 6.76 | ||
| Ca I | 1.20 | 2.62 | 0.85 | 3.72 | 0.73 | 3.83 | ||
| Na I | 1.48 | 1.39 | 1.25 | 1.05 | 1.15 | 1.15 | ||
| Ca I | 1.15 | 0.95 | 0.98 | 1.16 | 0.95 | 1.17 | ||
| 12CO | 1.20 | 1.38 | 1.12 | 1.60 | 1.00 | 1.67 | ||
| H-band | 0.89 | 2.56 | 0.93 | 2.75 | 0.92 | 2.76 | ||
| Mg I | 0.93 | 1.24 | 0.97 | 1.07 | 0.98 | 1.20 | ||
| Mg I | 0.95 | 0.90 | 1.04 | 1.02 | 0.98 | 0.85 | ||
| Si I | 1.10 | 1.37 | 1.15 | 1.60 | 1.22 | 1.33 | ||
| 12CO | 0.93 | 1.02 | 0.93 | 0.96 | 0.92 | 1.20 | ||
| Al I | 0.88 | 2.46 | 0.93 | 2.59 | 0.90 | 2.54 | ||
| Mg I | 0.71 | 2.25 | 0.71 | 2.21 | 0.68 | 2.12 | ||
| Mg I | 0.92 | 0.70 | 1.03 | 0.56 | 1.06 | 0.72 | ||
| Fe I | 1.26 | 1.01 | 1.15 | 1.02 | 1.23 | 1.06 | ||
| Si I | 1.38 | 0.88 | 1.71 | 1.06 | 1.82 | 1.28 | ||
| Al I | 0.86 | 1.55 | 0.86 | 1.92 | 0.80 | 0.93 |