The incidence of cool gas in halos1
Abstract
We present the first results of an ongoing spectroscopic follow-up of close luminous red galaxy (LRGs) and Mg II 2796,2803 absorber pairs for an initial sample of 15 photometrically selected LRGs at physical projected separations from a QSO sightline. Our moderate-resolution spectra confirm a physical association between the cool gas ( K) revealed by the presence of Mg II absorption features and the LRG halo in five cases. In addition, we report an empirical estimate of the maximum covering fraction () of cool gas in massive, dark matter halos hosting LRGs at . This study is performed using a sample of foreground LRGs that are located at from a QSO sightline. The LRGs are selected to have a robust photometric redshift . We determine based on the incidence of Mg II absorption systems that occur within in the spectra of the background QSOs. Despite the large uncertainties in , this experiment provides a conservative upper limit to the covering fraction of cool gas in the halos of LRGs. We find that at Å and at Å, averaged over 400 radius. Our study shows that while cool gas is present in halos, the mean covering fraction of strong absorbers is no more than 7%.
Subject headings:
Quasars:absorption lines — Cosmology:dark matter — galaxies:evolution1. Introduction
A detailed description of how galaxies acquire their gas is essential to establish a comprehensive theory of galaxy evolution. Analytical calculations and hydrodynamical simulations have shown that the gas in M⊙ halos111 We define a halo as a region of overdensity 200 with respect to the mean mass density of the universe., is heated to high temperature by virial shocks (e.g., Birnboim & Dekel 2003; Kereš et al. 2005; Dekel & Birnboim 2006; Kereš et al. 2009). Within the hot gas halo, thermal instabilities can induce the formation of pressure-supported clouds of cool gas (e.g., Mo & Miralda-Escude 1996; Maller & Bullock 2004). Such clouds have been resolved in high-resolution hydrodynamic simulations of Milky-Way type dark matter halos (e.g., Kauffmann et al. 2008; Kereš & Hernquist 2009). These clouds bring some baryonic material into the galaxy, but the overall cooling rate is reduced because the hot phase has lower density. Whether or not these clouds can form and survive in more massive halos is an open question.
Our empirical knowledge of the cool gas content of dark matter halos has been shaped primarily by H I 21-cm observations of local galaxies (e.g., Thilker et al. 2004; Doyle et al. 2005; Verdes-Montenegro et al. 2001, 2007). At , we rely on intervening systems detected along the sightlines to background QSOs to describe the gas content of dark matter halos. (e.g., Lanzetta & Bowen 1990; Steidel et al. 1994; Chen et al. 2001; Chen & Tinker 2008). A number of studies have used the Mg II 2796,2803 absorption doublets to trace cool, K, gas and its physical association with foreground galaxies located near QSO sightlines (e.g., Tripp & Bowen 2005; Kacprzak et al. 2008; Chen & Tinker 2008). Insights into the cool gas content of dark matter halos can also be obtained by measuring the large-scale clustering amplitude of Mg II systems (Bouché et al., 2006; Tinker & Chen, 2008, 2010).
In Gauthier et al. (2009), we calculated the clustering amplitude of strong Mg II absorbers (with rest-frame absorption equivalent width Å) using luminous red galaxies (LRGs) at . LRGs are old and passive galaxies (Eisenstein et al., 2001) residing in halos. (e.g., Zheng et al. 2008; Blake et al. 2008; Padmanabhan et al. 2008; Gauthier et al. 2009). They are identified using photometric redshift techniques that offer a typical redshift accuracy of at (Collister et al., 2007).
An interesting result from Gauthier et al. (2009) is that the LRG-Mg II cross-correlation signal is comparable to the LRG auto-correlation on small scales ( co-moving ) that are well within the virial radii of the halos. The results suggest the presence of cool gas inside the dark matter halos of LRGs.
Here we report the first results of an ongoing spectroscopic follow-up of the close LRG–Mg II pairs found in Gauthier et al. (2009). In five of the 15 cases, the precise spectroscopic redshifts establish a physical connection between these LRG–Mg II pairs. The spectroscopic study of LRGs is supplemented with a survey of Mg II absorbers in the vicinity of photometrically identified LRGs in the SDSS data archive. This survey allows us to utilize the vast survey data available in the SDSS archive to derive additional constraints on the covering fraction of cool gas in halos. We adopt a cosmology with and , and a dimensionless Hubble parameter throughout the paper. All distances are in physical units unless otherwise stated.
2. Experiments
To examine the cool gas content in massive halos, we have designed two experiments. The first one is a spectroscopic follow-up study of photometrically identified LRGs located near Mg II absorbers (Sample A below). The spectroscopic observations allow us to identify physically associated LRG–Mg II absorber pairs for interpreting the small-scale clustering signal seen in Gauthier et al. (2009). In addition, the optical spectra offer additional knowledge for the stellar and ISM properties of the LRGs. The second experiment is a survey of Mg II absorbers in the vicinity of photometrically identified LRGs (Sample B below). This study allows us to make use of the vast amount of galaxy and QSO survey data already available in the SDSS archive and derive statistically significant constraints for the covering fraction of cool gas around LRGs.
2.1. Sample A – LRGs in the vicinity of known Mg II absorbers
The purpose of the spectroscopic study of LRGs is to establish a physical association between the cool gas traced by the Mg II absorbers and the dark matter halos of the LRGs. The LRGs are selected based on the photometric redshifts and typical photometric redshift uncertainties for these galaxies is for (Collister et al., 2007). The identification of physical pairs requires precise spectroscopic redshifts for the galaxies.
To achieve this goal, we established a catalog of close Mg II-LRG pairs for follow-up spectroscopy by cross-correlating the Prochter et al. (2006) Mg II absorber catalog with the Collister et al. (2007) MegaZ-LRG sample. The Mg II catalog is an extension of the SDSS DR3 sample to include DR5 QSO spectra. This sample of MgII absorbers has a 95% completeness for absorbers of Å . The catalog contains 11,254 absorbers detected at along 9,774 QSO sightlines. We excluded absorbers within 10,000 from the QSO redshift to avoid associated absorbers of the QSO. We excluded absorbers with 0.4 or to match the redshift interval of the LRGs. A total of 2461 Mg II absorbers satisfied our selection criteria.
The MegaZ-LRG catalog is a photometric redshift catalog of approximately LRGs found in the SDSS DR4 imaging footprint. The catalog covers more than 5,000 deg2 in the redshift range . When cross-correlating the two catalogs, we rejected LRGs located within the photometric redshift uncertainty from the QSO redshift. We selected only those LRGs that are in the foreground of the QSO.
We found a total of 646 Mg II-LRG pairs within projected separation 400 (physical) . Note that the sample of 64 close Mg II-LRG pairs with found in Gauthier et al. (2009) is included in this larger sample of 646 pairs. From this sample, we only kept isolated LRGs.222 An isolated LRG is one that does not have a a neighboring LRG within the volume defined by their virial radius and photometric redshift uncertainty. This approach allow us to reduce the ambiguity of attributing the MgII absorber to one or more LRGs. We address possible contamination due to blue satellite galaxies in §5. The treatment of groups is beyond the scope of this letter and will be discussed in a forthcoming paper (Gauthier et al. 2010 in preparation). Our final catalog for follow-up galaxy spectroscopy consisted of 331 ’isolated’ LRGs that are near a known Mg II absorber. We call this sample Sample A.
The primary utility of Sample A was to understand the small-scale clustering signal seen in Gauthier et al. (2009). The sample of spectroscopically confirmed physical LRG–Mg II pairs also allows us (1) to examine possible correlations between the stellar properties of the LRGs and the presence of cool gas at large radii, and (2) to study the kinematics of cool gas in massive halos with follow-up echelle spectroscopy of the absorbers.
2.2. Sample B – random LRGs near QSO sightlines
To derive constraints on the covering fraction of cool gas, we first established a QSO–LRG pair sample by cross-correlating the Schneider et al. (2007) QSO catalog and the MegaZ LRG catalog (Collister et al., 2007)). The Schneider et al. (2007) catalog contains more than 77K QSOs in the SDSS DR5 archive. MegaZ is a photometric redshift catalogue of approximately LRGs in the redshift range 0.4 0.7. The redshift uncertainties are estimated to be .
We considered QSOs that are in the distant background from the LRGs with () in order to exclude correlated QSO–LRG pairs. In addition, we included only QSOs with and at , in order to obtain sensitive limits for and to remove contaminations due to C IV absorption features. Furthermore, we excluded LRGs found in groups of two or more neighbors. Finally, we considered only pairs with at , a maximum separation that is about the expected size of the host dark matter halos. This procedure yielded a total of 620 LRG–QSO pairs. We call this pair sample Sample B. This catalog contains no a priori information about the presence of Mg II absorber in the QSO spectra. It was designed to compute the covering fraction of cool gas in the dark matter halos of LRGs (see the analysis in § 4.2).
3. Observations and Data Reduction
In May 2009, we obtained medium-resolution spectra of three LRGs in Sample A (all within of a known Mg II absorber) using the Double Imaging Spectrograph (DIS) on the 3.5 m telescope at the Apache Point Observatory. The blue and red cameras have a pixel scale of 0.4” and 0.42” per pixel, respectively, on the 3.5 m telescope. We used the B400/R300 grating configuration with a 1.5” slit. The B400 grating in the blue channel has a dispersion of 1.83 Å per pixel and the R300 grating in the red channel has a dispersion of 2.31 Å per pixel. The blue and red channels with the medium resolution gratings together offer contiguous spectral coverage from Å to Å and a spectral resolution of FWHM 500 at = 4400 Å and FWHM 400 at Å .The observations were carried out in a series of two exposures of between 1200 s and 1800 s each, and no dither was applied between individual exposures. Flat-field frames were taken at the end of the night for each night. Calibration frames for wavelength solutions were taken immediately after each science exposure using the truss lamps on the secondary cage. The DIS observations are characterized by a typical seeing of 1.3” (as measured with the slitviewer guide star). Note that we also retrieved the spectrum of one LRG in Sample A (SDSSJ113731.00+060748.6) from the SDSS archive and included it in our spectroscopic studies.
We pursued our spectroscopic observations of LRGs in September 2009 using the Boller & Chivens (B&C) spectrograph on the du Pont 2.5-m telescope at Las Campanas Observatory, Chile. We obtained long-slit medium-resolution spectra for seven additional LRGs in Sample A. In addition, we selected four LRGs from sample B for the spectroscopic B&C observations. The B&C camera has a plate scale of 0.7” per pixel. We used the 300 ln/mm grating with central wavelength of 6500 Å and grating angle of 6 degrees. Since most spectral features of early-type galaxies at are located at Å , we employed the blocking filter GG4495 to block the light blueward of 5000 Å , in order to avoid second-order contamination from the blue part of the spectrum. The slit width for all observations was 1.1”. The adopted grating configuration had a dispersion of 3 Å per pixel and a wavelength coverage of more than 6000Å . For the calibration frames, we followed the methodology employed for the DIS observations. A series of dome and sky flats were taken each afternoon prior to the observations and calibration frames for wavelength solution were taken immediately after each science exposure. The typical seeing measured with the guide star was 1-1.4” during most observations.
All of the DIS and B&C spectroscopic data were reduced using standard long-slit spectral reduction procedures. The spectra were calibrated to vacuum wavelengths, corrected for the heliocentric motion, and flux-calibrated using a spectrophotometric standard. Redshifts of the LRGs were determined based on a cross-correlation analysis using known SDSS templates. The typical redshift uncertainty is .
In summary, the spectroscopic sample consists of 11 galaxies in Sample A and four in Sample B. A journal summarizing the observations of the 15 galaxies can be found in Table 1.
4. Results
4.1. Optical spectra of LRGs
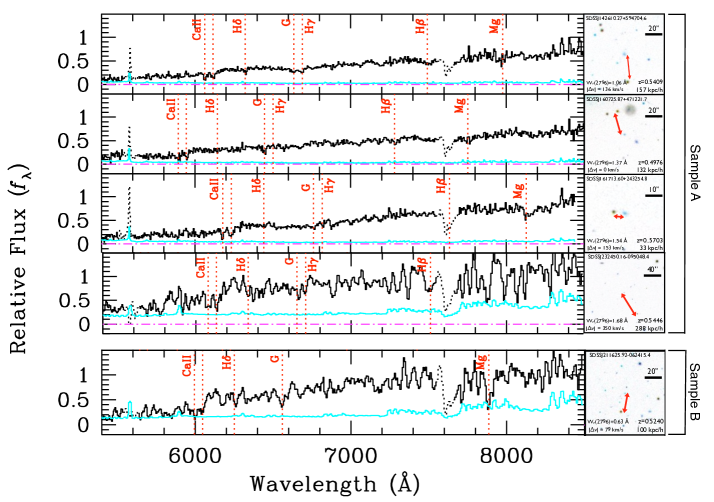
The optical spectra described in § 3 confirmed that five of the LRGs occur within 350 of a Mg II absorber. Four of these LRGs belong to sample A and one to sample B. Figure 1 shows the optical spectra and SDSS images of these five LRGs. The close proximity of these LRGs and Mg II absorber pairs ( 300 and ) strongly argues for a physical association between the galaxy and the absorbing gas. We note that the volume spanned by and is 5 co-moving ()3 at . Within this small volume, we estimate based on the best-fit luminosity functions determined for red galaxies at (; ()-3; see e.g., Brown et al. 2007, 2008) that the probability of the LRG being a random galaxy is negligible.
| ID | RA(J2000) | Dec(J2000) | Instrument | Exptime (sec) | UT date | Sample | ||
|---|---|---|---|---|---|---|---|---|
| SDSSJ003816.29092550.5 | 00:38:16.29 | -09:25:50.5 | 0.51 | 18.70 | B&C | 21800 | 2009-09-21 | B |
| SDSSJ011942.14090225.4 | 01:19:42.14 | -09:02:25.4 | 0.49 | 19.88 | B&C | 32400 | 2009-09-18 | A |
| SDSSJ015452.46095533.6 | 01:54:52.46 | -09:55:33.6 | 0.55 | 19.98 | B&C | 22400 | 2009-09-21 | B |
| SDSSJ021819.25083331.8 | 02:18:19.25 | -08:33:31.8 | 0.56 | 19.46 | B&C | 22400 | 2009-09-19 | A |
| SDSSJ023705.35075513.7 | 02:37:05.35 | -07:55:13.7 | 0.55 | 19.44 | B&C | 1800 900 | 2009-09-21 | B |
| SDSSJ034802.50070339.3 | 03:48:02.50 | -07:03:39.3 | 0.49 | 19.08 | B&C | 22400 | 2009-09-18 | A |
| SDSSJ113731.00060748.6 | 11:37:31.00 | +06:07:48.6 | 0.61 | 18.00 | SDSS | … | … | A |
| SDSSJ142610.27594704.6 | 14:26:10.27 | +59:47:04.6 | 0.48 | 18.69 | DIS | 1800 1500 | 2009-05-26 | A |
| SDSSJ160725.87471221.7 | 16:07:25.87 | +47:12:21.7 | 0.56 | 19.70 | DIS | 21800 | 2009-05-26 | A |
| SDSSJ161713.60243254.8 | 16:17:13.60 | +24:32:54.8 | 0.57 | 19.06 | DIS | 21800 | 2009-05-26 | A |
| SDSSJ204820.88001640.1 | 20:48:20.88 | -00:16:40.1 | 0.45 | 19.47 | B&C | 22400 1800 | 2009-09-19 | A |
| SDSSJ205145.36052121.2 | 20:51:45.36 | -05:21:21.2 | 0.50 | 19.44 | B&C | 22400 | 2009-09-18 | A |
| SDSSJ211625.92062415.4 | 21:16:25.92 | -06:24:15.4 | 0.55 | 19.31 | B&C | 22400 2000 | 2009-09-21 | B |
| SDSSJ212713.92000747.2 | 21:27:13.92 | -00:07:47.2 | 0.47 | 19.19 | B&C | 21800 | 2009-09-20 | A |
| SDSSJ232450.16095048.4 | 23:24:50.16 | -09:50:48.4 | 0.53 | 19.79 | B&C | 22400 | 2009-09-19 | A |
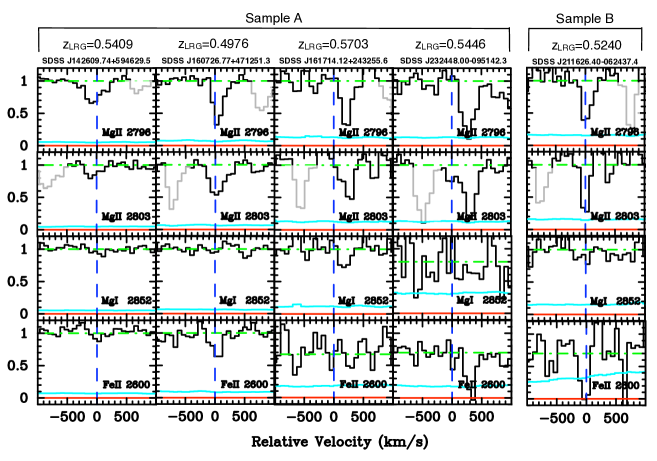
In Figure 2 we present absorption profiles of the Mg II, Mg I and Fe II transitions from the SDSS QSO spectra for these five physical pairs. In each panel, zero velocity corresponds to the spectroscopic redshift of the LRG. All absorbers occur within of the spectroscopically identified LRGs. Although the spectral resolution of SDSS spectra does not allow us to resolve individual components, the panels show that three of the Mg II absorbers have associated Fe II and Mg I absorption features.
All 15 LRG spectra exhibit spectral features dominated by absorption transitions, indicating an old underlying stellar population and little star formation in the recent past. A stellar population synthesis analysis done with the Bruzual & Charlot (2003) spectral library established that the most likely stellar population ages for these LRGs span 1-11.75 Gyr (Gauthier et al. 2010 in preparation).
4.2. Incidence of cool gas in LRG halos
We determined the covering fraction of cool gas in massive halos, based on the presence/absence of Mg II absorbers in the spectrum of the background QSO near the redshifts of the LRGs in Sample B. For each LRG–QSO pair, we visually inspected the QSO spectrum in search of Mg II absorbers in the redshift uncertainty range of the LRG, . For at , this interval corresponds to approximately Å centered at Å . We defined this interval as the search interval, which is large enough to identify all possible Mg II absorbers that may be associated with the LRG. Despite the large redshift uncertainties, however, our search yielded a conservative maximum gas covering fraction of Mg II absorbing gas in LRG halos. If no absorber was visually detected, we measured a 2- upper limit per spectral resolution element, , for the equivalent width of the Mg II transition, using the noise spectrum. For each sightline with a detection, we measured the redshift and strength of the absorber based on a Gaussian profile analysis. For these sightlines, we also determined following the procedure described earlier. Because the varies substantially between QSO spectra, represents the minimum absorption strength that can be recovered in each QSO spectrum. It serves to define a homogeneous sample of QSO spectra that can be adopted to determine the incidence of Mg II absorbers.
To determine the incidence of Mg II absorbers with Å around LRGs, we first identified from the parent LRG–QSO pair sample the QSO spectra that satisfy Å to ensure that the QSO spectra have sufficient for revealing a Mg II absorber of minimum strength . Next, we determined by evaluating the fraction of the QSO spectra that display a Mg II absorber of in the vicinity of the LRGs. We calculate for different values of in different intervals.
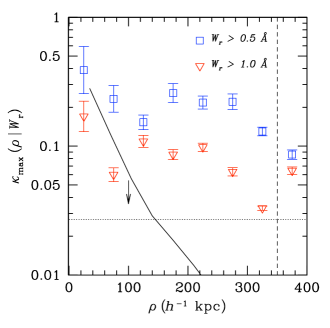
This search allowed us to estimate the maximum possible covering fraction of cool gas based on the incidence of Mg II in LRG halos (see § 5 for a discussion on the contamination rate due to correlated and random galaxies). We first considered the incidence of Mg II absorbers at different absorption threshold . All QSO spectra in the 620 close LRG–QSO pairs have sufficient ( Å) for uncovering an absorber of Å. Our search showed that 45 of the 620 LRGs have a Å absorber at kpc, indicating a mean covering fraction averaged over the entire LRG halos of for Å absorbers. Next, we calculated in different intervals. Figure 3 shows that for Å % at kpc but declines to % at larger (triangles).
Similarly, 575 QSO spectra in the 620 close LRG–QSO pairs have sufficient ( Å) for uncovering an absorber of Å, and 105 of the 575 LRG members have a Å absorber at kpc. The search therefore yielded a mean covering fraction averaged over the entire LRG halos of for absorbers of Å. The estimated versus for Å absorbers are also presented in Figure 3 (squares).
The results at small separations ( ) are consistent with the covering fraction measurements from the spectroscopic Sample B. We found 1/4 LRGs physically associated with the Mg II absorber and all four pairs are within . We are currently increasing the number of spectroscopic pairs from Sample B to obtain a more accurate measurement of .
5. Discussion
Our follow-up spectroscopic study of close LRG–Mg II pairs has confirmed a physical association between the Mg II absorber and the LRG in five of the 15 cases studied. The small velocity separations, and projected distances kpc demonstrate that at least some of the strong Mg II absorbers [ Å] that contributed to the small-scale [ kpc] clustering signal in Gauthier et al. (2009) do indeed originate in the hosting dark matter halos of LRGs. According to a stellar population analysis (using the stellar templates from Bruzual & Charlot 2003) done on the LRG spectra, we found that these galaxies are characterized by a stellar population at least 1Gyr old with a most likely age between 1-11.75 Gyr. The optical spectra are characteristic of an evolved stellar population with little recent star formation.
In addition, our search of Mg II absorption features in the vicinity of LRGs has yielded a conservative estimate of the maximum covering fraction of cool gas in LRG halos. Because of the redshift uncertainties of the LRGs, we cannot distinguish between whether the observed Mg II absorbers are physically associated with the LRG halos or these absorbers occur due to chance coincidence, correlated galaxies, or surrounding satellite galaxies. Despite these various uncertainties, the observed incidence of Mg II absorbers places a strong constraint on the maximum covering fraction of cool gas in massive LRG halos as probed by the Mg II absorbers. We find that the cool gas covering fraction of absorbers with Å in massive LRG halos is no more than 20% and no more than 7% for stronger absorbers Å.
Although to establish a physical association between these close LRG–Mg II absorber pairs requires spectroscopic data of the LRGs, we assess possible contaminations due to surrounding satellite galaxies and background random/correlated absorbers based on theoretical expectations of the satellite population and the mean number density of Mg II absorbers per line of sight observed along random QSO sightlines.
To estimate the incidence of Mg II absorbers due to satellite galaxies in the LRG halos, we first adopt the mass function of subhalos (Equation 10 in Tinker & Wetzel 2009). The mass of subhalos is defined as the mass at the time of accretion—this mass will correlate with the gaseous halo that the subhalo initially had. Next, we adopt the gas radius at Å and the covering fraction within the gas radius as a function of halo mass from Tinker & Chen (2010). The total cross section of subhalos within host halos of mass is then estimated according to
where is the host halo mass (in this case, ), is subhalo mass at time of accretion, is the subhalo mass function from Tinker & Wetzel (2009), is the gas radius for Å and is the covering fraction within the gas radius. Both and are adopted from Tinker & Chen (2010), which are calibrated on data to match the frequency function of absorbers and large scale bias as a function of .
Under the assumption that the gaseous halos of satellite halos are the same as field halos of similar mass, Equation 1 yields a maximal covering fraction of 1.8% at . This is the maximum value because tidal stripping and ram pressure are not taken into account (e.g., Gunn & Gott 1972; Balogh et al. 2000). Equation 1 is also maximal because it assumes that the subhalos have a random distribution within the parent halo. If we further assume that the subhalos follow an NFW profile (Wetzel & White 2009), depends on impact parameter as shown in Figure 4. The satellite contribution is at most comparable to the measurements at , but the satellite covering factor of cool gas is dex below at .
To estimate the incidence of Mg II absorbers due to structure along a line of sight that intersects a large halo, we adopt the observed mean number density of Å absorbers from Nestor et al. (2005) and Prochter et al. (2006). These authors report a number density of per unit redshift interval per line of sight at for Mg II absorbers of Å. Over a redshift interval of , which corresponds to the redshift uncertainty of the LRGs, we therefore expect a background contamination of 0.027 absorbers per line of sight. To estimate the incidence of Mg II absorbers due to correlated large-scale galaxy distribution, we calculate the predicted incidence of correlated halos around the LRGs. We select halos because they are expected to be the dominant contaminant (Tinker & Chen 2008, 2010). First, we adopt Equation (11) in Tinker & Chen (2010) and modify this equation to take into account the correlated structures along the line of sight. We integrate along the line-of-sight distance from to . We repeat the calculation for each projected distance to the LRG and determine the number of halos that could contribute to the signal based on their mass and size. Our calculation indicates roughly 10% enhancement in the background number density of Mg II absorbers per line of sight. We therefore conclude that background random and correlated galaxies would have contributed no more than 3% of the observed Mg II absorbers around the massive LRGs.
Our exercise shows that contaminations due to surrounding satellite galaxies and background random/correlated galaxies are insufficient to account for the observed incidence of Mg II absorbers in the vicinity of LRGs. The maximum covering fraction of strong absorbers is 7% averaged over the entire halo.
Bowen et al. (2006) reported 100% covering fraction of Mg II absorbers within 100 kpc projected distance from four foreground QSO at . The observed large incidence of Mg II absorbers in QSO halos appears to be inconsistent with the low gas covering fraction found in the LRG halos. This discrepancy can be understood by considering the mean mass scales of QSOs and LRGs. Ross et al. (2009) calculated the clustering of SDSS spectroscopic QSOs at . They found that, at , the bias of the dark matter halos traced by QSOs is which is smaller than the bias estimate for the LRGs at the same redshift (; Gauthier et al. 2009). This implies that the typical mass of the dark matter halos hosting QSOs is around M/ 12.3 (see figure 12 in Ross et al. 2009), which is about one dex smaller than what is found for LRGs in Gauthier et al. (2009). The difference in the observed gas covering fraction therefore reflects the differences in the cold gas content of halos on different mass scales (see e.g., Tinker & Chen 2008, Chen et al. 2010 - ApJ submitted).
Recall that Mg II absorbers trace high column density gas of neutral hydrogen column density (Bergeron & Stasińska, 1986; Rao et al., 2006). Furthermore, Rao et al. (2006) have shown that on average 42% of Å Mg II absorbers with associated strong Fe II and Mg I absorption transitions are likely to contain neutral gas of . Two of the Mg II absorbers presented in Figure 2 satisfy these criteria and are therefore likely damped absorbers. Our study therefore provide direct empirical evidence for the presence of high column density cool gas in halos. A large spectroscopic sample of LRGs will not only improve the contraints for in massive halos but also provide additional insights into the origin of the cool gas.
References
- Balogh et al. (2000) Balogh, M. L., Navarro, J. F., & Morris, S. L. 2000, ApJ, 540, 113
- Bergeron & Stasińska (1986) Bergeron, J., & Stasińska, G. 1986, A&A, 169, 1
- Birnboim & Dekel (2003) Birnboim, Y., & Dekel, A. 2003, MNRAS, 345, 349
- Blake et al. (2008) Blake, C., Collister, A., & Lahav, O. 2008, MNRAS, 385, 1257
- Bouché et al. (2006) Bouché, N., Murphy, M. T., Péroux, C., Csabai, I., & Wild, V. 2006, MNRAS, 371, 495
- Bowen et al. (2006) Bowen, D. V., et al. 2006, ApJ, 645, L105
- Brown et al. (2007) Brown, M. J. I., Dey, A., Jannuzi, B. T., Brand, K., Benson, A. J., Brodwin, M., Croton, D. J., & Eisenhardt, P. R. 2007, ApJ, 654, 858
- Brown et al. (2008) Brown, M. J. I., et al. 2008, ApJ, 682, 937
- Bruzual & Charlot (2003) Bruzual, G., & Charlot, S. 2003, MNRAS, 344, 1000
- Chen et al. (2001) Chen, H.-W., Lanzetta, K. M., & Webb, J. K. 2001, ApJ, 556, 158
- Chen & Tinker (2008) Chen, H.-W., & Tinker, J. L. 2008, ApJ, 687, 745
- Collister et al. (2007) Collister, A., et al. 2007, MNRAS, 375, 68
- Dekel & Birnboim (2006) Dekel, A., & Birnboim, Y. 2006, MNRAS, 368, 2
- Doyle et al. (2005) Doyle, M. T., et al. 2005, MNRAS, 361, 34
- Eisenstein et al. (2001) Eisenstein, D. J., et al. 2001, AJ, 122, 2267
- Gauthier et al. (2009) Gauthier, J.-R., Chen, H.-W., & Tinker, J. L. 2009, ApJ, 702, 50
- Gunn & Gott (1972) Gunn, J. E., & Gott, III, J. R. 1972, ApJ, 176, 1
- Kacprzak et al. (2008) Kacprzak, G. G., Churchill, C. W., Steidel, C. C., & Murphy, M. T. 2008, AJ, 135, 922
- Kereš et al. (2009) Kereš, D., Katz, N., Davé, R., Fardal, M., & Weinberg, D. H. 2009, MNRAS, 396, 2332
- Kereš et al. (2005) Kereš, D., Katz, N., Weinberg, D. H., & Davé, R. 2005, MNRAS, 363, 2
- Lanzetta & Bowen (1990) Lanzetta, K. M., & Bowen, D. 1990, ApJ, 357, 321
- Maller & Bullock (2004) Maller, A. H., & Bullock, J. S. 2004, MNRAS, 471
- Mo & Miralda-Escude (1996) Mo, H. J., & Miralda-Escude, J. 1996, ApJ, 469, 589
- Padmanabhan et al. (2008) Padmanabhan, N., White, M., Norberg, P., & Porciani, C. 2008, ArXiv 0802.210
- Prochter et al. (2006) Prochter, G. E., Prochaska, J. X., & Burles, S. M. 2006, ApJ, 639, 766
- Rao et al. (2006) Rao, S. M., Turnshek, D. A., & Nestor, D. B. 2006, ApJ, 636, 610
- Ross et al. (2009) Ross, N. P., et al. 2009, ApJ, 697, 1634
- Schneider et al. (2007) Schneider, D. P., et al. 2007, AJ, 134, 102
- Steidel et al. (1994) Steidel, C. C., Dickinson, M., & Persson, S. E. 1994, ApJ, 437, L75
- Thilker et al. (2004) Thilker, D. A., Braun, R., Walterbos, R. A. M., Corbelli, E., Lockman, F. J., Murphy, E., & Maddalena, R. 2004, ApJ, 601, L39
- Tinker & Chen (2008) Tinker, J. L., & Chen, H.-W. 2008, ApJ, 679, 1218
- Tinker & Chen (2010) —. 2010, ApJ, 709, 1
- Tinker & Wetzel (2009) Tinker, J. L., & Wetzel, A. R. 2009, ArXiv e-prints 0909.1325
- Tripp & Bowen (2005) Tripp, T. M., & Bowen, D. V. 2005, in IAU Colloq. 199: Probing Galaxies through Quasar Absorption Lines, ed. P. Williams, C.-G. Shu, & B. Menard, 5–23
- Verdes-Montenegro et al. (2007) Verdes-Montenegro, L., Yun, M. S., Borthakur, S., Rasmussen, J., & Ponman, T. 2007, New Astronomy Review, 51, 87
- Verdes-Montenegro et al. (2001) Verdes-Montenegro, L., Yun, M. S., Williams, B. A., Huchtmeier, W. K., Del Olmo, A., & Perea, J. 2001, A&A, 377, 812
- Zheng et al. (2008) Zheng, Z., Zehavi, I., Eisenstein, D. J., Weinberg, D. H., & Jing, Y. 2008, ArXiv 0809.1868