Bulges Of Nearby Galaxies With Spitzer: Scaling Relations in Pseudobulges and Classical Bulges
Abstract
We investigate scaling relations of bulges using bulge-disk decompositions at 3.6 m and present bulge classifications for 173 E-Sd galaxies within 20 Mpc. Pseudobulges and classical bulges are identified using Sérsic index, HST morphology, and star formation activity (traced by 8 emission). In the near-IR pseudobulges have and classical bulges have , as found in the optical. Sérsic index and morphology are essentially equivalent properties for bulge classification purposes. We confirm, using a much more robust sample, that the Sérsic index of pseudobulges is uncorrelated with other bulge structural properties, unlike for classical bulges and elliptical galaxies. Also, the half-light radius of pseudobulges is not correlated with any other bulge property. We also find a new correlation between surface brightness and pseudobulge luminosity; pseudobulges become more luminous as they become more dense. Classical bulges follow the well known scaling relations between surface brightness, luminosity and half-light radius that are established by elliptical galaxies. We show that those pseudobulges (as indicated by Sérsic index and nuclear morphology) that have low specific star formation rates are very similar to models of galaxies in which both a pseudobulge and classical bulge exist. Therefore, pseudobulge identification that relies only on structural indicators is incomplete. Our results, especially those on scaling relations, imply that pseudobulges are very different types of objects than elliptical galaxies.
Subject headings:
galaxies: bulges — galaxies: formation — galaxies: evolution — galaxies: structure — galaxies: fundamental parameters1. Introduction
A preponderance of observational evidence suggests that there are at least two types of bulges. Reviews of evidence for a dichotomy of bulges can be found in Kormendy & Kennicutt (2004), Athanassoula (2005), Kormendy & Fisher (2005), and for a review of more recent literature see Combes (2009). The dichotomy in bulge properties can be summarized as follows: many bulges have properties as described by Renzini (1999) of “little elliptical galaxies surrounded by a disk”, while other bulges are similar in many properties to disk galaxies. We call those bulges that are similar to E-type galaxies “classical bulges”, and those that are more like disk-galaxies are referred to as “pseudobulges.”
Many bulges in the nearby Universe are filled with young stars (Peletier & Balcells, 1996; Gadotti & dos Anjos, 2001; Carollo et al., 2002; MacArthur et al., 2003), and many bulges are gas rich (Regan et al., 2001; Helfer et al., 2003; Sheth et al., 2005; Jogee et al., 2005). Also, Peletier & Balcells (1996) find that the ages and stellar populations of bulges vary greatly from galaxy-to-galaxy; however, the stellar population of the outer disk is an excellent predictor of that of the bulge. Fisher (2006) shows that bulge morphology is also a good predictor of star formation in the bulge. He finds that pseudobulges are actively forming stars, and have ISM properties that are like that of their outer disks. Fisher et al. (2009) study star formation in bulges and their outer disks using Spitzer and GALEX data. They show that pseudobulges are presently increasing the bulge-to-total ratio of stellar light (here after ) via internal star formation. If pseudobulges have similar star formation histories as their outer disks, then the mean historic star formation rate (over the past 10 Gyr) ought to be 1-3 times that of present day star formation rate (Kennicutt et al., 1994). The results of Fisher et al. (2009) thus indicate that present day star formation rates are high enough to account for the entire stellar mass of most pseudobulges. Also, Fisher et al. (2009) find positive correlations between bulge mass and star formation rate density suggesting that long term in situ growth may have formed pseudobulges. Furthermore, those pseudobulges with highest star formation rate density are exclusively found in the most massive disks, suggesting that pseudobulge growth is connected to outer disk properties. They also find that classical bulges, in contrast, are not forming significant amounts of stars today. Furthermore, data from Regan et al. (2001); Helfer et al. (2003) show that classical bulges are gas poor when compared to their outer disk.
The shape of stellar density profiles is also thought to participate in the bulge dichotomy. Andredakis et al. (1995) and, more recently, Scarlata et al., 2004 show that the distribution of surface brightness profile shapes of bulges is bimodal. Also, Carollo (1999) finds that many of the the ’amorphous nuclei’ of intermediate-type disk galaxies are better fit by exponential profiles, rather than the traditional profile. This leads Kormendy & Kennicutt (2004), among others, to suggest that surface brightness is tied to the pseudobulge – classical bulge dichotomy. Fisher & Drory (2008) directly test this hypothesis. They identify pseudobulges with bulge morphology. Using -band bulge-disk decompositions they find that that 90% of pseudobulges have and all classical bulges have . Fisher & Drory (2008) also find that the Sérsic index of pseudobulges does not correlate with bulge luminosity, half-light radius or bulge-to-total ratio as it does for classical bulges and elliptical galaxies.
It is well known that elliptical galaxies follow a “fundamental plane” in parameter space that relates size, surface density, and velocity dispersion (e.g. Djorgovski & Davis, 1987; Dressler et al., 1987; Faber et al., 1989). To lowest order, these correlations are a consequence of the virial theorem; small deviations from virial predictions in slopes of these correlations represent variation in mass-to-light ratios and non-homologous density profiles. Disks correlate differently than ellipticals in fundamental plane parameter space (Bender et al., 1992; Kormendy et al., 2009). Yet, the location of pseudobulges compared to that of classical bulges, elliptical galaxies, and disks in structural parameter correlations is poorly understood. Thus, knowing where pseudobulges lie with respect to fundamental plane correlations would help in interpreting their structural properties.
Graham (2001),MacArthur et al. (2003), and de Jong et al. (2004) each investigate the scaling relations of bulges. All find parameter correlations with high scatter. The Sersic (1968) function is highly degenerate (Graham & Colless, 1997), and the dynamic range available to fit bulges is limited. Indeed, Balcells et al. (2003) and Gadotti (2008) show that high spatial resolution is necessary to accurately determine fit parameters when using the Sérsic function. Accordingly, Balcells et al. (2007) and Fisher & Drory (2008) use composite HST and ground-based data to calculate bulge-disk decompositions. The central isophotes are calculated with HST data, providing adequate spatial resolution, and outer isophotes are calculated with ground based data. However, this method is more labor intensive, and the the resulting data set is smaller. They find a high probability of correlation among many structural parameters of bulges. Nonetheless, the scatter remains high.
Carollo (1999) find that exponential bulges are systematically lower in effective surface brightness than those better fit by an -profile. Falcón-Barroso et al. (2002) find that bulges which deviate from the edge-on projection of the fundamental plane are found in late type (Sbc) galaxies, and it is generally assumed that pseudobulges are more common in late-type galaxies (Kormendy & Kennicutt, 2004). Gadotti (2009) finds a large population of pseudobulges that are much fainter in surface brightness for a given half-light radius than predicted by a correlation fit to elliptical galaxies.
There is a great variety of properties which participate in the dichotomy of bulges and motivate the association of pseudobulges with disk-like objects. Kormendy & Kennicutt (2004) suggest that kinematics dominated by rotation; flattening similar to that of their outer disk; nuclear bar, nuclear ring and/or nuclear spiral; near-exponential surface brightness profiles are all features of pseudobulges and not classical bulges. Fisher & Drory (2008) use morphology to identify bulge-type and find that morphology correlates with Sérsic index. Gadotti (2009) uses the position in parameter space to study the distribution of bulge properties from SDSS data.
Yet, there is no reason to think that all pseudobulges must have a small Sérsic index, nor is it necessary that no pseudobulges overlap in parameter space with classical bulges. In this paper, we will identify pseudobulges using multiple methods including morphology, star formation, and structural properties. We will present a quantitative prescription for identifying pseudobulges using these multiple methods, and apply that method to all non-edge on bulge-disk galaxies within 20 Mpc that have been observed by the Spitzer Space Telescope (SST). We will also use this more robust method for identifying bulge types to study the behavior of pseudobulges in photometric projections of the fundamental plane.
2. Sample
Our aim in this paper is to investigate differences in parameter correlations between pseudobulges and classical bulges. In this section, we outline our sample selection process and investigate properties of that sample. We use data from SST to perform bulge-disk decompositions at 3.6 m, where the data are less affected by gradients in dust and stellar populations than in the optical bands. Also, we use 8 m mid-IR data to estimate star formation rates. Although star formation rates estimated this way are less reliable than using, e.g., the 24 m band, the increase in spatial resolution allows us to isolate star formation in smaller bulges and we feel that the benefits from increase in dynamic range and sample size offsets the loss in star formation rates accuracy. We can thus revisit correlations in previous optical work (e.g. Fisher & Drory, 2008), and those with significantly smaller samples (e.g. Fisher et al., 2009). To minimize effects due to selection we analyze all bulge-disk galaxies in both the RC3 and Spitzer archive sufficiently nearby to accurately decompose the bulge.
2.1. Sample Selection
Many studies have found that bulges are never smaller than a few hundred parsecs (e.g. Graham, 2001; Balcells et al., 2007; Fisher et al., 2009). Thus, we set a distance limit of 20 Mpc such that all bulges in our sample will be resolved to pc with IRAC on SST.
We cross reference the RC3 (de Vaucouleurs et al., 1991) with the Spitzer Archive. We select all galaxies between Hubble types S0 and Sd (as given in RC3) available in the SST archive within our distance limit (20 Mpc). We do not analyze bulges later type than Sd because bulges are extremely rare in Sdm - Irr galaxies
We restrict our sample to exclude significantly inclined galaxies. We only keep galaxies that satisfy . ( is the mean decimal logarithm of the ratio of the major isophotal diameter at isophotal diameter, , to that of the minor axis.) This corresponds to an inclination of about 75 for an Sc spiral. This cut yields 331 galaxies. We visually identify 9 galaxies that are highly inclined, but not excluded by the criterion because of a very large bulge-to-total ratio. These galaxies are removed from the sample.
We only select galaxies that are free of tidal-tails, warps and asymmetries in IRAC1 images. This is done to attempt to reduce the number of galaxies significantly affected by interactions or mergers with other galaxies. For each galaxy, we also consider comments in the Carnegie Atlas of Galaxies (Sandage & Bedke, 1994); galaxies described as ’amorphous’ and/or ’peculiar’ are scrutinized for evidence of recent or ongoing interactions. We remove 34 galaxies due to peculiar morphology or tidal tails.
The total list that meets all of the above selection criteria is 297 galaxies. Of these 297 galaxies, 146 have adequate data in the spitzer archive. Note that a handful of galaxies have over-exposed centers, or the galaxy is not well covered in the Spitzer image. Those galaxies are not included in the 146 disk galaxy sample.
| Galaxy | MorphologyaaTaken from RC3 | DistancebbDistance References: (1)- Tully & Fisher (1988) (2)- Tonry et al. (2001) (3)-de Vaucouleurs et al. (1991) | MBaaTaken from RC3 | aaTaken from RC3 | log(D25)aaTaken from RC3 |
|---|---|---|---|---|---|
| [Mpc] | [mag] | [mag] | log([pc]) | ||
| IC342 | .SXT6.. | 2.58 (1) | -17.96 | 1.10 | 3.90 |
| IC749 | .SXT6. | 13.24 (1) | -17.69 | 0.63 | 3.65 |
| NGC0300 | .SAS7.. | 2.69 (1) | -18.43 | 0.59 | 3.93 |
| NGC0404 | .LAS-*. | 3.27 (2) | -16.36 | 0.85 | 3.22 |
| NGC0628 | .SAS5.. | 11.14 (1) | -20.28 | 0.64 | 4.23 |
| NGC0672 | .SBS6.. | 7.52 (1) | -17.91 | 0.59 | 3.90 |
| NGC0925 | .SXS7.. | 10.30 (1) | -19.37 | 0.58 | 4.20 |
| NGC1023 | .LBT-.. | 11.53 (2) | -19.96 | 1.01 | 4.16 |
| NGC1058 | .SAT5.. | 10.30 (1) | -18.24 | 0.62 | 3.66 |
| NGC1097 | .SBS3.. | 17.82 (1) | -21.02 | 0.83 | 4.38 |
| NGC1313 | .SBS7.. | 3.99 (1) | -18.80 | 0.47 | 3.72 |
| NGC1317 | .SXR1.. | 18.41 (1) | -19.42 | 0.98 | 3.87 |
| NGC1433 | PSBR2.. | 11.41 (1) | -19.59 | 0.85 | 4.03 |
| NGC1512 | .SBR1.. | 11.41 (1) | -19.16 | 0.87 | 4.17 |
| NGC1543 | RLBS0.. | 13.78 (1) | -19.24 | 0.97 | 3.99 |
| NGC1559 | .SBS6.. | 13.91 (1) | -19.72 | 0.64 | 3.85 |
| NGC1566 | .SXS4.. | 13.78 (1) | -20.37 | 0.68 | 4.22 |
| NGC1617 | .SBS1.. | 13.78 (1) | -19.32 | 0.96 | 3.93 |
| NGC1637 | .SXT5.. | 8.40 (1) | -18.15 | 0.73 | 3.69 |
| NGC1672 | .SBS3.. | 17.82 (1) | -20.97 | 0.67 | 4.23 |
| NGC1744 | .SBS7.. | 14.14 (1) | -19.15 | 0.53 | 4.22 |
| NGC1808 | RSXS1.. | 11.39 (1) | -19.54 | 0.82 | 4.03 |
| NGC2403 | .SXS6.. | 3.31 (1) | -18.67 | 0.55 | 4.02 |
| NGC2500 | .SBT7.. | 7.49 (1) | -17.17 | 0.58 | 3.50 |
| NGC2655 | .SXS0.. | 20.54 (1) | -20.60 | 0.91 | 4.17 |
| NGC2685 | RLB.+P. | 13.45 (1) | -18.52 | 0.93 | 3.94 |
| NGC2775 | .SAR2.. | 14.42 (1) | -19.76 | 0.96 | 3.95 |
| NGC2841 | .SAR3*. | 8.96 (1) | -19.67 | 0.93 | 4.03 |
| NGC2903 | .SXT4.. | 8.16 (1) | -19.88 | 0.71 | 4.17 |
| NGC2950 | RLBR0.. | 20.62 (1) | -19.73 | 0.92 | 3.91 |
| NGC2964 | .SXR4*. | 19.90 (1) | -19.50 | 0.75 | 3.92 |
| NGC2976 | .SA.5P. | 3.31 (1) | -16.78 | 0.66 | 3.45 |
| NGC2997 | .SXT5.. | 10.98 (1) | -20.14 | 0.93 | 4.15 |
| NGC3031 | .SAS2.. | 3.91 (2) | -20.07 | 0.99 | 4.18 |
| NGC3032 | .LXR0.. | 19.66 (1) | -18.29 | 0.63 | 3.76 |
| NGC3156 | .L…*. | 14.82 (1) | -17.78 | 0.75 | 3.62 |
| NGC3184 | .SXT6.. | 9.11 (1) | -19.44 | 0.66 | 3.99 |
| NGC3185 | RSBR1.. | 16.53 (1) | -18.10 | 0.82 | 3.75 |
| NGC3190 | .SAS1P/ | 16.53 (1) | -18.97 | 0.98 | 4.02 |
| NGC3198 | .SBT5.. | 9.11 (1) | -18.93 | 0.62 | 4.05 |
| NGC3319 | .SBT6. | 9.11 (1) | -18.32 | 0.48 | 3.91 |
| NGC3344 | RSXR4. | 8.16 (1) | -19.11 | 0.67 | 3.92 |
| NGC3351 | .SBR3. | 8.57 (1) | -19.13 | 0.85 | 3.97 |
| NGC3368 | .SXT2. | 8.57 (1) | -19.55 | 0.94 | 3.98 |
| NGC3384 | .LBS-*. | 8.57 (1) | -18.81 | 0.95 | 3.84 |
| NGC3412 | .LBS0.. | 8.57 (1) | -18.21 | 0.92 | 3.66 |
| NGC3486 | .SXR5. | 8.62 (1) | -18.63 | 0.61 | 3.95 |
| NGC3489 | .LXT+.. | 8.57 (1) | -18.54 | 0.84 | 3.65 |
| NGC3511 | .SAS5. | 12.32 (1) | -18.92 | 0.59 | 4.01 |
| NGC3521 | .SXT4. | 8.15 (1) | -19.73 | 0.88 | 4.11 |
| NGC3593 | .SAS0*. | 8.76 (1) | -17.85 | 0.98 | 3.83 |
| NGC3621 | .SAS7. | 7.88 (1) | -19.20 | 0.62 | 4.15 |
| NGC3675 | .SAS3. | 10.68 (1) | -19.14 | 0.94 | 3.96 |
| NGC3726 | .SXR5. | 13.24 (1) | -19.70 | 0.49 | 4.07 |
| NGC3906 | .SBS7. | 19.30 (3) | -17.94 | … | 3.72 |
| NGC3938 | .SAS5. | 13.24 (1) | -19.71 | 0.62 | 4.01 |
| NGC3941 | .LBS0.. | 12.85 (1) | -19.29 | 0.93 | 3.81 |
| NGC3945 | RLBT+.. | 18.96 (1) | -19.59 | 0.97 | 4.16 |
| NGC3953 | .SBR4. | 13.24 (1) | -19.77 | 0.86 | 4.12 |
| NGC3982 | .SXR3* | 13.24 (1) | -18.84 | … | 3.65 |
| NGC3990 | .L..-*/ | 13.24 (1) | -17.18 | 0.91 | 3.43 |
| NGC4020 | .SB.7? | 11.15 (1) | -16.85 | … | 3.53 |
| NGC4117 | .L..0*. | 12.10 (3) | -16.31 | … | 3.50 |
| NGC4136 | .SXR5. | 12.48 (1) | -18.43 | … | 3.86 |
| NGC4138 | .LAR+.. | 13.24 (1) | -18.45 | 0.86 | 3.69 |
| NGC4150 | .LAR0$. | 13.74 (1) | -18.25 | 0.82 | 3.67 |
| NGC4203 | .LX.-*. | 15.14 (2) | -19.10 | 0.90 | 3.87 |
| NGC4237 | .SXT4. | 14.28 (1) | -18.26 | 0.87 | 3.64 |
| NGC4254 | .SAS5.. | 14.28 (1) | -20.33 | 0.65 | 4.05 |
| NGC4258 | .SXS4. | 8.17 (1) | -20.46 | 0.77 | 4.34 |
| NGC4267 | .LBS-$. | 14.28 (1) | -18.91 | 0.97 | 3.83 |
| NGC4274 | RSBR2. | 12.48 (1) | -19.14 | 0.97 | 4.09 |
| NGC4293 | RSBS0.. | 14.63 (1) | -19.57 | 0.94 | 4.08 |
| NGC4294 | .SBS6. | 14.28 (1) | -18.24 | 0.51 | 3.83 |
| Galaxy | MorphologyaaTaken from RC3 | DistancebbDistance References: (1)- Tully & Fisher (1988) (2)- Tonry et al. (2001) (3)-de Vaucouleurs et al. (1991) | MBaaTaken from RC3 | aaTaken from RC3 | log(D25)aaTaken from RC3 |
|---|---|---|---|---|---|
| [Mpc] | [mag] | [mag] | log([pc]) | ||
| NGC4303 | .SXT4.. | 19.77 (1) | -21.30 | 0.63 | 4.27 |
| NGC4314 | .SBT1. | 12.48 (1) | -19.05 | 0.87 | 3.88 |
| NGC4321 | .SXS4.. | 14.28 (1) | -20.72 | 0.71 | 4.19 |
| NGC4371 | .LBR+.. | 14.28 (1) | -18.98 | 0.99 | 3.92 |
| NGC4380 | .SAT3* | 14.28 (1) | -18.11 | 0.89 | 3.86 |
| NGC4394 | RSBR3. | 14.28 (1) | -19.04 | 0.90 | 3.88 |
| NGC4413 | PSBT2* | 14.28 (1) | -18.52 | 0.66 | 3.69 |
| NGC4414 | .SAT5$ | 12.48 (1) | -19.52 | 0.87 | 3.82 |
| NGC4419 | .SBS1. | 14.28 (1) | -18.69 | 0.95 | 3.84 |
| NGC4421 | .SBS0.. | 14.28 (1) | -18.30 | 0.89 | 3.75 |
| NGC4424 | .SBS1* | 14.28 (1) | -18.43 | 0.69 | 3.88 |
| NGC4442 | .LBS0.. | 14.28 (1) | -19.39 | 0.97 | 3.98 |
| NGC4448 | .SBR2. | 12.48 (1) | -18.48 | 0.88 | 3.85 |
| NGC4450 | .SAS2.. | 14.28 (1) | -19.87 | 0.90 | 4.04 |
| NGC4457 | RSXS0.. | 10.22 (1) | -18.29 | 0.88 | 3.60 |
| NGC4491 | .SBS1* | 5.90 (3) | -15.35 | 0.79 | 3.16 |
| NGC4498 | .SXS7.. | 14.28 (1) | -17.98 | … | 3.79 |
| NGC4501 | .SAT3.. | 14.28 (1) | -20.41 | 0.87 | 4.16 |
| NGC4519 | .SBT7. | 14.28 (1) | -18.43 | 0.52 | 3.82 |
| NGC4526 | .LXS0*. | 14.28 (1) | -20.11 | 0.97 | 4.18 |
| NGC4548 | .SBT3. | 19.23 (2) | -20.46 | 0.89 | 4.18 |
| NGC4559 | .SXT6. | 12.48 (1) | -20.02 | 0.48 | 4.29 |
| NGC4569 | .SXT2. | 14.28 (1) | -20.51 | 0.79 | 4.30 |
| NGC4571 | .SAR7. | 14.28 (1) | -18.95 | 0.51 | 3.88 |
| NGC4578 | .LAR0*. | 18.54 (2) | -18.96 | 0.92 | 3.95 |
| NGC4580 | .SXT1P | 14.63 (1) | -19.00 | 0.83 | 3.65 |
| NGC4605 | .SBS5P | 5.53 (1) | -17.82 | 0.52 | 3.67 |
| NGC4612 | RLX.0.. | 14.28 (1) | -18.87 | 0.89 | 3.71 |
| NGC4639 | .SXT4. | 16.63 (1) | -18.86 | 0.78 | 3.82 |
| NGC4651 | .SAT5. | 14.28 (1) | -19.38 | 0.75 | 3.92 |
| NGC4654 | .SXT6. | 14.28 (1) | -19.67 | 0.65 | 4.01 |
| NGC4688 | .SBS6. | 10.28 (1) | -16.55 | … | 3.67 |
| NGC4689 | .SAT4.. | 14.28 (1) | -19.17 | 0.65 | 3.95 |
| NGC4698 | .SAS2. | 14.28 (1) | -19.31 | 0.94 | 3.92 |
| NGC4701 | .SAS1. | 10.22 (1) | -17.25 | 0.52 | 3.61 |
| NGC4713 | .SXT7. | 17.91 (1) | -19.08 | 0.45 | 3.85 |
| NGC4725 | .SXR2P | 13.24 (1) | -20.50 | 0.90 | 4.31 |
| NGC4736 | RSAR2. | 4.23 (1) | -19.14 | 0.83 | 3.84 |
| NGC4808 | .SAS6* | 10.22 (1) | -17.70 | 0.68 | 3.61 |
| NGC4941 | RSXR2* | 5.53 (1) | -16.81 | 0.92 | 3.47 |
| NGC4984 | RLXT+.. | 16.20 (1) | -18.80 | 0.91 | 3.81 |
| NGC5005 | .SXT4. | 13.29 (1) | -20.01 | 0.75 | 4.05 |
| NGC5033 | .SAS5. | 13.29 (1) | -19.87 | 0.75 | 4.32 |
| NGC5055 | .SAT4. | 7.83 (1) | -20.16 | 0.80 | 4.16 |
| NGC5068 | .SXT6. | 6.99 (1) | -18.52 | 0.64 | 3.87 |
| NGC5128 | .L…P. | 4.21 (2) | -20.28 | 1.00 | 4.20 |
| NGC5194 | .SAS4P | 7.83 (1) | -20.51 | 0.69 | 4.11 |
| NGC5236 | .SXS5. | 7.83 (1) | -21.27 | 0.72 | 4.17 |
| NGC5248 | .SXT4. | 14.79 (1) | -19.88 | 0.65 | 4.12 |
| NGC5273 | .LAS0.. | 16.52 (2) | -18.65 | 0.86 | 3.82 |
| NGC5338 | .LB..*. | 10.79 (3) | -16.11 | … | 3.60 |
| NGC5457 | .SXT6. | 5.03 (1) | -20.20 | 0.56 | 4.32 |
| NGC5474 | .SAS6P | 5.03 (1) | -17.23 | 0.53 | 3.54 |
| NGC5585 | .SXS7. | 5.03 (1) | -17.31 | 0.46 | 3.62 |
| NGC5643 | .SXT5. | 15.13 (1) | -20.16 | 0.81 | 4.00 |
| NGC5832 | .SBT3$ | 12.51 (1) | -16.88 | 0.58 | 3.83 |
| NGC5879 | .SAT4* | 12.63 (1) | -18.29 | 0.71 | 3.88 |
| NGC5949 | .SAR4$ | 12.51 (1) | -17.58 | … | 3.61 |
| NGC6207 | .SAS5. | 14.88 (1) | -18.70 | 0.54 | 3.81 |
| NGC6300 | .SBT3. | 12.27 (1) | -19.46 | 0.86 | 3.90 |
| NGC6503 | .SAS6. | 5.53 (1) | -17.80 | 0.75 | 3.76 |
| NGC6684 | PLBS0.. | 10.06 (1) | -18.70 | 0.95 | 3.77 |
| NGC6744 | .SXR4. | 10.06 (1) | -20.87 | 0.86 | 4.47 |
| NGC7177 | .SXR3. | 19.75 (1) | -19.47 | 0.90 | 3.95 |
| NGC7217 | RSAR2. | 16.63 (1) | -20.08 | 0.98 | 3.97 |
| NGC7331 | .SAS3. | 15.50 (1) | -20.60 | 0.97 | 4.37 |
| NGC7457 | .LAT-$. | 13.24 (2) | -18.52 | 0.90 | 3.91 |
| NGC7713 | .SBR7* | 9.32 (1) | -18.34 | 0.32 | 3.78 |
| NGC7741 | .SBS6. | 13.81 (1) | -18.86 | 0.56 | 3.94 |
| NGC7793 | .SAS7. | 2.69 (1) | -17.52 | 0.51 | 3.56 |
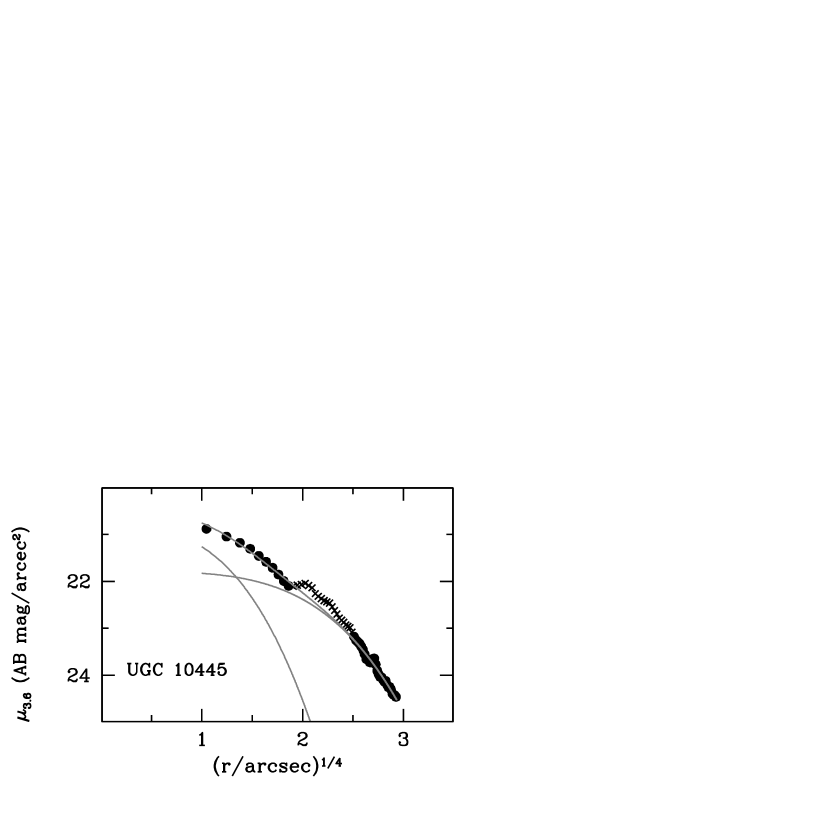
| UGC10445 | .S..6? | 12.90 (1) | -16.52 | 0.63 | 3.71 |
2.2. The Control Set: Virgo Cluster Ellipticals
We also wish to compare the location of pseudobulges and classical bulges in parameter space to that of elliptical galaxies. We therefore include a set of elliptical galaxies as a control sample. A problem for calculating Sérsic fits to elliptical galaxies is that resulting parameters are highly dependent on both spatial resolution (for low luminosity elliptical galaxies) and field-of-view (for high luminosity ellipticals). Yet, near-IR HST archival data is not necessarily available, and typical data in the Spitzer archive do not always cover the entire galaxy. Furthermore, to assure an unbiased comparison, we wish to have a complete set of elliptical galaxies.
We use the elliptical galaxy sample and data from Kormendy et al. (2009). Kormendy et al. (2009) determines surface photometry for all elliptical galaxies in the Virgo cluster. They construct band surface brightness profiles of composite data sets of HST and ground based data. To reduce the effects of sky subtraction errors and smearing due to point spread functions, Kormendy et al. (2009) capitalized on the wealth of published data available on Virgo ellipticals. Therefore galaxies in their sample tend to have many different data sources which are averaged together. Also, they add extremely deep new observations from the McDonald 0.8 m telescope, frequently reaching 30 mag arcsec-2.
We use the half-light radius, , and Sérsic index, , directly from the fits in Kormendy et al. (2009). For luminosity and surface-brightness we shift the measurement in Kormendy et al. (2009) to account for the color, designating the magnitude in IRAC channel 1. This carries an implicit assumption that color gradients in elliptical galaxies average to zero. Though not exactly true, this assumption is supported by relatively flat profiles in Kormendy et al. (2009). If a galaxy has 3.6 m data in the Spitzer archive, we calculate the luminosity at 3.6 m, and we integrate the -band profile to the maximum isophotal radius observed in the 3.6 m profile; this yields for that galaxy. For those elliptical galaxies that do not have data in the Spitzer archive, we use the average of the rest of the elliptical galaxies in the sample. The root-mean-squared deviation of about the mean is 0.5 mags. Therefore, differences of less than half a magnitude will be considered less significant in our analysis. It is well known that fainter elliptical galaxies are bluer, however Bower et al. (1992) find that the correction is roughly 0.2 mag, which is small enough to be negligible for our purposes. The elliptical galaxy sample consists of 27 galaxies, therefore the total sample in this paper is increased to 173 galaxies.


2.3. Sample Properties and Completeness
Table 1 lists the properties of our sample galaxies. In Fig. 1, we compare our sample properties to those of the complete RC3. (Note that at our distance limit the RC3 is complete to M B-mag.) From top to bottom, the properties shown are distance, RC3 T-type, absolute magnitude, and the physical radius in parsecs of the isophote at 25 B-mags arcsec-2.
Our sample is complete within 9 Mpc, and 75% complete within 13 Mpc. Beyond 13 Mpc the Spitzer coverage becomes very incomplete. Overall, the available data in the Spitzer archive yields the inclusion of half the galaxies that meet our selection criteria in the RC3.
Hubble type correlates with (Simien & de Vaucouleurs, 1986), and thus provides an important tool for identifying biases among bulge samples. The second panel from the top in Fig. 1 shows the distribution of T-types in our sample. Our sample distribution appears very similar to that of the complete RC3. Our selection is fairly independent of Hubble type, with a dip at S0/a (). There is a slight bias in the sense that more galaxies are missing at later Hubble types Sbc-Scd ().
We are missing more galaxies that are smaller. Comparing our sample to the RC3 we find that our sample includes 66% of galaxies larger than one standard deviation from the mean D25, 52% of those within one standard deviation, and only 29% of galaxies below one standard deviation. However, our sample includes galaxies in the extremes of the distribution. For the purpose of this paper, our sample adequately covers the properties of the complete RC3 distribution.
2.4. Data Sources and the Higher Quality Data Set
Including the entire Spitzer archive of bulge-disk galaxies out to 20 Mpc means that our data come from a variety of campaigns, each with separate goals and often differing observational strategies. A few notable surveys comprise of the vast majority of galaxies in our sample: the SINGS survey (Kennicutt et al., 2003), the nearby bulge survey (Fisher et al., 2009), and the local volume survey (Dale et al., 2009).
For the analysis in subsequent sections, we define a subset of our sample of higher-quality data. We do this so that we can make sure that bulges with low signal-to-noise or bright Seyfert nuclei do not cause us to miss correlations that would be seen with better data. The criteria we use for creating the high-quality data sample are as follows:
1. - Availability of optical images from HST for morphological classification, as described below. Of the complete sample, 24 galaxies do not have optical HST images.
2. - % and radius at which the Sérsic bulge and the exponential disk equal in surface brightness, , be greater than twice the PSF of the surface brightness profile. In this cut, 19 galaxies are removed.
3. - Finally we remove any galaxies with a prominent active galactic nucleus (AGN); this is to ensure that the mid-IR color is not skewed by non-thermal emission. Most of these galaxies do not make it into the sample to begin with, because the AGN typically results in overexposed IRAC images. To identify the remaining AGN, we use the same method used by Fisher et al. (2009). We measure the cuspiness of the 8 m profile by measuring the ratio of the flux within 2 arcseconds (200 pc at 20 Mpc) to that of the entire galaxy. We only include those galaxies with flux ratio less than 15%. Of the remaining sample, 10 have %, leaving the clean sample at 94 galaxies. We note that this criterion may bias our sample against extremely cuspy and compact bulges. However, galactic nuclei contain less than 1% of galaxy stellar light (Phillips et al., 1996). An object containing more than 15% of the stellar light within 200 pc lies outside any known parameter correlation of galactic components.
3. Methods
3.1. Calculation Of Surface Brightness Profiles
We use post basic calibrated data images taken on the Spitzer Space Telescope with IRAC channel 1, centered at 3.6 m, to measure the light profiles of galaxies in our sample. When available, we also use HST NICMOS data, typically in the F160W filter.
We calculate sky values by fitting a 2nd order surface to the areas of the image not covered by galaxy light. Then we subtract the surface from the image. In some cases there is not enough area on the image that is not affected by galaxy light to constrain the surface fit. In these cases, we take a mean value in an unaffected region of the image, and then we compare the resulting profile from the 3.6 m with one calculated on 2MASS (Skrutskie et al., 2006) -band images, which allow for more accurate sky subtraction. If the 3.6 m profile is significantly different, we determine the sky again using a different region of the image. At 3.6 m the sky values are very near zero, and typically of not much concern. For the 8.0 m channel, “sky” (which is most likely diffuse emission from the Milky Way) is more important. Typical uncertainties from sky subtraction are 0.3 mag for the IRAC CH1 and 0.1 mag for IRAC CH4.
We use the isophote fitting routine of Bender & Moellenhoff (1987) to generate ellipse fits. First, interfering foreground objects are identified in each image and masked manually. Then, isophotes are sampled by 256 points equally spaced in an angle relating to polar angle by , where is the polar angle and is the axial ratio. An ellipse is then fitted to each isophote by least squares. The software determines six parameters for each ellipse: relative surface brightness, center position, major and minor axis lengths, and position angle along the major axis. We combine HST and SST data by shifting the zero-point of the NICMOS data to match the IRAC profile. The two profiles are then averaged, to construct a composite HST+SST IR profile.
3.2. Sérsic Fitting
We determine bulge and disk parameters by fitting each surface brightness profile with a one-dimensional Sérsic function plus an exponential outer disk,
| (1) |
where and represent the central surface brightness and scale length of the bulge, and represent the central surface brightness and scale length of the outer disk, and represents the bulge Sérsic index. The half-light radius, , of the bulge is obtained by converting ,
| (2) |
where the value of is a proportionality constant defined such that . a& are the complete and incomplete gamma functions, respectively. We use the approximation . We restrict our range in possible Sérsic indices to to ensure that the approximation is accurate. A more precise expansion is given in MacArthur et al., 2003. The average surface-brightness within the half-light radius, , is given by
| (3) |
Where is the magnitude in 3.6 m. We adjust all luminosities by the average ellipticity in the region in which that parameter dominates the light. (Also, see Graham & Driver, 2005 for a review of the properties of the Sérsic function.)
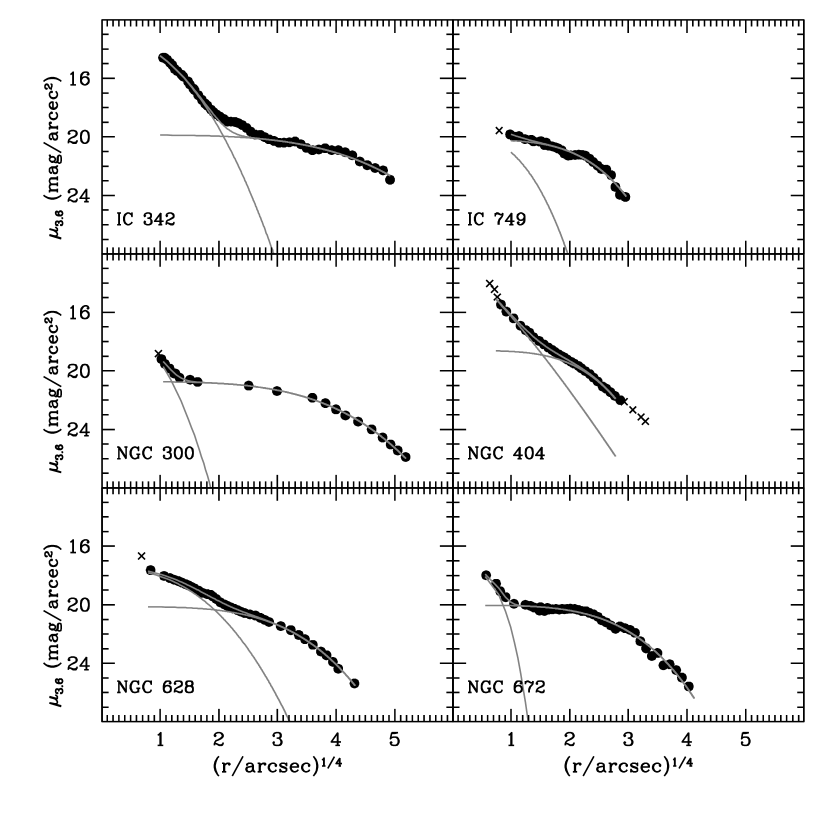
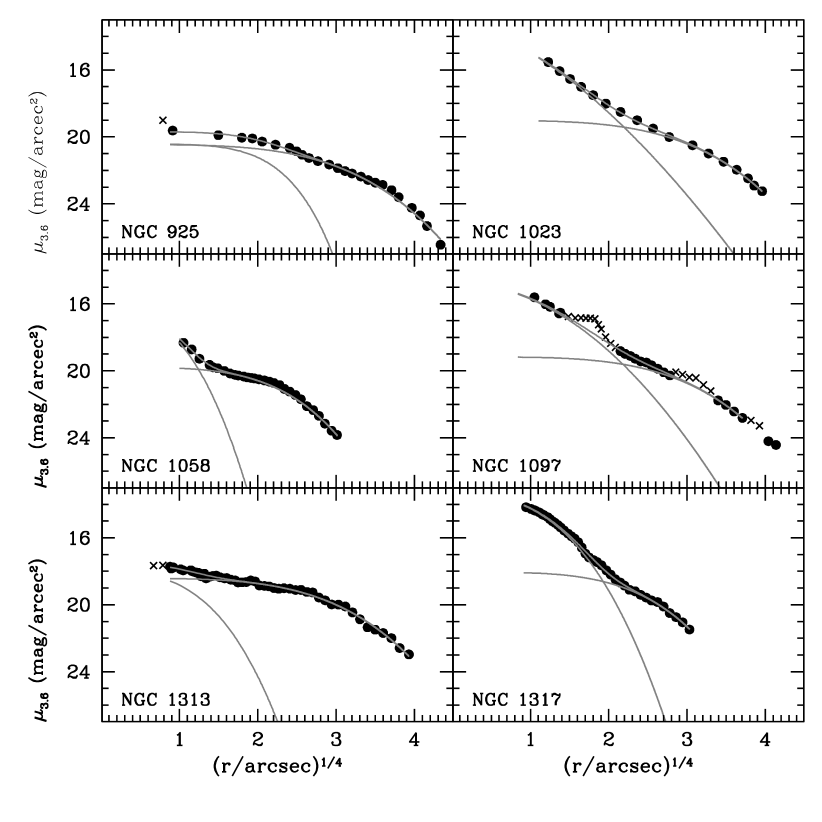
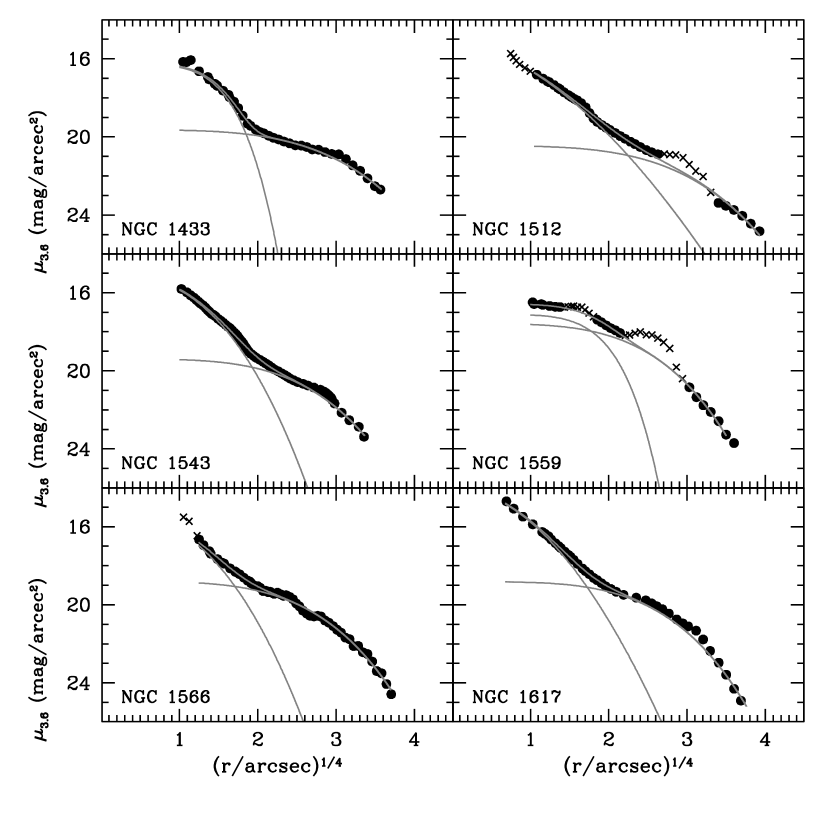
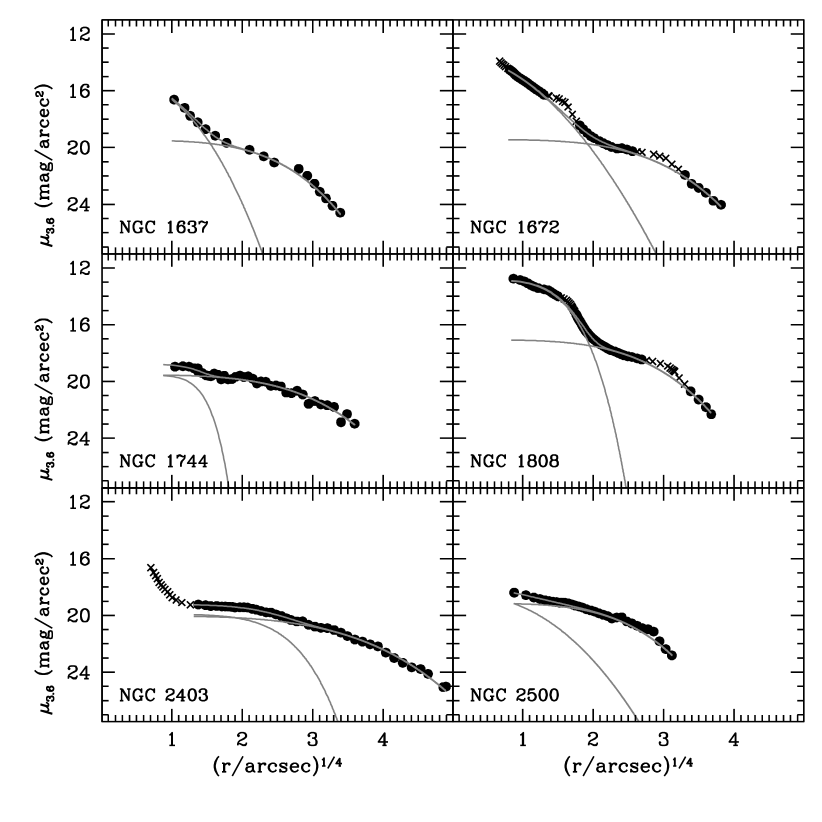
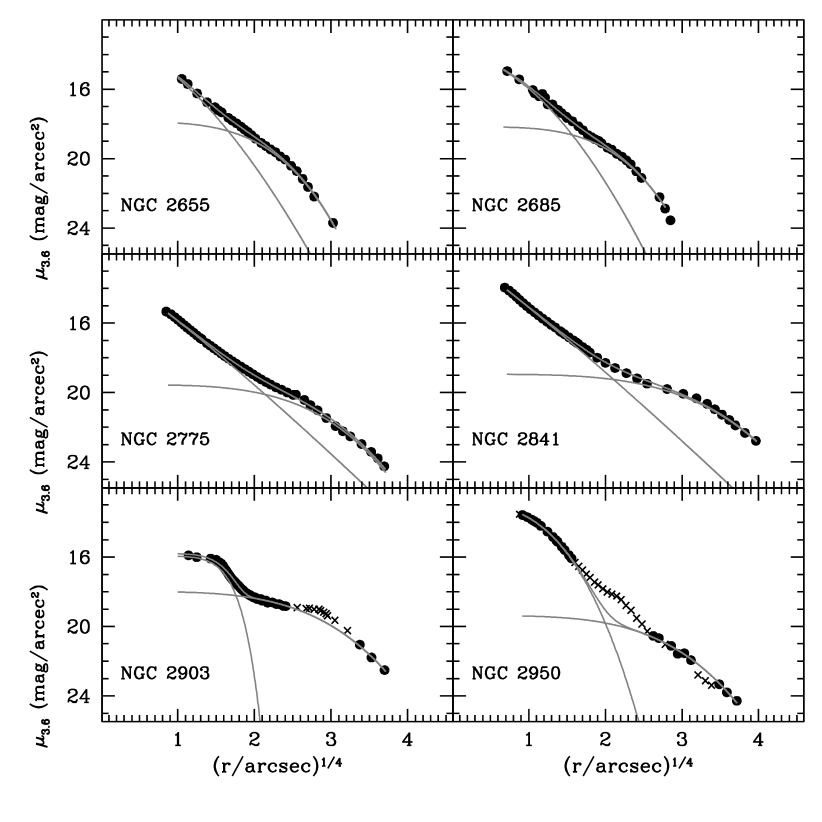
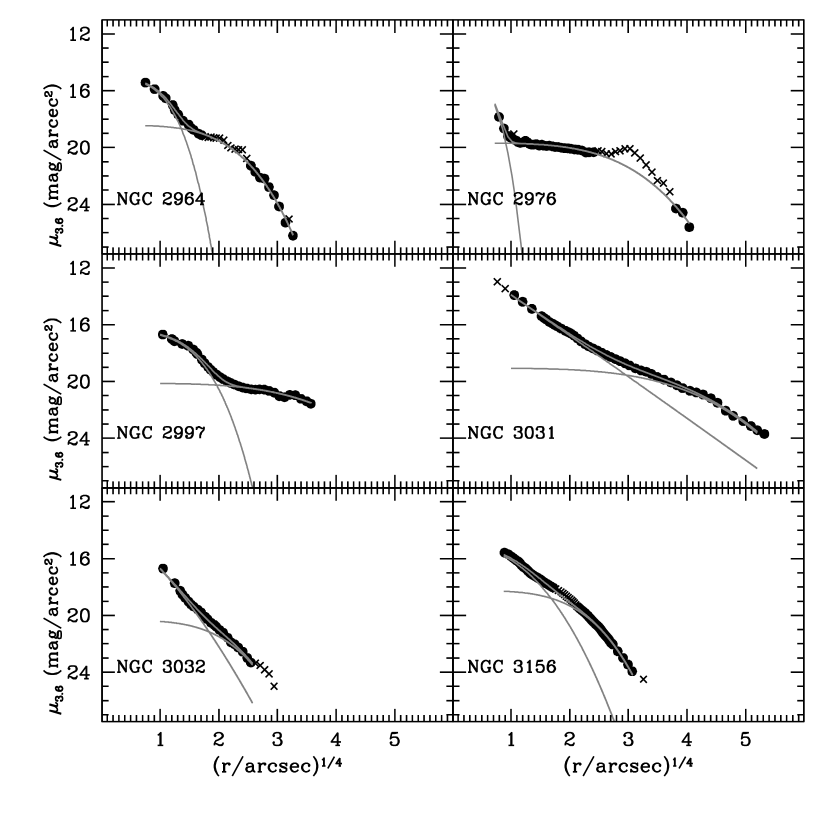
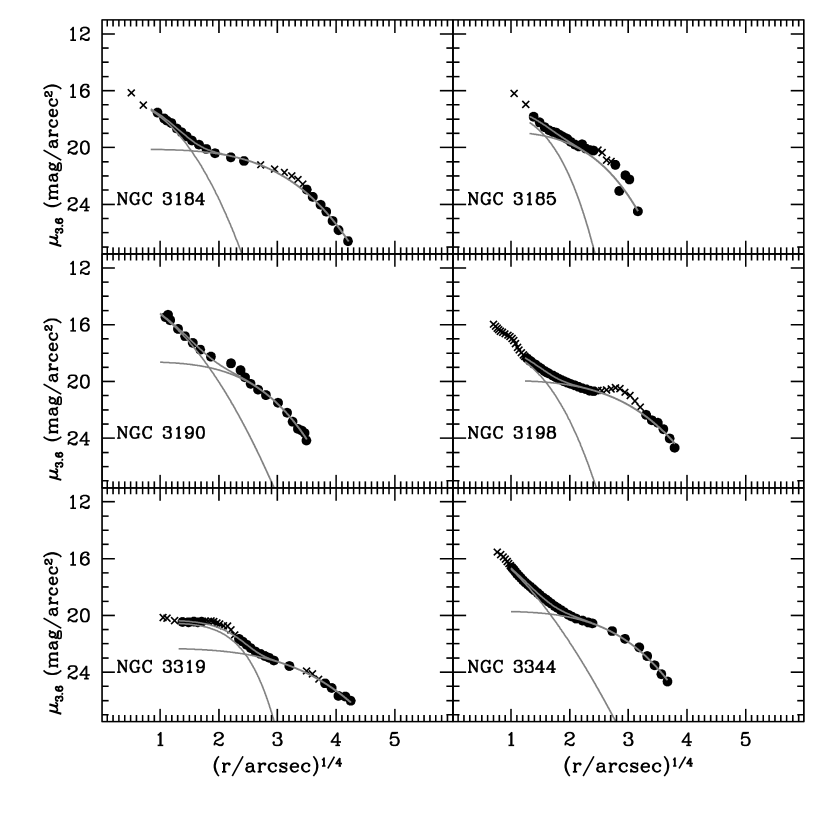
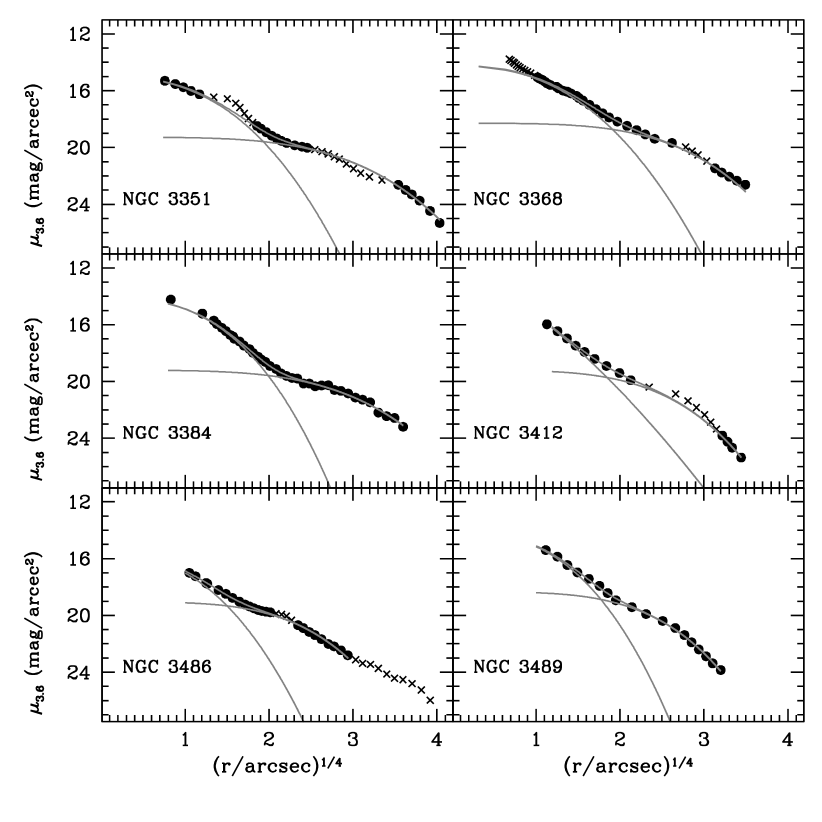
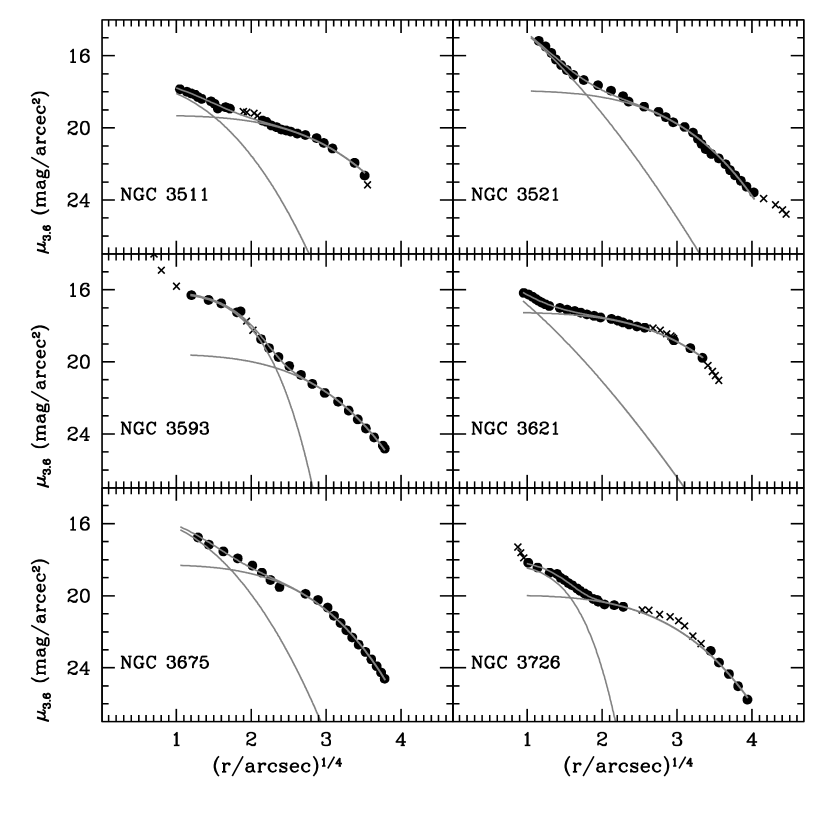
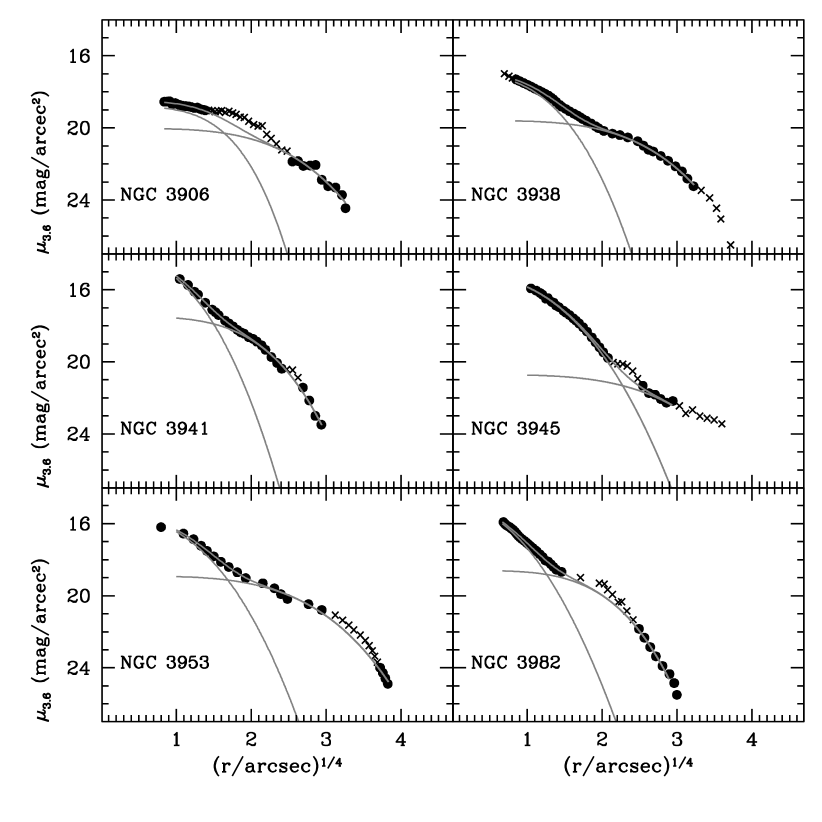
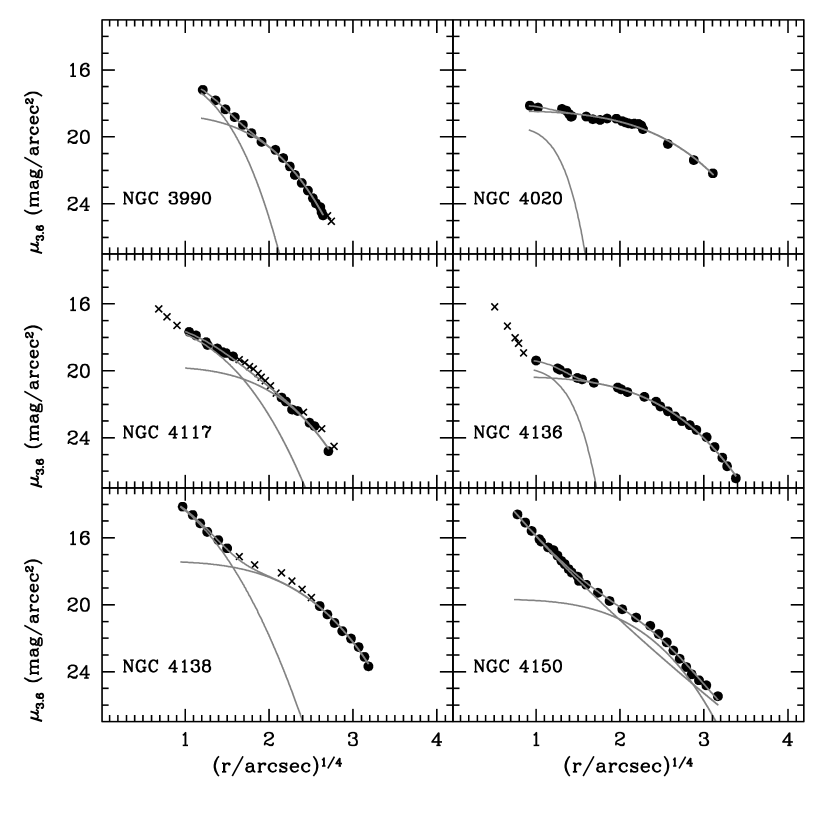
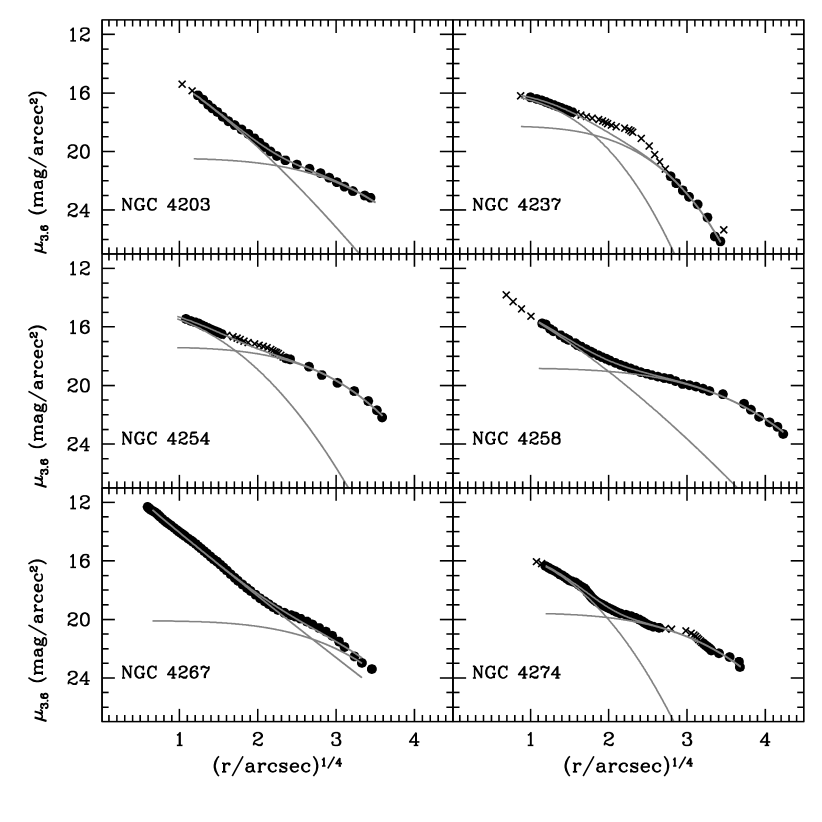
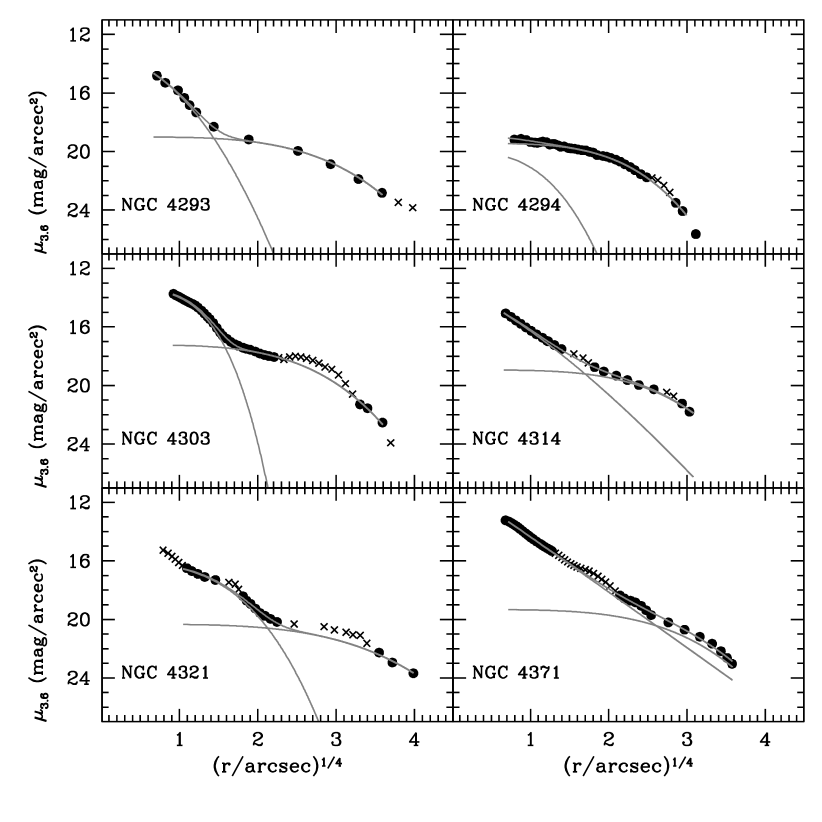
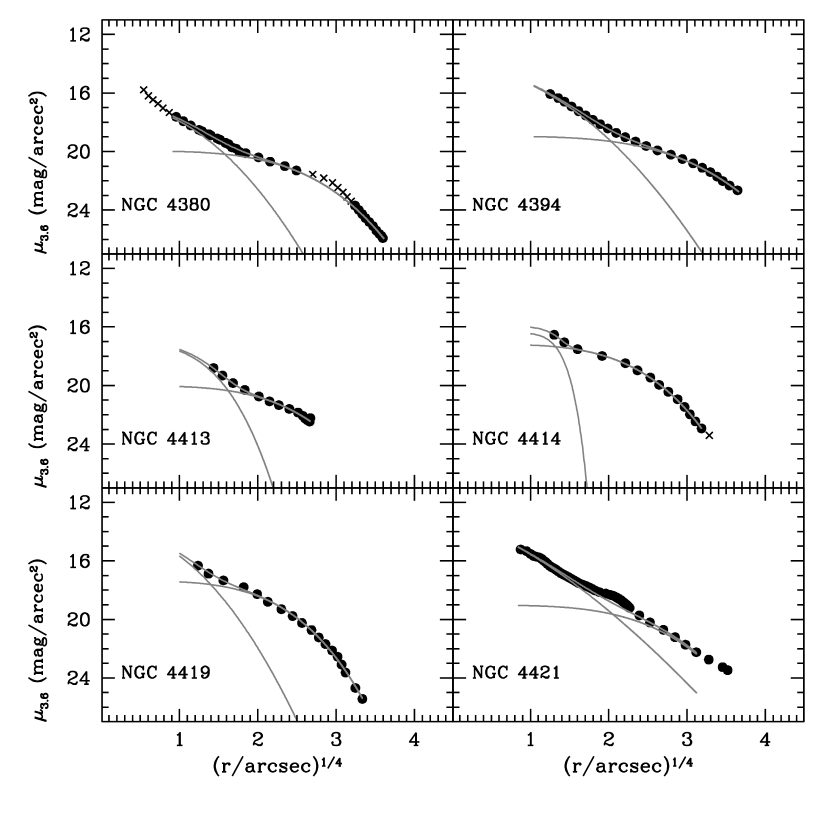
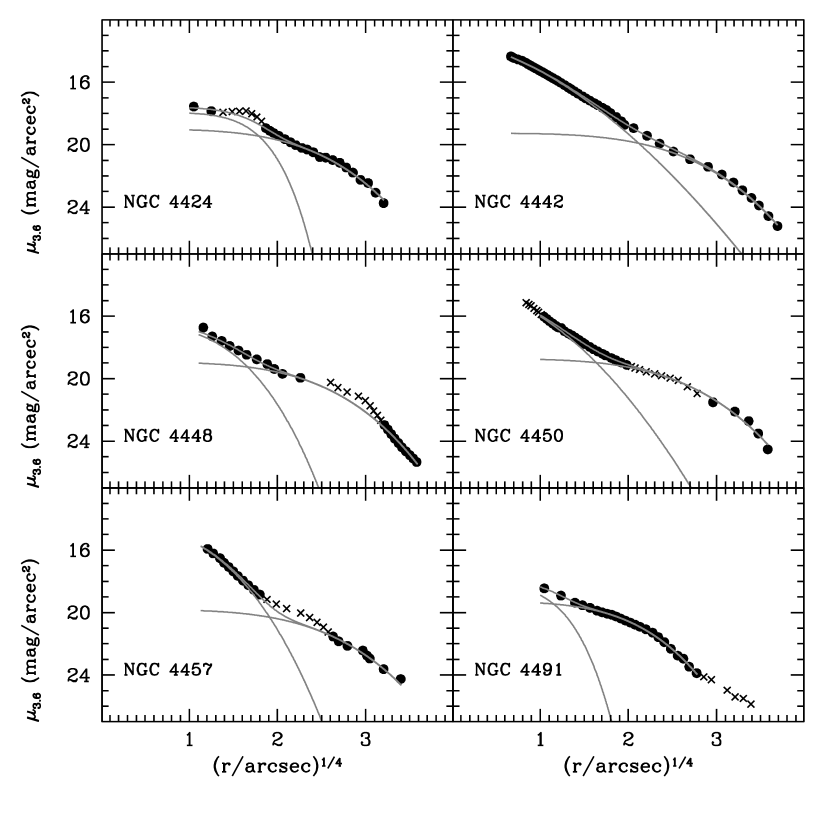
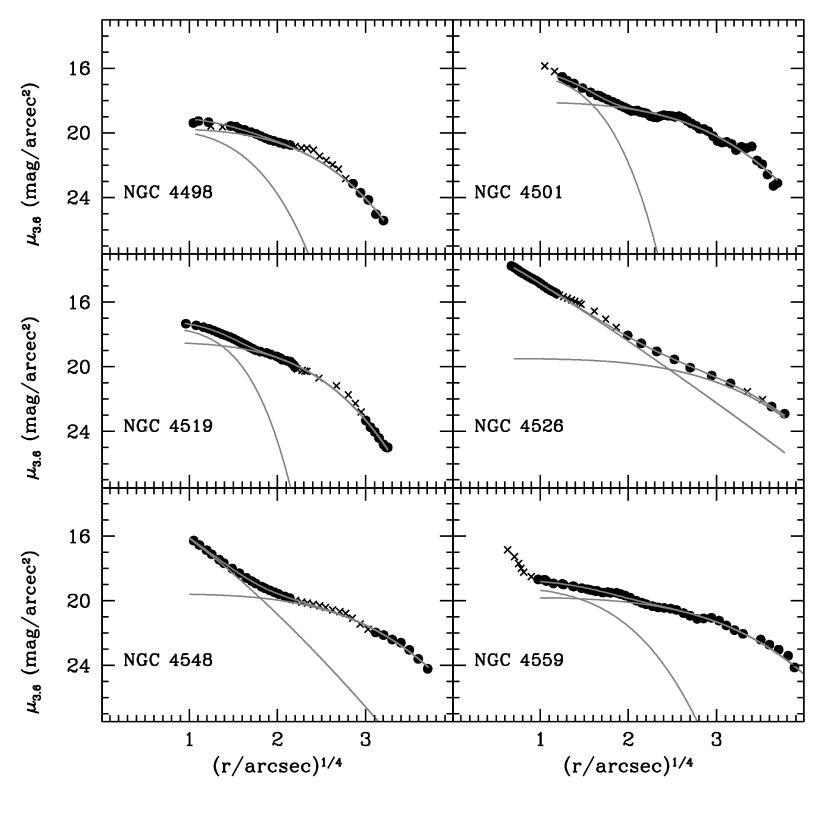
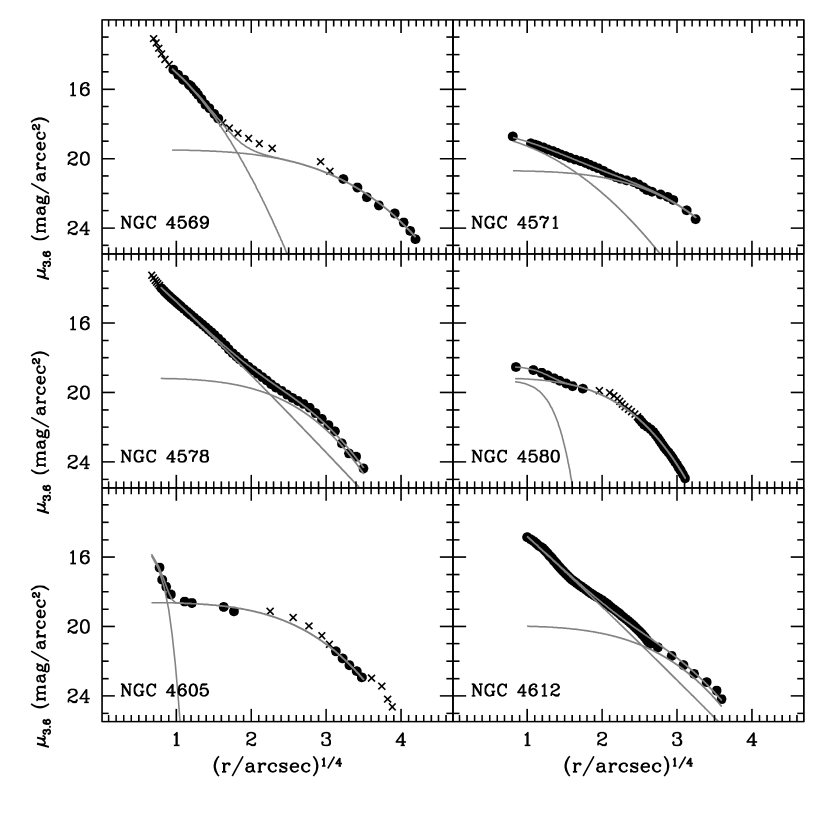
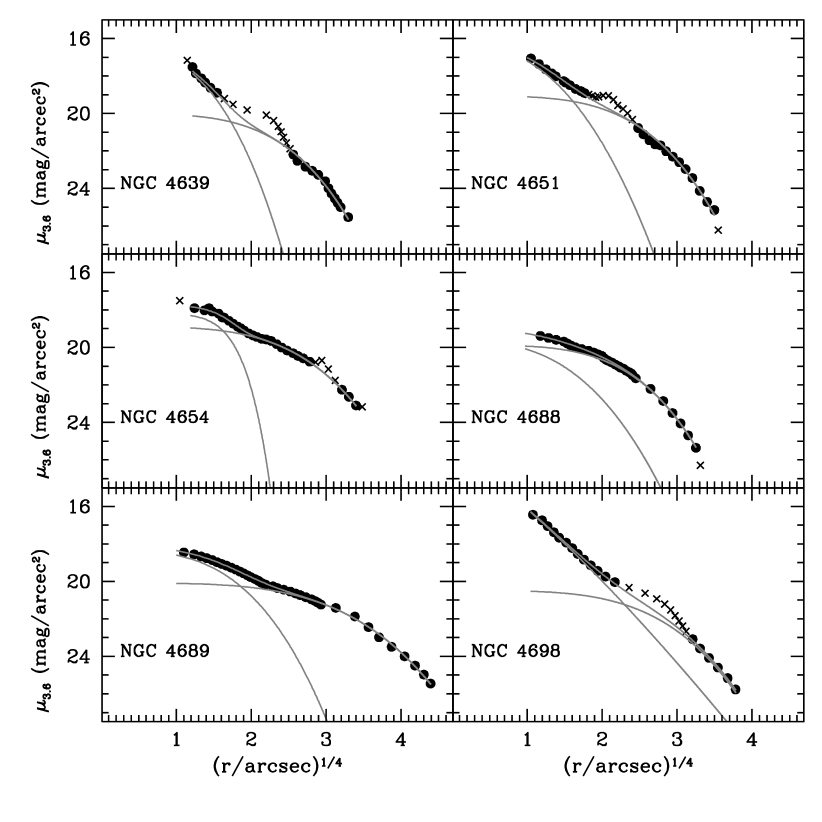
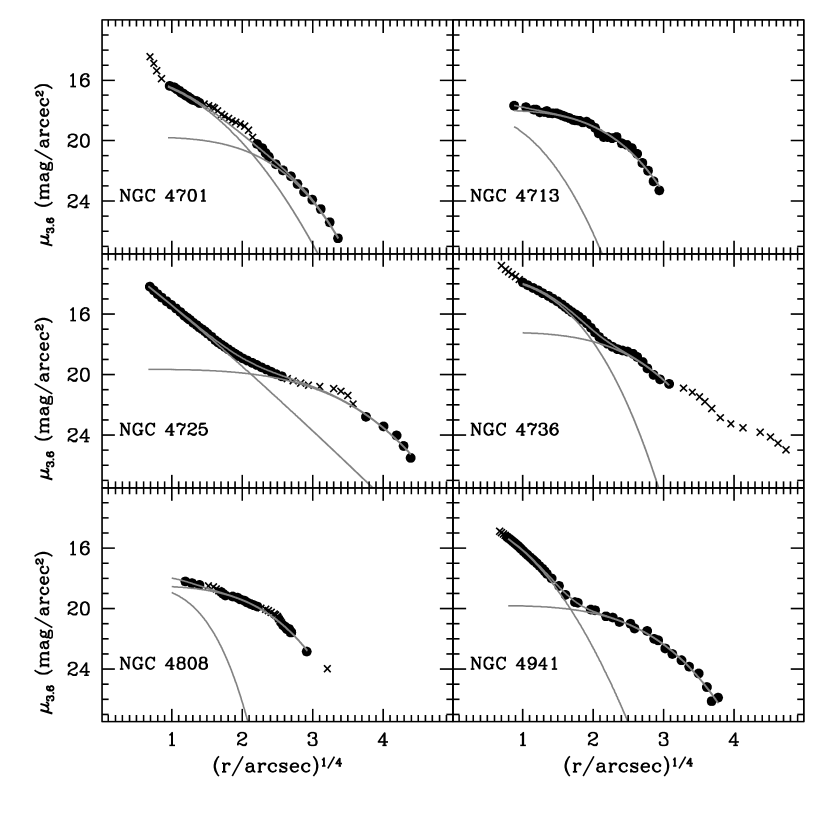
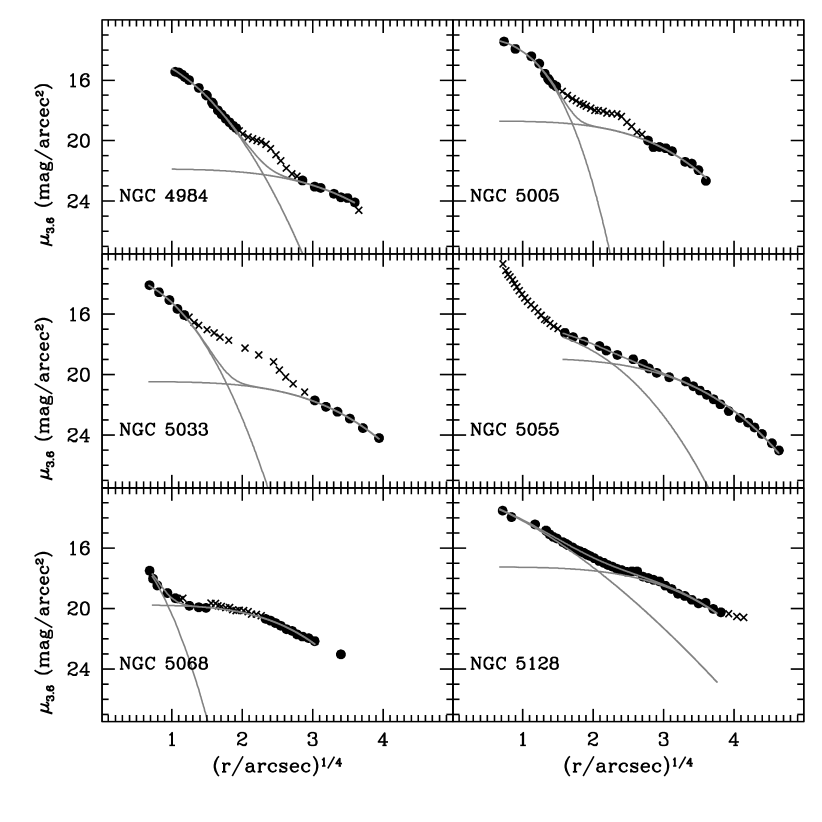
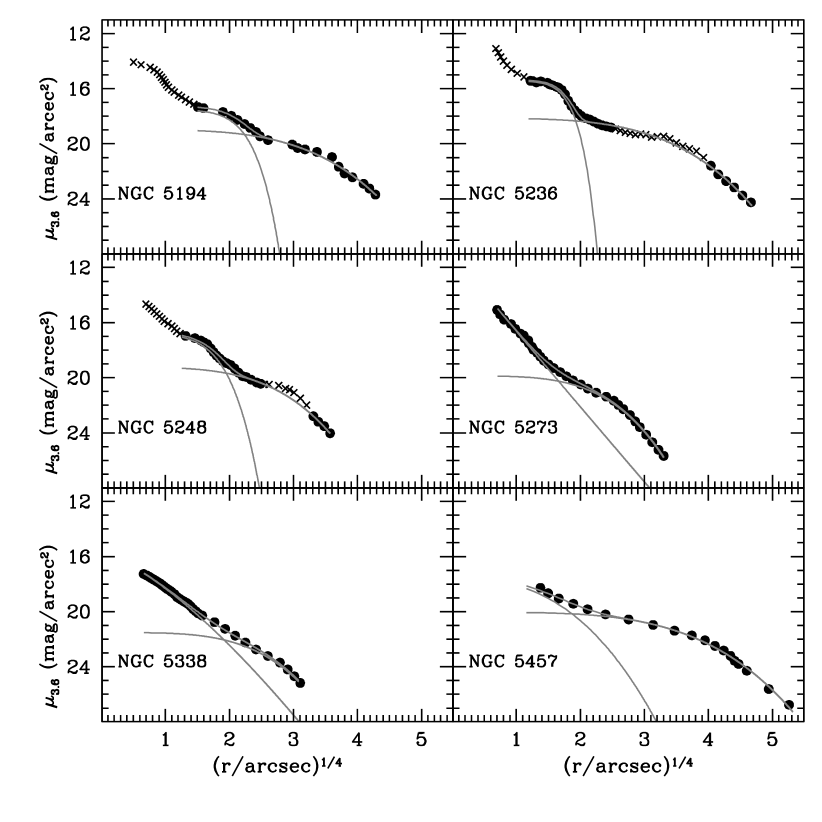
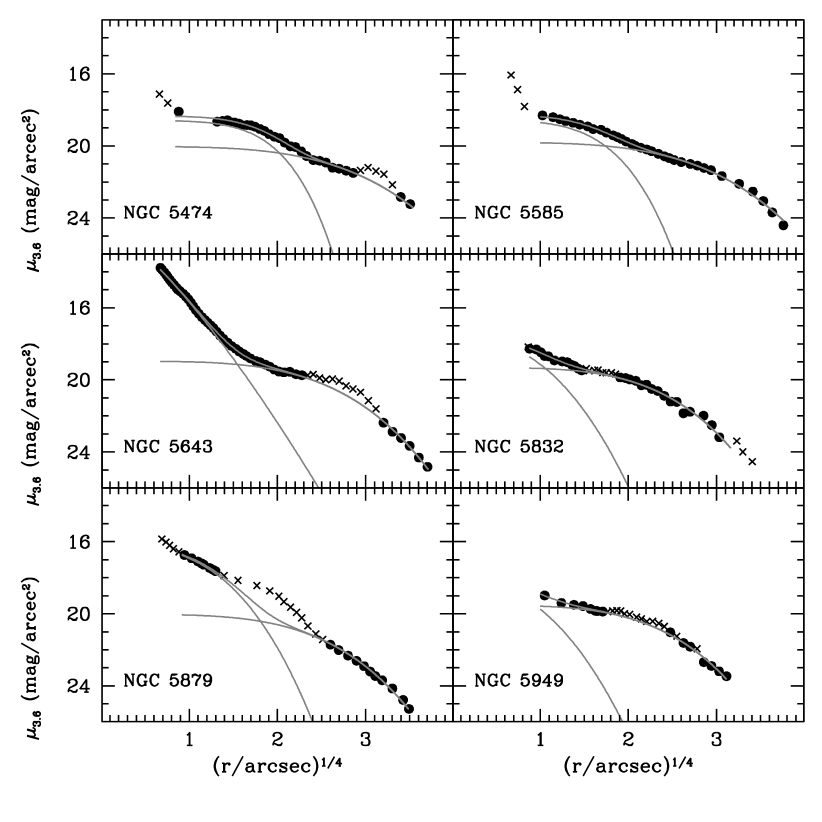
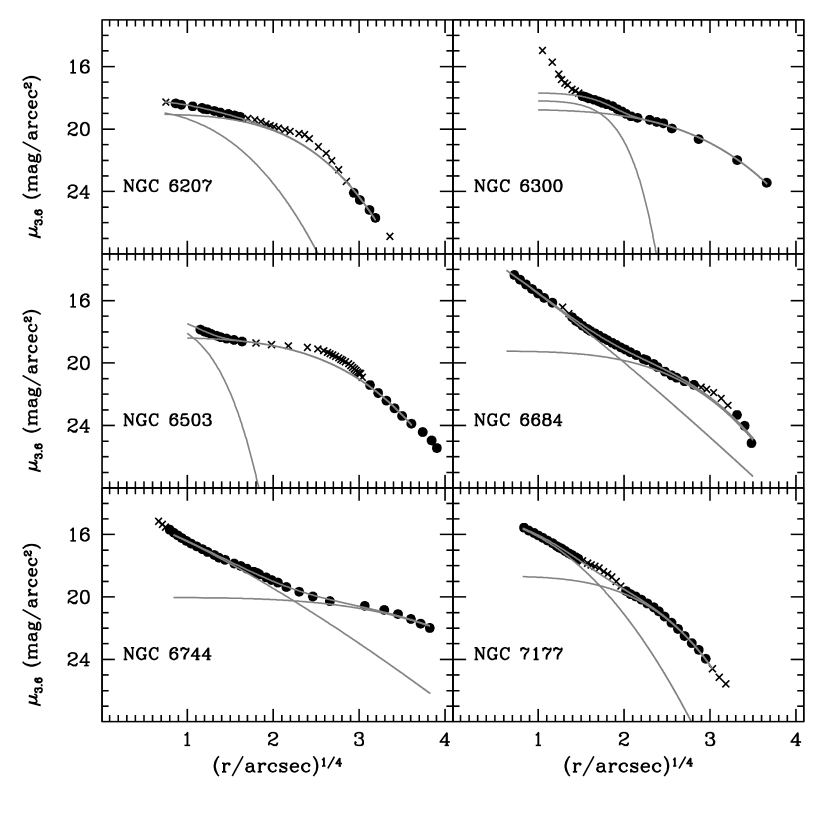
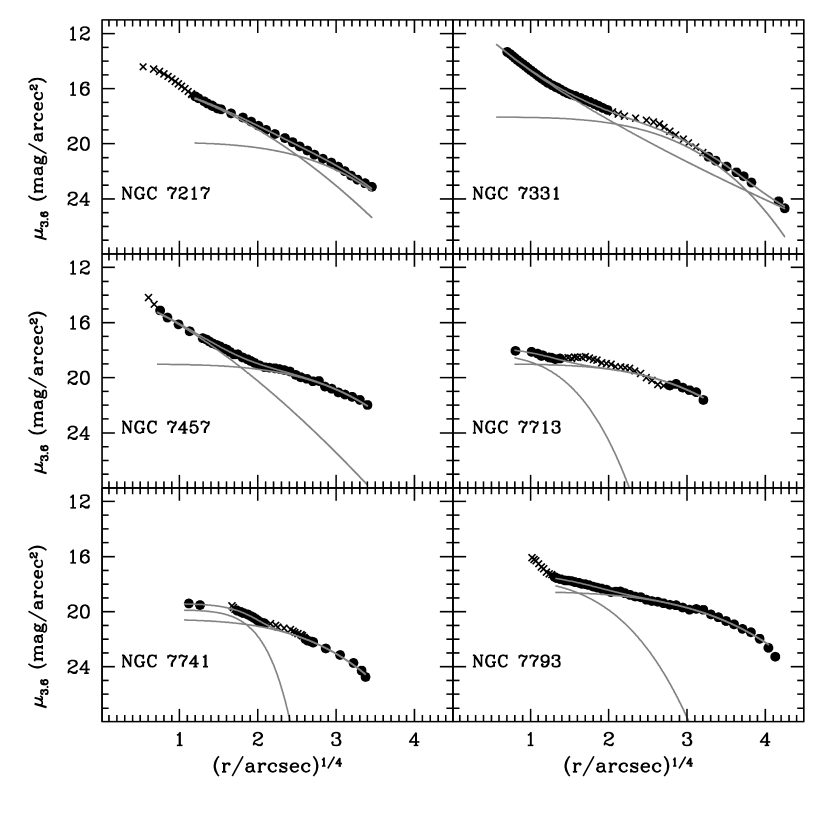
Despite its successes, the Sérsic bulge plus outer exponential disk model of bulge-disk galaxies does not account for many features of galaxy surface brightness profiles. Disks of intermediate type galaxies commonly have features such as bars, rings, and lenses (see Kormendy, 1982 for a description of these). Further, Carollo et al. (2002) show that many bulges of early and intermediate-type galaxies contain nuclei. Bars, rings, lenses, and similar features do not conform to the smooth nature of Eq. 1, hence we carefully exclude regions of the profile perturbed by such structures from the fit. This is a subjective procedure, as it requires selectively removing data from a galaxy’s profile, and undoubtedly has an effect on the resulting parameters. We are often helped to identify bars by the structure of the ellipticity profile, as described in Jogee et al. (2004) and also Marinova & Jogee (2007). For a detailed description of this procedure, and analysis of its effects see the appendix of Fisher & Drory (2008). They find that not accounting for bars can have the affect of increasing by at most 0.5. For those galaxies in which a bar is present, it is our assumption that removing the bar from the fit provides the best estimation of the properties of the underlying bulge and disk. All of our fits are given in tabular form in Table A1 in the appendix A2, and also shown as figures in appendix A2.
3.3. Non-parametric Determination of Bulge Luminosity
In addition to Sérsic fitting we determine the bulge luminosity by a non-parametric method to obtain a second estimate of bulge luminosity and surface density. To isolate the light from the bulge, we must subtract underlying disk light. For this purpose, we fit an exponential profile to the major-axis surface brightness profile of the outer part of the galaxy. The range included in the exponential fit is determined iteratively. Typically, this exponential fit is determined on isophotes with radii larger than the radius which includes 20% of the light. Bars are masked as usual. Note this fit is independent of the fit described in Eq. 1. To account for the variable ellipticity profiles of these disk galaxies we take the mean ellipticity for each component and adjust the luminosity accordingly: . We then calculate the inward extrapolation of the fit to the central (or bulge) region; thus where is the radius containing the light that is in excess of the inward extrapolation of the outer exponential.
3.4. The Effects of Including NICMOS F160W Data


We include HST/NICMOS F160W images in the analysis for all galaxies with available archival data. This is done because it increases dynamic fitting range on the bulge. The composite profile is NICMOS data for r¡1.22 arcsec, and IRAC 3.6 m data at larger radii. Inclusion of the NICMOS data may affect the results in two ways.
First, this procedure assumes a color gradient of zero from -band to -band in our bulges. This assumption introduces a source of uncertainty, yet allows for a more complete description of the stellar light profile. To quantify this uncertainty we calculate the entire radial surface brightness profile in -band using NICMOS and 2MASS data. We then shift that profile to have the same zero point as the IRAC 3.6 m profile, and then calculate the bulge luminosity, which we call . The error in luminosity due to the stitching is the difference scaled by the the fraction of light that comes from the shifted NICMOS F160W data:
| (4) |
This error is typically less than 5% and rarely larger than errors from other sources, such as fitting uncertainty. We use NICMOS data because it is our experience that the high resolution data increases accuracy, even if precision is compromised slightly.
Second, Balcells et al. (2003) find that supplementing ground-based profiles with HST data systematically affects Sérsic index, making it smaller. This effect is certainly distance dependent. Our distance limit is 20 Mpc, closer than most galaxies in Balcells et al. (2003), and likely is nearby enough to prevent this from affecting our profiles. Nonetheless, we carry out a test to determine if any such bias is present.
We re-fit all galaxies that have both HST and SST images. In this second fit we do not include isophotes that have smaller major axis than the half width of the point spread function of IRAC 3.6 m, which is 1.5 arcsec. In most galaxies, we keep all other input parameters exactly the same. However, the space of bulge-disk decomposition that includes a Sérsic bulge can be very complicated and highly degenerate, in some cases reduction of the fit range resulted in independent minima in parameter space. In those cases we are forced to reduce the allowable parameter range accordingly.
Fig. 2 shows the comparison of parameters from decomposition of IRAC-only isophotes to those derived combining NICMOS and IRAC data. The top panel shows Sérsic index, the middle panel half-light radius, and the bottom panel bulge-to-total light ratio. In each panel a solid line representing the line of equality is plotted. Bulges in which the inner cut in the fitting range is larger than the resolution of IRAC are denoted as open circles, all other bulges are denoted as closed circles. We do not include galaxies with , as there parameters are too poorly constrained to be meaningful.

In all properties there is good agreement between both methods of decomposition. Bulge-to-total ratio appears to be the most robust quantity. This is likely due to the degeneracy between surface brightness, radius, and Sérsic index with respect to bulge magnitude. Also, we do not expect the inner truncation radius of the fit to greatly alter fit parameters of outer disk properties in nearby galaxies. Half-light radius also shows good agreement. The most scatter appears to be in Sérsic index, which also shows a slight trend. In bulges with Sérsic index higher than about , the Sérsic index determined from IRAC-only profiles is slightly smaller than that determined with composite SST+HST data. The average of the absolute value of the difference between the lower resolution and higher resolution data is in all cases less than 10%.
4. Identifying Pseudobulges and Classical Bulges
Kormendy & Kennicutt (2004) reviewed in great detail the observational evidence that pseudobulges and classical bulges are two distinct classes of objects. Furthermore, they go on to propose a preliminary list of general observational properties of pseudobulges. These properties include: dynamics that are dominated by rotation (Kormendy, 1993), the bulge is actively forming stars (Kennicutt, 1998), younger stellar populations as indicated by optical colors (Peletier & Balcells, 1996), the bulge has a nearly exponential surface brightness profile (Andredakis & Sanders, 1994), flattening similar to that of their outer disk (Fathi & Peletier, 2003; Kormendy, 1993), nuclear bar (Erwin & Sparke, 2002), nuclear ring, and/or nuclear spiral (Carollo et al., 1997). On the contrary, classical bulges are typically identified as having a relatively featureless morphology, old stellar populations, and hot stellar dynamics.
For brevity we will refer to morphology that resembles disk phenomena (spiral structure, rings and/or bars) as “D-type” morphology, and we will refer to morphology that resembles that of dynamically hot stellar systems (smooth isophotes with little-to-no substructure) as “E-type” morphology.
More recently, Fisher (2006) shows that in non-S0 disk galaxies bulge morphology correlates very well with bulge activity; pseudobulges are actively growing. Also, Fisher & Drory (2008) show that in over 90% of the galaxies in their sample bulges with disk-like morphology have , and all classical bulges have .
4.1. Identifying Pseudobulges with Morphology
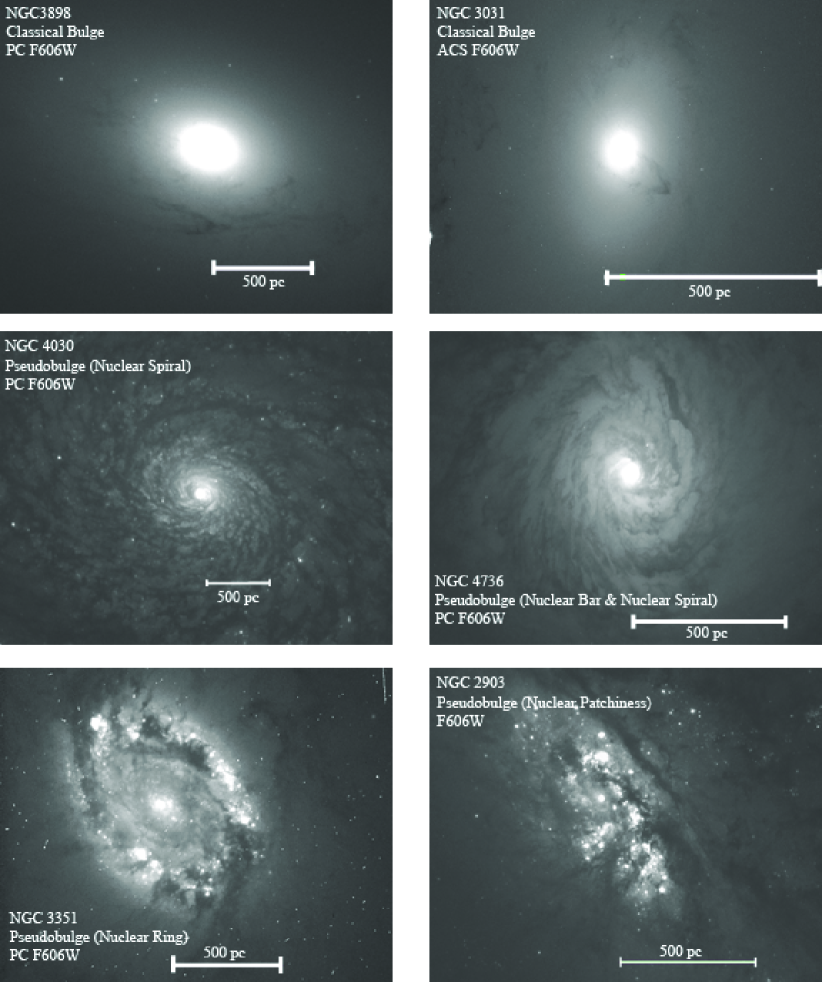
In Fig. 3 we redraw a figure from Fisher et al. (2009) which shows examples of bulges with E-type morphology (top two panels) and bulges with D-type morphology (bottom four panels). The striking contrast between the exemplary D-type and E-type bulges is evident. When the outer disk is not seen, the bulges bulges with E-type morphology appear morphologically indistinguishable from elliptical galaxies. On the other hand the bottom four bulges show pronounced disk phenomena including: nuclear spirals that extend all the way to the center of the galaxy (e.g. NGC 4030 and NGC 4736), small bars that are not much larger than a few hundred parsec across (e.g. NGC 4736), nuclear rings (e.g. NGC3351) and somewhat chaotic nuclear patchiness that is reminiscent of late-type disk galaxies (e.g. NGC 2903). We do not show images of all of our bulges, rather we direct interested readers to the Hubble Legacy Archive 111Hubble Legacy Survey can be found at http://hla.stsci.edu/
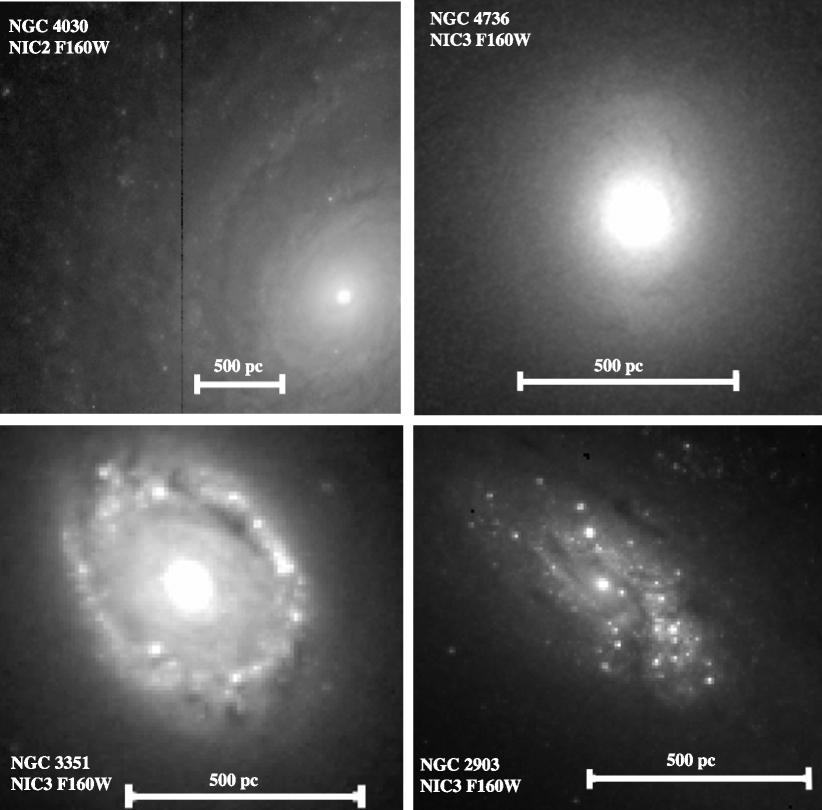
In Fig. 4, we show the images of the bulges with D-type morphology from Fig. 3 taken with NICMOS F160W. In all of these near-IR images, the same features that motivated D-type (hence pseudobulge) classification in the optical bands are still present. Yet, the nuclear spiral in NGC 4736 is much weaker, although the nuclear bar in this bulge is still visible. The features found in the optical are not merely small perturbations caused by dust inside a smooth light distribution, but likely features of the stellar mass distribution.
4.2. Using Mid-IR Color to Identify Star Forming Bulges
Emission in the 8 m channel on Spitzer Space Telescope is dominated by dust, mostly re-radiated light from polycyclic aromatic hydrocarbons (Leger & Puget, 1984). Also, Helou et al. (2004) shows that the 8 m emission in the nearby disk galaxy NGC 300 traces the edges of HII. Thus it is correlated with the number of ionizing photons from young stars, and therefore with local star formation rate.
In Fig. 5 we show the correlation between mid-IR bulge color (from this data set) with specific star formation rate (from overlapping galaxies in Fisher et al., 2009). A linear regression to the data is plotted as a black line. There is an important distinction between the two data sets, Fisher et al. (2009) subtracts an inward extrapolation of the exponential disk for the stellar mass, we do not for this calculation. We find a correlation, with Pearson correlation coefficient , between mid-IR color, , and specific star formation rate.
Calzetti et al. (2007) show that differences in inter-stellar medium metallicity, and likely stellar populations of the galaxy, can strongly affect the correlation between 8 m emission and luminosity of ionizing photons. Given that we are specifically looking at bulges that may have widely varying stellar populations and metallicities, this is an important caveat. However, when studying a large number of bulges, that may be difficult to resolve. The increased resolution of IRAC data over MIPS data is very important. Thus, we limit the interpretation of 8 m emission to an on/off metric of star formation. That is to say, we use the 8 m emission to determine if the bulge is active, and we refrain from using 8 m emission as a means to quantify the star formation rate. In this paper, it is sufficient to merely know if the bulge is active or inactive, and Fig. 5 indicates that mid-IR color is a good estimate in 90% of the bulges. For a detailed discussion of the properties of star formation rates in pseudobulges the interested reader should see Fisher et al. (2009).
4.3. Using Sérsic Index to Identify Bulge Types
Andredakis et al. (1995) showed that bulges in early-type galaxies have larger Sérsic index than those in late-type galaxies. This motivated many authors (e.g. Kormendy & Kennicutt, 2004) to assume that Sérsic index of a bulge is correlated with bulge-type. Fisher & Drory (2008) directly tests this hypothesis and finds that in decomposition in the -band pseudobulges (bulges with D-type morphology) have and classical bulges (with E-type morphology) have . In this paper we will also consider the possibility that Sérsic index can be used to identify bulge types. Also we will retest the connection between bulge Sérsic index and optical bulge morphology with near-IR decompositions that more robustly reflect the stellar light density.
4.4. Comparing Pseudobulge Diagnostics
For the comparison of HST morphology to other bulge diagnostics we use the higher quality data set. This is done to ensure that poorly constrained Sérsic fits or phenomena such as AGNs do not artificially generate ambiguity in bulge diagnostics.
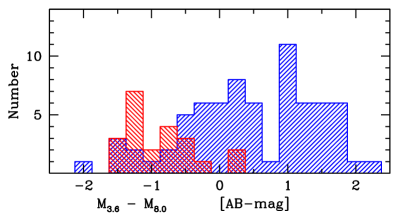
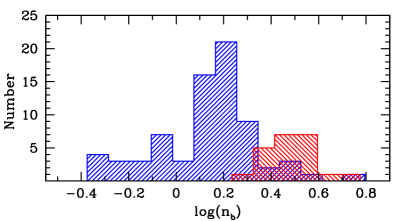
In Fig. 6, we show the distribution of mid-IR color (top) and Sérsic index (bottom) of bulges. In both panels those bulges with D-type morphology (that is pseudobulges) are represented by blue histograms filled with forward slanting lines, and bulges with E-type morphology are represented by red histograms filled with backward slanting lines.
In the top panel of Fig. 6, we show that no bulge with E-type morphology has mid-IR color redder than , and very few (2 of 22) have . However, as found in Fisher et al. (2009), there is a a broad distribution of star formation activity in pseudobulges. Pseudobulges can be both active and inactive. When a bulge is active, in almost every case (96%) that bulge has D-type morphology. Also the majority of bulges with D-type morphology (64%) have mid-IR colors that are redder than any classical bulge. Therefore, use of mid-IR color alone to identify pseudobulges merely finds one type of pseudobulge: active pseudobulges.
In the bottom panel of Fig. 6, we find the same result as found in the V-band by Fisher & Drory (2008): the vast majority (93%) of bulges with D-type morphology have Sérsic index less than . Conversely, all bulges with E-type morphology have Sérsic index greater than two. Only one bulge with E-type morphology has Sérsic index (NGC 1617 has ). This confirms that the correlation between Sérsic index and bulges morphology is independent of wavelength.
In the high quality sample, there are 53 galaxies with positive mid-IR color (based on visual inspection of Fig. 5 this translates very roughly to Gyr-1) and only 6 of those galaxies have a bulge with Sérsic index greater than two; two of those six active high- bulges have E-type morphology. In the high quality sample, we find 18 bulges with low Sérsic index and low specific SFR. The 8 pseudobulges with the lowest specific SFR are all S0 galaxies.
If a bulge has a positive value of , then that bulge is 96% likely to have low-Sérsic index and D-type nuclear morphology (hence be a pseudobulge). However, if the bulge is inactive then there is little we can say about the type of bulge from mid-IR color alone. As found by both Drory & Fisher (2007) and Fisher et al. (2009), some pseudobulges are inactive and also reside in inactive galaxies. The take away is that bulges with E-type morphology are always inactive, and always have . Bulges with D-type morphology almost always have , and usually are active. We will investigate the nature of those bulges that have disk-like nuclear morphology, low Sérsic index but are non-star forming in subsequent sections.
5. Scaling Relations Of Bulge Parameters
5.1. Sérsic Index
Here we turn our attention to the correlations of Sérsic index with other photometric parameters. Fisher & Drory (2008) find with -band decompositions that it is not only the value of the Sérsic index that is different between pseudobulges and classical bulges, but the way that Sérsic index scales with other parameters. However their sample did not contain a significant number of galaxies with low or small . Using our more representative sample, we observe the same result at 3.6 m where light better traces the stellar mass and is less affected by dust.
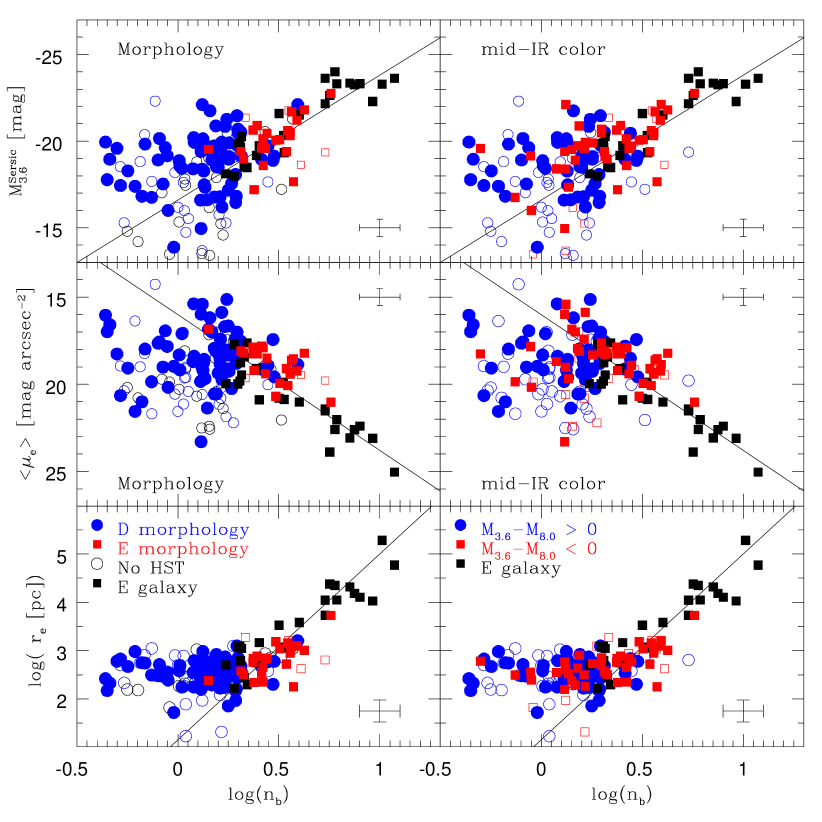
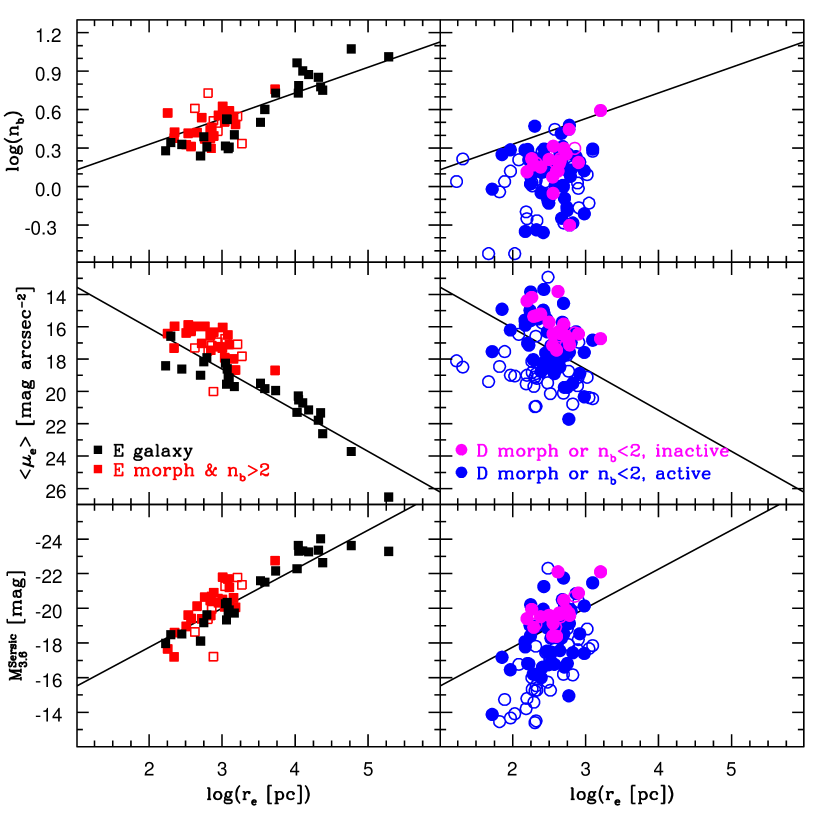
In Fig. 7, we show the correlations of the bulge Sérsic index with half-light radius of the bulge, surface brightness at the half-light radius, and magnitude of the bulge at m (from bottom to top). In all panels we represent elliptical galaxies as black squares. In each panel we also show a black line representing a fit to the elliptical galaxies only. Filled symbols represent high-quality data and open symbols represent data that does not fulfill the requirements of the high-quality dataset. In the left panels we identify bulges based on nuclear morphology; bulges with D-type morphology are represented by blue circles, and those bulges with E-type morphology are represented by red squares. If no optical HST images are available, we plot the bulge as an open black circle. Note that all galaxies in the high quality sample have optical HST data. In the right panels we identify bulges based on activity. Those bulges with mid-IR color , indicating higher specific star formation rate, are represented by blue circles. Those bulges with mid-IR color indicating low specific star formation rates are represented by red squares.
First, we notice the similarity in these scaling relations between bulges with E-type morphology and elliptical galaxies. In each panel, bulges with E-type morphology follow the correlations established by elliptical galaxies. There is slightly more scatter in the bulges with E-type morphology than in the elliptical galaxies alone; however, this is not at all surprising since the presence of an outer disk means that Sérsic function fits to bulges are less well constrained than those in elliptical galaxies.
Also, Kormendy et al. (2009) find that the distribution of Sérsic indices in elliptical galaxies is bimodal and that elliptical galaxies with Sérsic index higher than are almost exclusively giant ellipticals with core profiles in their central region and that show no signs of rotation. Conversely, they find that elliptical galaxies with lower Sérsic index have cuspy centers, are lower in luminosity, and have dynamics indicative of an oblate spheroid that is flattened by rotation. In the bottom panel of Fig. 7, it is clear that bulges with E-type morphology are like low-luminosity ellipticals with Sérsic index less than . This restriction is important for interpreting parameter correlations; the set of classical bulges alone may not always reflect the distribution of all elliptical galaxies.
In Fig. 7, for those bulges with D-type morphology it is clear that no correlation exists between the Sérsic index and half-light radius, surface-brightness, or bulge magnitude. In magnitude and surface brightness, the bulges with D-type morphology appear to be scattered with no regularity. However, the half-light radius of bulges with D-type morphology is limited to a very narrow range in parameter space. We will discuss the half-light radii of bulge types in more detail §7.2.
In the right panels of Fig. 7 we select bulges based on mid-IR color. Because the correlation between Sérsic index and morphology (described in the last section) is so strong, it is not surprising that we see similar behavior here. Bulges with active star formation () show no correlation between Sérsic index and any other bulge structural property shown here. Also, selecting for bulges that are inactive () does not uniquely select for bulges that correlate like elliptical galaxies in parameter space shown in Fig. 7.
These results provide confirmation that the differences in Sérsic index correlations of pseudobulges found in Fisher & Drory (2008) are due to real differences in the distribution of stellar mass. They are not simply due to differences in internal extinction or mass-to-light ratios.
5.2. Photometric Projections of the Fundamental Plane
How different should we expect pseudobulges and classical bulges do be in photometric parameter space? First, pseudobulges and classical bulges do not differ dramatically in bulge-to-total ratio, many of which are in the range – and in Sa to Sc galaxies, disk size and mass does not follow a strong trend (Roberts & Haynes, 1994) with Hubble Type. Therefore, it follows that bulges will be similar in size and luminosity, and thus surface brightness as well. At least some overlap ought to exist between pseudobulges and classical bulges in luminosity, size and surface brightness.
Carollo (1999) shows that pseudobulges deviate toward lower density in the photometric projections of the fundamental plane. Gadotti (2009) uses the Kormendy (1977) relation between to define pseudobulges. They select pseudobulges as those bulges that are more than 1 lower in surface density than the correlation for elliptical galaxies. However, they also find that many of the bulges on the Kormendy (1977) relation have low Sérsic index and also have young stellar populations. It is not clear that using only projections of the fundamental plane can uniquely identify a class of bulges.
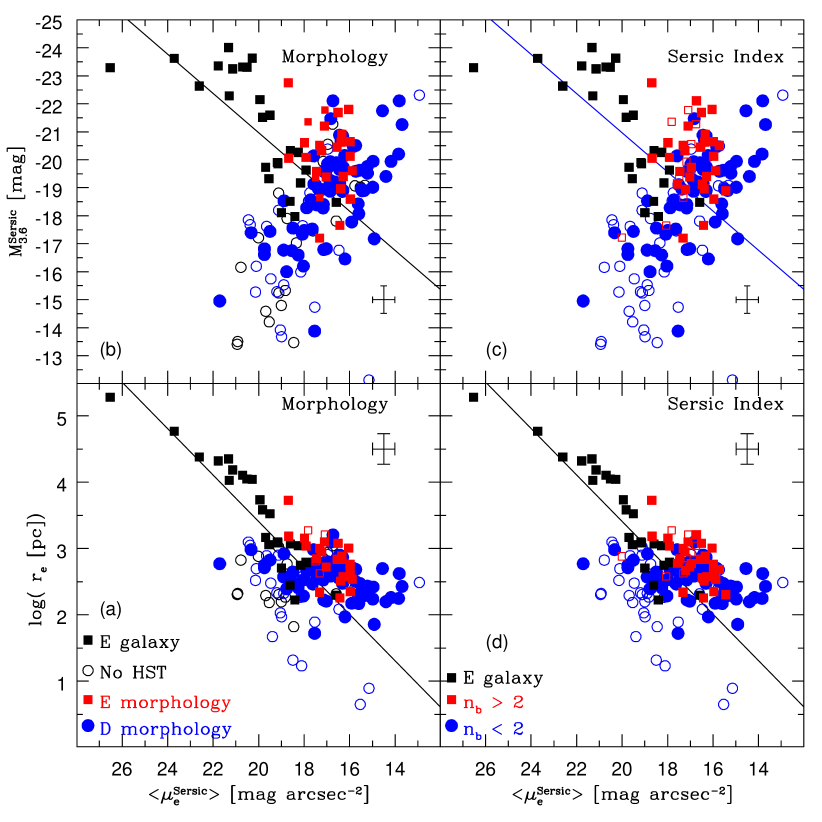
In Fig. 8, we show the Kormendy (1977) relation between (bottom panels a & d) and the correlation between surface brightness and bulge magnitude (top panels b & c). The left panels show the correlations using morphology as the method of identifying pseudobulges and the right panels show these correlations using Sérsic index as a method of diagnosing bulge types. In each panel we also plot a line that represents the corresponding scaling relation fit to the elliptical galaxies only.
Those bulges with E-type morphology and those with are similar to low-luminosity elliptical galaxies in both and the parameter correlation. Kormendy (1977) shows that elliptical galaxies follow a tight positive correlation between size and surface density. Also, in elliptical galaxies more luminous systems are less dense (Kormendy, 1985; Lauer, 1985). We observe similar behavior for classical bulges (identified both through morphology and Sérsic index) in our sample.
A few of the bulges with D-type morphology that also have high Sérsic index appear as red squares in the right two panels (c & d) in Fig. 8, and blue circles in the left two panels (a & b). Two are clearly evident in the parameter space as low-luminosity outliers with respect to the correlation established by elliptical galaxies. For at least these cases the difference in morphology appears to indicate that a physical difference in structure exists, despite the high Sérsic index.
Bulges with D-type morphology and/or those bulges with show little-to-no correlation in the parameter space. Though this is evident by simple inspection, we calculate Pearson’s correlation coefficient for the pseudobulges and find , this is in comparison to for the correlation of ellipticals and classical bulges in the same parameters. (For this calculation, we identify any bulge with disk-like nuclear morphology and/or as a pseudobulge, and all other bulges are classical bulges.)
In Fig 8 (b) & (c), it is clear that bulges with low Sérsic index and those with D-type nuclear morphology establish a correlation that is opposite to the traditional correlation for elliptical galaxies in the plane. As pseudobulges (identified by morphology or Sérsic index) become more luminous they become more dense.
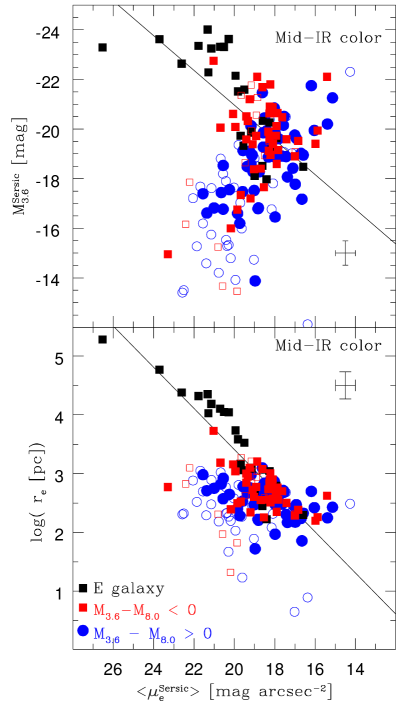
In Fig. 9 we show the same two photometric projections of the fundamental plane, however in this figure bulges are distinguished by the mid-IR color. Those bulges with indicating active star formation are represented by blue circles, and those bulges with indicating low specific star formation rate are represented by red squares. As with Sérsic index and morphology the absence of star formation in a bulge does not select for a unique type of bulge. Therefore, little can be said of a bulge’s position with respect to the fundamental plane based solely on specific star formation rate.
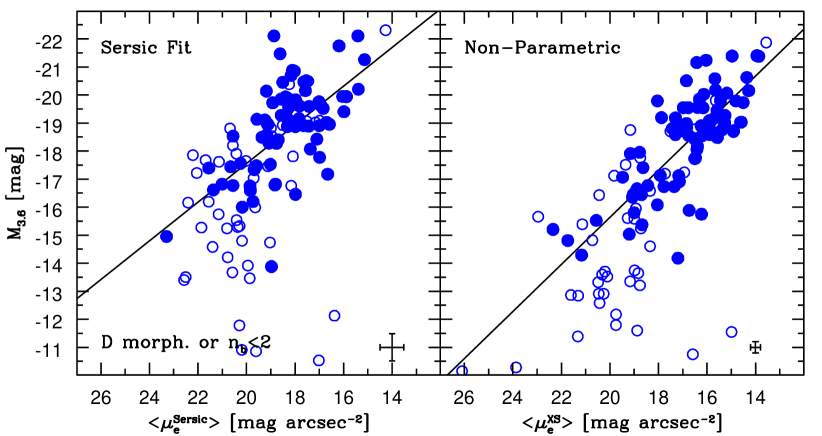
In Fig. 10, we re-plot the parameter space of pseudobulges only. Here pseudobulges are selected as bulges with either D-type morphology or . The black line in each panel represents a fit to all bulges with . Bulges with D-type morphology often have non-Sérsic components (e.g. nuclear rings and nuclear star clusters), and thus Sérsic fits to pseudobulges may be poorly constrained. We therefore measure bulge magnitude and mean surface brightness within the half-light radius non-parametrically, as described in §3.3. The left panel shows parameters derived from the Sérsic decompositions and the right panel shows parameters derived non-parametrically.
Interestingly, the non-parametric correlation shows lower scatter than that of the parametric fits; the Pearson coefficients are for non-parametric and for the Sérsic derived quantities. The scaling relations for non-parametric quantities is
| (5) |
and for the Sérsic derived parameters
| (6) |
Both relations have a positive slope that is slightly more shallow than a linear relationship. The difference between these is quite possibly a result of the non-Sérsic components (e.g. nuclear rings and nuclear star clusters) which may contain higher fractions of the light in lower-luminosity bulges. We note that the lowest magnitude bulges are not on the correlation at all. This may be because they are so low in S/N that the parameters are somewhat meaningless, or perhaps it is not accurate to treat these galaxies as having a bulge at all. We include them on the plot for completeness.
6. Structural Properties of Active and Inactive Bulges
6.1. Inactive Pseudobulges
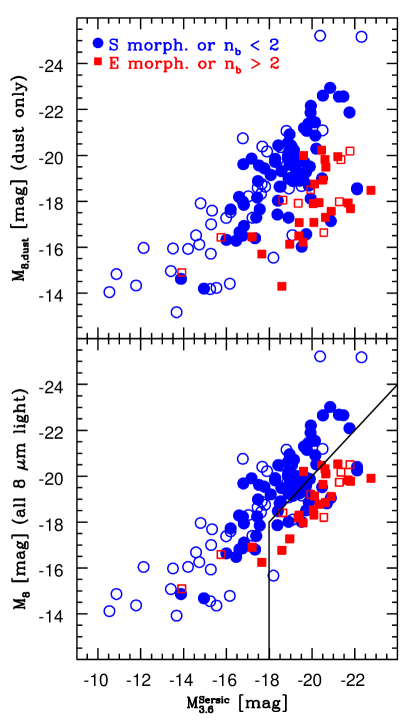
In the top panel of Fig. 11, we compare the magnitude of bulges at 8 m, dominated by dust emission, to the magnitude at 3.6 m, which is almost completely stellar light. We calculate using the relation from Helou et al. (2004), where . For both pseudobulges and classical bulges (diagnosed in this section by the union of nuclear morphology and Sérsic index) there is a positive correlation between bulge the luminosity of the stars at 3.6 m and that of the dust at 8 m. All bulges with 8 m dust emission brighter than are indeed pseudobulges.
It is clear from Figs. 11 & 6 that in those bulges with and E-type nuclear morphology (classical bulges), the 8 m dust emission is lower than the emission at 3.6 m. The average classical bulge is 1.71 mags fainter in 8 m dust flux than in the 3.6 m band. In most bulges with low Sérsic index or D-type nuclear morphology (pseudobulges), the 8 m dust luminosity is typically as bright and often brighter than the stellar luminosity at 3.6 m.
However, a significant minority (16%) of bulges with D-type nuclear morphology or in our sample are bright at 3.6 m but have low dust luminosity. Fisher et al. (2009) notes the existence of bulges with disk-like morphology and low Sérsic index that have low specific star formation rates, using the more precise UV+24 m star formation rate indicator; however, their sample was much smaller, and they did not have as accurate bulge structural parameters. They call these objects “inactive pseudobulges.” Fig. 4 shows NGC 4736 which turns out to be such a case. It is worth noting that, unlike in the 3 other examples which are active pseudobulges, the nuclear spiral that prompted classification of this galaxy as a pseudobulge is much weaker in the near-IR image. However, a nuclear bar (which is a disk feature) is visible, and also the Sérsic index of this bulge is below two.
In the bottom panel of Fig. 11, we show the comparison of bulge magnitude at 3.6 m to bulge light at 8 m without subtracting the stellar contribution. We over-plot a line showing the region in the versus plane which contains 90% of the classical bulges (identified by having both high Sérsic index and E-type nuclear morphology). This yields the boundaries and . We will refer to those bulges with low Sérsic index or disk-like optical morphology, in this region of Fig. 11 as inactive pseudobulges.
In Fig. 12 we show the location of inactive pseudobulges on the and planes. Inactive pseudobulges are represented by magenta circles, all other symbols are the same as Fig. 7. Inactive pseudobulges occupy a region of parameter space where both classical bulges and bright active pseudobulges are found.
Classical bulges and inactive pseudobulges are slightly higher in surface density at a given half-light radius than elliptical galaxies. In fact, we are unable to fit a correlation that simultaneously includes giant ellipticals and inactive pseudobulges. This may be a real feature, however it could also be an effect of how we calculate the 3.6 m zero points for elliptical galaxies. As discussed earlier, we use the Sérsic fits from Kormendy et al. (2009) for elliptical galaxy parameters because this provides a volume limited sample of very well determined Sérsic fits. When the galaxy has Spitzer data we shift the magnitude by the observed when the galaxy is covered with Spitzer, when the galaxy does not we use the mean correction. The elliptical galaxies observed with Spitzer are preferentially brighter, and the deviation we see is in low-luminosity ellipticals. Given that the difference between classical bulges and elliptical galaxies is so small, we cannot know with our data alone if the difference in 3.6 m luminosity between classical bulges and elliptical galaxies is a real effect.
In Fig. 13, we show that inactive pseudobulges almost always have (aside from NGC 4371 which has ). Therefore, in Sérsic index inactive pseudobulges are similar to active pseudobulges and unlike classical bulges. On average, inactive pseudobulges have slightly higher Sérsic index than active pseudobulges. The mean Sérsic index is for inactive pseudobulges and for active pseudobulges. Note that, to calculate the average of the inactive pseudobulges we remove the value for NGC 4371, including the value changes the average to . Also inactive pseudobulges have similar half-light radii as active pseudobulges ( pc and pc respectively).
6.2. Active Pseudobulges
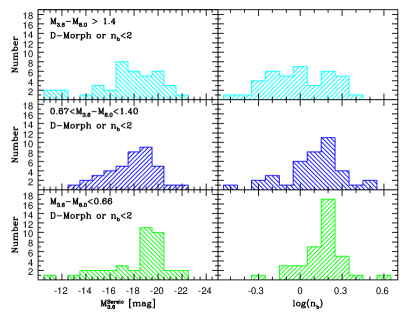
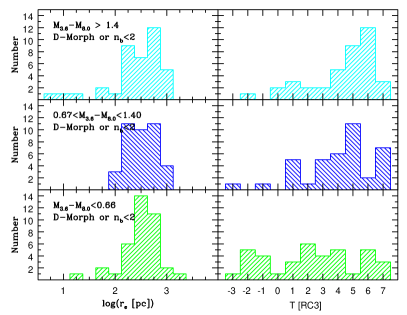
In Figs. 14 & 15 we show the distribution of absolute magnitude of the bulge in 3.6 m (Fig. 14 left), bulge Sérsic index (Fig. 14 right), half-light radius of the bulge (Fig. 15 left) and Hubble type (Fig. 15 right). We have divided the sample of pseudobulges (both high-quality and non high-quality galaxies) into three groups, of equal numbers, based on mid-IR color of the bulge. The ranges of the groups from top to bottom are is less than 0.66 mags, from 0.67 mags to 1.40 mags, and greater than 1.40 mags.
The least active group preferentially contains more luminous pseudobulges. However, this is somewhat by design because at the same 8 m luminosity a bulge that is brighter in 3.6 m will have lower mid-IR color. However, from the mid to high range of mid-IR color there appears to be little-to-no trend with bulge luminosity. There appears to be some change in the distribution of Sérsic indices for active and inactive bulges. In the least active group there is a strong pile up of pseudobulges with and very few pseudobulges with low values of . The high and intermediate activity groups have a large fraction with very low values of Sérsic index. There is only one bulge with in the lowest specific star formation bin. It appears that Sérsic index of the bulge is linked somehow to specific star formation rate, however, that link is not so simple as a one-to-one correlation.
We find little-to-no correlation between mid-IR color and bulge half-light radius. The median of inactive pseudobulges is not very different than the median of the most active group. In Hubble type there is minimal evolution that is as one expects: most of the earlier type galaxies have low specific star formation rate.
7. Discussion
7.1. Identifying Pseudobulges
Morphological identification of pseudobulges is straight-forward and simple. However it is also subjective, and is limited to those bulges with HST images. Therefore, we need to move to more objective methods of pseudobulge identification that are based on quantifiable properties. The Sérsic index has been shown here, and in Fisher & Drory (2008), to be a very good tool for identifying bulges. However, because inactive pseudobulges are so similar to classical bulges in both specific star formation rate and location in photometric projections of the fundamental plane, using Sérsic index alone with no information about stellar populations or star formation appears too simplistic.
We find three important groups of bulges in our sample. Thus we propose the following criteria for diagnosing bulges: Pseudobulges have Sérsic index or nuclear morphology that is similar to a disk galaxy, as described by Kormendy & Kennicutt (2004). Furthermore, Sérsic index and nuclear morphology are tightly correlated. Also, these bulges follow very different structural parameter correlations than elliptical galaxies do. There is not such a clear distinction in mid-IR color (and hence in specific star formation rate). If the bulge is active ( which very roughly corresponds to SFR/M 40 Gyr-1) it almost always has low Sérsic index or disk-like optical morphology. If the bulge is not active then it does not necessarily have a large Sérsic index nor E-type nuclear morphology. We refer to the bulges with low Sérsic index or disk-like nuclear morphology, but are not actively forming stars () as inactive pseudobulges. We suggest that classical bulges are those bulges with both E-type nuclear morphology and . These bulges coincide in parameter space with photometric projections of the fundamental plane, and are inactive.
7.2. What Do Structural Parameters Tell Us About Bulge Formation?
Recently, progress has been made simulating the formation of bulge-disk galaxies in hierarchical clustering scenarios through additional channels such as “clump” instabilities that form in high redshift disks and also secular evolution. The question remains what type of bulges result in these simulations. Robertson et al. (2006) show that rotationally supported disks can be formed in very gas rich mergers which are more likely at high redshift. However, in their suite of simulations the most common result was the formation of bulge-dominated galaxies. The formation of a disk galaxy in a late merger by Governato et al. (2009) is indeed remarkable, however the resulting bulge-to-total ratio of the simulated galaxy of 0.65 is far greater than any pseudobulge in our sample. Likewise, Brook et al. (2007) simulate a major merger which produces a kinematic profile indicative of two nested disks, however the smaller disk is still larger than the typical pseudobulge in our sample. Indeed, the spatial resolution limit in Brook et al. (2007) is barely small enough to resolve the typical pseudobulge in our sample. Elmegreen et al. (2008) finds that clump instabilities in high redshift disk galaxies, as simulated by Noguchi (1999) and more recently Ceverino et al. (2009), are most likely to form bulges that resemble classical bulges. Debattista et al. (2004) simulates bulge formation via internal disk evolution with collisionless -body simulations. They find that simulated bulges built via secular evolution are able to maintain a low Sérsic index. However, Fisher et al. (2009) show that present day star formation leads to a significant addition of stellar mass to pseudobulges, and therefore star formation and gas physics cannot be neglected. Eliche-Moral et al. (2006) simulate the growth of bulges in minor mergers using collisionless -body simulations, and finds that merging increases the Sérsic index of bulges from to roughly . Though, by neglecting star formation and dissipative processes it becomes difficult to interpret their results. Unfortunately, simulating galaxies with stars, gas, and star formation is a difficult and computing-time-intensive process. It is therefore rare that a simulation has a fine enough spatial resolution to resolve the bulge for accurate Sérsic decomposition. However, it is fairly well accepted that elliptical galaxies are the result of mergers (recently Kormendy et al., 2009). Thus, if bulges have different scaling relations than elliptical galaxies, we can thus stipulate that either they did not form in mergers, or something was significantly different about the mergers (e.g. gas fraction or mass ratio) to generate the different scaling relations.
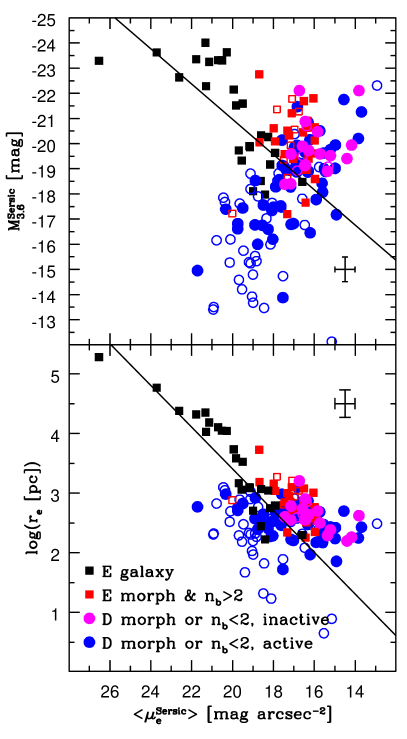
Pseudobulges in our sample show little-to-no correlation between half-light radius and any other bulge parameter. In Fig. 16, we re-illustrate the correlations of half-light radius with bulge magnitude (bottom), mean surface brightness (middle), and Sérsic index (top). For clarity, in this figure we plot classical bulges and elliptical galaxies (left) separate from pseudobulges and inactive pseudobulges (right). In each panel we also show a black line representing the a regression fit to the elliptical galaxies and classical bulges for the associated parameters. Over a 9 mag difference in bulge magnitude, pseudobulges remain roughly constant in size. There is no change with surface brightness nor with Sérsic index. Due to inherent parameter correlations in hot, virialized systems (like the fundamental plane) it would be essentially impossible for two pseudobulges to have roughly the same half-light radius, and be 9 magnitudes different in luminosity.
In Figs. 8, 10, & 12 we show that pseudobulges have a positive correlation in . We show this with luminosity and surface brightness derived from Sérsic fits and from non-parametric measurements of bulge luminosity and density, thus it is not likely a relic of correlated errors in Sérsic fits.
How might a pseudobulge grow its mass without increasing size? Fisher et al. (2009) find that the star formation rate surface density of pseudobulges correlates with stellar bulge mass and surface density of stellar mass in such a way that more massive bulges have higher star formation rate densities. If pseudobulges begin with very low mass, but a variety of star formation rate densities, then after a period of time those bulges with higher star formation rate density will have higher stellar mass density. In this scenario the total mass of the bulge has not changed, but rather a mass element has changed state from cold gas to stars. Therefore a star in orbit within the bulge remains unaffected by the increase in stellar mass. Thus as stellar bulge mass increases, but the size of the bulge does not. Furthermore, this means that the surface brightness and bulge luminosity of the star light should be positively correlated, which indeed is what we observe.
7.3. Are Inactive Pseudobulges Transition Objects?
Both Drory & Fisher (2007) and Fisher et al. (2009) find pseudobulges that are either residing in non-star forming galaxies or non-star forming themselves. They are identified as pseudobulges by nuclear morphology and Sérsic index. It is worth noting that this finding illustrates the necessity of combining information about the ISM or stellar populations with other pseudobulge indicators, such as Sérsic index and morphology. In § 6.1 we show that non-star forming pseudobulges indeed exists in our sample as well.
In Fig. 12, we show that inactive pseudobulges are not inconsistent with the parameter correlations set by classical bulges and elliptical galaxies. However, it is not obvious that they would establish those correlations themselves. We have shown that inactive pseudobulges are like active pseudobulges in two ways (morphology and Sérsic index) and like classical bulges in two ways (parameter correlations and specific star formation rate), though there similarity to classical bulges in activity is by definition. Therefore, observationally speaking they are ambiguous objects.
Fisher et al. (2009) find that in all bulges there is measurable star formation in progress. However, in classical bulges that star formation is unimportant when compared to the stellar mass of the bulge. Furthermore, correlations between star formation rate density and the stellar mass of the bulge and disk only exist for pseudobulges, and the star formation is capable of doubling the pseudobulge stellar mass in relatively short times. They conclude that internal bulge growth is a nearly ubiquitous phenomenon. It is simply not important in classical-bulge galaxies. Also, in later-type galaxies many studies (e.g. Carollo et al., 2007; MacArthur et al., 2009) show that pseudobulges can have large populations of old stars within a young bulge. Therefore there is room in the stellar population budget for a low-luminosity classical bulge. If these are both true then it would make sense that there be some cases where the pseudobulge and classical bulge are similar mass.
What we wish to estimate is what would we observe if a low Sérsic pseudobulge were to exist in the same location as a classical bulge. To study this we select two classical bulge galaxies, NGC 3521 and NGC 2841, and add a model pseudobulge to the profile. We then decompose the resulting using Eq. 1. Both galaxies are chosen because the original decomposition unaffected by non-Sérsic components (e.g. bars and/or rings), and the Sérsic index is well determined. The original Sérsic indices of the real bulges are and , respectively. We choose the model pseudobulge in all cases to have and we fix the size according to the scaling relation between pseudobulge size and disk scale length (Courteau et al., 1996; MacArthur et al., 2003; Fisher & Drory, 2008), we choose . We then scale the pseudobulge luminosity to , , , and that of the classical bulge. Note that these relative weights are for the pseudobulges (and classical bulge) 3.6 m luminosity only. If these two different bulge components have different mass-to-light ratios stemming from having very different star formation histories, then a more sophisticated method would need to be applied. Yet for our purposes, a description of the luminosity is most important. We decompose the resulting profile as usual, using Eq. 1, with a single Sérsic function for the bulge and an exponential outer disk. The resulting profile of the composite bulge galaxy is well fit by a Sérsic function bulge and exponential outer disk. In the two cases with a high classical bulge Sérsic index, and the we observe a small cusp in the profile that looks similar to a nucleus. No other peculiarities are visible in the constructed surface brightness profiles.
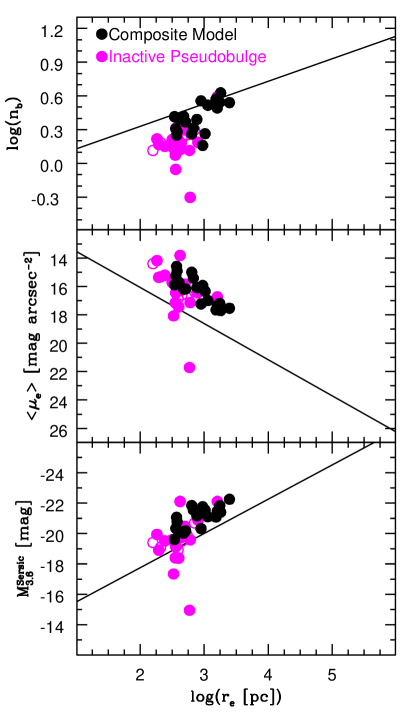
In Fig. 17 we investigate the location of the composite pseudo+classical bulge models we describe above. The black lines are from fits to classical bulges and elliptical galaxies. The magenta circles represent the inactive pseudobulges from our survey, and the black circles represent the composite model systems. The composites are in exactly the same location as the inactive pseudobulges. In every case, addition of a pseudobulge component to the classical bulge galaxy results in lowering the Sérsic index. In the case in which the classical bulge has when the resulting Sérsic index of the composite system is less than two. For the case in which the classical bulge has a larger Sérsic index () the Sérsic index of the composite bulge only falls below for the most extreme case in which . Given that the mean Sérsic index of inactive pseudobulges is , if this is indeed what is occurring in inactive pseudobulges then the underlying classical bulges in inactive pseudobulges would need to have smaller Sérsic index.
Fisher et al. (2009) find that in all bulge types there is bulge growth via internal star formation. However, in classical bulges the specific star formation is very low, unlike in pseudobulges where specific star formation rates are higher. The results of Fisher et al. (2009) and the results of this experiment suggest that almost every bulge has a component of new stars. In classical bulges the light of the new stars is unimportant. In pseudobulges the new stars dominant the light of the bulge component. The inactive pseudobulges may be systems in which the two components (old and young) have similar luminosity and the classical component has a low Sérsic index. The questions remain: Is there a low-luminosity cut off below which old components no longer exists? Also, is the old component of stars in pseudobulges (both active and inactive) compatible with the properties of a typical classical bulge?
8. Summary & Conclusions
In this paper we develop a set of pseudobulge diagnostics that incorporate morphology, Sérsic index, and specific star formation rate. To accomplish this we carry out bulge-disk decompositions on 173 E-Sd galaxies in the Spitzer IRAC 3.6 m band. We also measure the 3.6-8.0 m color as a rough estimate of specific star formation for all S0-Sd galaxies in the sample. We include in the appendix a list of notes on bulge diagnosis for all S0-Sd galaxies in our sample.
We find that Sérsic index and morphology are essentially interchangeable at 3.6 m as a means of identifying pseudobulges and classical bulges, confirming the results of Fisher & Drory (2008) with near-IR data. Pseudobulges have and classical bulges have . Furthermore, with a much more robust sample we confirm that the Sérsic index of pseudobulges is uncorrelated with other bulge structural properties.
A careful investigation of van Albada’s (1982) result shows that simulated elliptical galaxies formed via more violent collapses and lumpier initial conditions create resulting surface brightness profiles with larger Sérsic index. Also, Eliche-Moral et al. (2006) studies minor mergers onto disks with collisionless -body simulations and finds that mergers in general drive the Sérsic index of the bulge component up. Also, Hopkins et al. (2009) finds that more merging generates larger Sérsic index. All three of these results seem fairly straight-forward and quite intuitive. Surface brightness profiles with larger Sérsic index are characterized by having more light in the tail of the distribution. Also, violent relaxation is a mechanism that can easily convert ordered-rotational orbits to radial orbits, which in turn puts more stellar light at larger radius. Thus more merging, and hence more violent relaxation, puts more stellar mass at large radius which in turn drives up Sérsic index. Thus at the minimum the now quite robust result that pseudobulges are marked by having very low Sérsic index seems to indicate that they have a more passive history than classical bulges and elliptical galaxies.
We also study a group of pseudobulges (as indicated by Sérsic index and nuclear morphology) who are located in the same location in vs. parameter space. We call these bulges “inactive pseudobulges”. We make a selection of and ; note a similar (but much smaller) group of bulges was found by Fisher et al. (2009)). We show that those inactive pseudobulges are very similar to models of galaxies in which both a pseudobulge and classical bulge exist in roughly equal parts and the classical bulges has a low Sérsic index. Additionally, star formation in inactive pseudobulges must be suppressed. Therefore, pseudobulge identification that relies only on structural indicators is unable to detect composite systems. Also pseudobulge identification that relies only on stellar populations or star formation rates will underestimate the number of pseudobulges significantly.
We also show that pseudobulges and classical bulges differ in fundamental plane scaling relations. We find that the half-light radius of pseudobulges does not correlate with any other bulge parameter. Across 9 magnitudes in luminosity we find that the radial size of pseudobulges changes only slightly. Thus it appears that the only parameter in bulge-disk decompositions which is linked to pseudobulge half-light radius is the scale length of the outer disk. We find a positive correlation among pseudobulges between mean surface brightness and bulge luminosity. Pseudobulges that are more luminous are more dense. This relation is opposite that of classical bulges and elliptical galaxies, and implies that pseudobulges are very different types of objects than elliptical galaxies.
References
- Andredakis et al. (1995) Andredakis, Y. C., Peletier, R. F., & Balcells, M. 1995, MNRAS, 275, 874
- Andredakis & Sanders (1994) Andredakis, Y. C., & Sanders, R. H. 1994, MNRAS, 267, 283
- Athanassoula (2005) Athanassoula, E. 2005, MNRAS, 358, 1477
- Balcells et al. (2003) Balcells, M., Graham, A. W., Domínguez-Palmero, L., & Peletier, R. F. 2003, ApJ, 582, L79
- Balcells et al. (2007) Balcells, M., Graham, A. W., & Peletier, R. F. 2007, ApJ, 665, 1104
- Bender et al. (1992) Bender, R., Burstein, D., & Faber, S. M. 1992, ApJ, 399, 462
- Bender & Moellenhoff (1987) Bender, R., & Moellenhoff, C. 1987, A&A, 177, 71
- Bower et al. (1992) Bower, R. G., Lucey, J. R., & Ellis, R. S. 1992, MNRAS, 254, 601
- Brook et al. (2007) Brook, C., Richard, S., Kawata, D., Martel, H., & Gibson, B. K. 2007, ApJ, 658, 60
- Calzetti et al. (2007) Calzetti, D., Kennicutt, R. C., Engelbracht, C. W., Leitherer, C., Draine, B. T., Kewley, L., Moustakas, J., Sosey, M., Dale, D. A., Gordon, K. D., Helou, G. X., Hollenbach, D. J., Armus, L., Bendo, G., Bot, C., Buckalew, B., Jarrett, T., Li, A., Meyer, M., Murphy, E. J., Prescott, M., Regan, M. W., Rieke, G. H., Roussel, H., Sheth, K., Smith, J. D. T., Thornley, M. D., & Walter, F. 2007, ApJ, 666, 870
- Carollo (1999) Carollo, C. M. 1999, ApJ, 523, 566
- Carollo et al. (2007) Carollo, C. M., Scarlata, C., Stiavelli, M., Wyse, R. F. G., & Mayer, L. 2007, ApJ, 658, 960
- Carollo et al. (1997) Carollo, C. M., Stiavelli, M., de Zeeuw, P. T., & Mack, J. 1997, AJ, 114, 2366
- Carollo et al. (2002) Carollo, C. M., Stiavelli, M., Seigar, M., de Zeeuw, P. T., & Dejonghe, H. 2002, AJ, 123, 159
- Ceverino et al. (2009) Ceverino, D., Dekel, A., & Bournaud, F. 2009, ArXiv e-prints
- Combes (2009) Combes, F. 2009, ArXiv e-prints
- Courteau et al. (1996) Courteau, S., de Jong, R. S., & Broeils, A. H. 1996, ApJ, 457, L73+
- Dale et al. (2009) Dale, D. A., Cohen, S. A., Johnson, L. C., Schuster, M. D., Calzetti, D., Engelbracht, C. W., Gil de Paz, A., Kennicutt, R. C., Lee, J. C., Begum, A., Block, M., Dalcanton, J. J., Funes, J. G., Gordon, K. D., Johnson, B. D., Marble, A. R., Sakai, S., Skillman, E. D., van Zee, L., Walter, F., Weisz, D. R., Williams, B., Wu, S. ., & Wu, Y. 2009, ArXiv e-prints
- de Jong et al. (2004) de Jong, R. S., Simard, L., Davies, R. L., Saglia, R. P., Burstein, D., Colless, M., McMahan, R., & Wegner, G. 2004, MNRAS, 355, 1155
- de Vaucouleurs et al. (1991) de Vaucouleurs, G., de Vaucouleurs, A., Corwin, Jr., H. G., Buta, R. J., Paturel, G., & Fouque, P. 1991, Third Reference Catalogue of Bright Galaxies (Volume 1-3, XII, 2069 pp. 7 figs.. Springer-Verlag Berlin Heidelberg New York)
- Debattista et al. (2004) Debattista, V. P., Carollo, C. M., Mayer, L., & Moore, B. 2004, ApJ, 604, L93
- Djorgovski & Davis (1987) Djorgovski, S., & Davis, M. 1987, ApJ, 313, 59
- Dressler et al. (1987) Dressler, A., Lynden-Bell, D., Burstein, D., Davies, R. L., Faber, S. M., Terlevich, R., & Wegner, G. 1987, ApJ, 313, 42
- Drory & Fisher (2007) Drory, N., & Fisher, D. B. 2007, ApJ, 664, 640
- Eliche-Moral et al. (2006) Eliche-Moral, M. C., Balcells, M., Aguerri, J. A. L., & González-García, A. C. 2006, A&A, 457, 91
- Elmegreen et al. (2008) Elmegreen, B. G., Bournaud, F., & Elmegreen, D. M. 2008, ApJ, 688, 67
- Erwin & Sparke (2002) Erwin, P., & Sparke, L. S. 2002, AJ, 124, 65
- Faber et al. (1989) Faber, S. M., Wegner, G., Burstein, D., Davies, R. L., Dressler, A., Lynden-Bell, D., & Terlevich, R. J. 1989, ApJS, 69, 763
- Falcón-Barroso et al. (2002) Falcón-Barroso, J., Peletier, R. F., & Balcells, M. 2002, MNRAS, 335, 741
- Fathi & Peletier (2003) Fathi, K., & Peletier, R. F. 2003, A&A, 407, 61
- Fisher (2006) Fisher, D. B. 2006, ApJ, 642, L17
- Fisher & Drory (2008) Fisher, D. B., & Drory, N. 2008, AJ, 136, 773
- Fisher et al. (2009) Fisher, D. B., Drory, N., & Fabricius, M. H. 2009, ApJ, 697, 630
- Gadotti (2008) Gadotti, D. A. 2008, MNRAS, 384, 420
- Gadotti (2009) —. 2009, MNRAS, 393, 1531
- Gadotti & dos Anjos (2001) Gadotti, D. A., & dos Anjos, S. 2001, AJ, 122, 1298
- Governato et al. (2009) Governato, F., Brook, C. B., Brooks, A. M., Mayer, L., Willman, B., Jonsson, P., Stilp, A. M., Pope, L., Christensen, C., Wadsley, J., & Quinn, T. 2009, MNRAS, 398, 312
- Graham & Colless (1997) Graham, A., & Colless, M. 1997, MNRAS, 287, 221
- Graham (2001) Graham, A. W. 2001, AJ, 121, 820
- Graham & Driver (2005) Graham, A. W., & Driver, S. P. 2005, Publications of the Astronomical Society of Australia, 22, 118
- Helfer et al. (2003) Helfer, T. T., Thornley, M. D., Regan, M. W., Wong, T., Sheth, K., Vogel, S. N., Blitz, L., & Bock, D. C.-J. 2003, ApJS, 145, 259
- Helou et al. (2004) Helou, G., Roussel, H., Appleton, P., Frayer, D., Stolovy, S., Storrie-Lombardi, L., Hurt, R., Lowrance, P., Makovoz, D., Masci, F., Surace, J., Gordon, K. D., Alonso-Herrero, A., Engelbracht, C. W., Misselt, K., Rieke, G., Rieke, M., Willner, S. P., Pahre, M., Ashby, M. L. N., Fazio, G. G., & Smith, H. A. 2004, ApJS, 154, 253
- Hopkins et al. (2009) Hopkins, P. F., Hernquist, L., Cox, T. J., Keres, D., & Wuyts, S. 2009, ApJ, 691, 1424
- Jogee et al. (2004) Jogee, S., Barazza, F. D., Rix, H.-W., Shlosman, I., Barden, M., Wolf, C., Davies, J., Heyer, I., Beckwith, S. V. W., Bell, E. F., Borch, A., Caldwell, J. A. R., Conselice, C. J., Dahlen, T., Häussler, B., Heymans, C., Jahnke, K., Knapen, J. H., Laine, S., Lubell, G. M., Mobasher, B., McIntosh, D. H., Meisenheimer, K., Peng, C. Y., Ravindranath, S., Sanchez, S. F., Somerville, R. S., & Wisotzki, L. 2004, ApJ, 615, L105
- Jogee et al. (2005) Jogee, S., Scoville, N., & Kenney, J. D. P. 2005, ApJ, 630, 837
- Kennicutt et al. (2003) Kennicutt, R. C., Armus, L., Bendo, G., Calzetti, D., Dale, D. A., Draine, B. T., Engelbracht, C. W., Gordon, K. D., Grauer, A. D., Helou, G., Hollenbach, D. J., Jarrett, T. H., Kewley, L. J., Leitherer, C., Li, A., Malhotra, S., Regan, M. W., Rieke, G. H., Rieke, M. J., Roussel, H., Smith, J.-D. T., Thornley, M. D., & Walter, F. 2003, PASP, 115, 928
- Kennicutt (1998) Kennicutt, Jr., R. C. 1998, ARA&A, 36, 189
- Kennicutt et al. (1994) Kennicutt, Jr., R. C., Tamblyn, P., & Congdon, C. E. 1994, ApJ, 435, 22
- Kormendy (1977) Kormendy, J. 1977, ApJ, 218, 333
- Kormendy (1982) Kormendy, J. 1982, in Saas-Fee Advanced Course 12: Morphology and Dynamics of GalaxiesSaas-Fee Vol. 12: Morphology and Dynamics of Galaxies, 113–288
- Kormendy (1985) —. 1985, ApJ, 295, 73
- Kormendy (1993) Kormendy, J. 1993, in IAU Symp. 153: Galactic Bulges, 209–+
- Kormendy & Fisher (2005) Kormendy, J., & Fisher, D. B. 2005, in Revista Mexicana de Astronomia y Astrofisica Conference Series, Vol. 23, Revista Mexicana de Astronomia y Astrofisica Conference Series, ed. S. Torres-Peimbert & G. MacAlpine, 101–108
- Kormendy et al. (2009) Kormendy, J., Fisher, D. B., Cornell, M. E., & Bender, R. 2009, ApJS, 182, 216
- Kormendy & Kennicutt (2004) Kormendy, J., & Kennicutt, R. C. 2004, ARA&A, 42, 603
- Lauer (1985) Lauer, T. R. 1985, ApJ, 292, 104
- Leger & Puget (1984) Leger, A., & Puget, J. L. 1984, A&A, 137, L5
- MacArthur et al. (2003) MacArthur, L. A., Courteau, S., & Holtzman, J. A. 2003, ApJ, 582, 689
- MacArthur et al. (2009) MacArthur, L. A., González, J. J., & Courteau, S. 2009, MNRAS, 395, 28
- Marinova & Jogee (2007) Marinova, I., & Jogee, S. 2007, ApJ, 659, 1176
- Noguchi (1999) Noguchi, M. 1999, ApJ, 514, 77
- Peletier & Balcells (1996) Peletier, R. F., & Balcells, M. 1996, AJ, 111, 2238
- Phillips et al. (1996) Phillips, A. C., Illingworth, G. D., MacKenty, J. W., & Franx, M. 1996, AJ, 111, 1566
- Regan et al. (2001) Regan, M. W., Thornley, M. D., Helfer, T. T., Sheth, K., Wong, T., Vogel, S. N., Blitz, L., & Bock, D. C.-J. 2001, ApJ, 561, 218
- Renzini (1999) Renzini, A. 1999, in The Formation of Galactic Bulges, ed. C. M. Carollo, H. C. Ferguson, & R. F. G. Wyse, 9–+
- Roberts & Haynes (1994) Roberts, M. S., & Haynes, M. P. 1994, ARA&A, 32, 115
- Robertson et al. (2006) Robertson, B., Bullock, J. S., Cox, T. J., Di Matteo, T., Hernquist, L., Springel, V., & Yoshida, N. 2006, ApJ, 645, 986
- Sandage & Bedke (1994) Sandage, A., & Bedke, J. 1994, The Carnegie atlas of galaxies (Washington, DC: Carnegie Institution of Washington with The Flintridge Foundation, —c1994)
- Scarlata et al. (2004) Scarlata, C., Stiavelli, M., Hughes, M. A., Axon, D., Alonso-Herrero, A., Atkinson, J., Batcheldor, D., Binney, J., Capetti, A., Carollo, C. M., Dressel, L., Gerssen, J., Macchetto, D., Maciejewski, W., Marconi, A., Merrifield, M., Ruiz, M., Sparks, W., Tsvetanov, Z., & van der Marel, R. P. 2004, AJ, 128, 1124
- Sersic (1968) Sersic, J. L. 1968, Atlas de galaxias australes (Cordoba, Argentina: Observatorio Astronomico, 1968)
- Sheth et al. (2005) Sheth, K., Vogel, S. N., Regan, M. W., Thornley, M. D., & Teuben, P. J. 2005, ApJ, 632, 217
- Simien & de Vaucouleurs (1986) Simien, F., & de Vaucouleurs, G. 1986, ApJ, 302, 564
- Skrutskie et al. (2006) Skrutskie, M. F., Cutri, R. M., Stiening, R., Weinberg, M. D., Schneider, S., Carpenter, J. M., Beichman, C., Capps, R., Chester, T., Elias, J., Huchra, J., Liebert, J., Lonsdale, C., Monet, D. G., Price, S., Seitzer, P., Jarrett, T., Kirkpatrick, J. D., Gizis, J. E., Howard, E., Evans, T., Fowler, J., Fullmer, L., Hurt, R., Light, R., Kopan, E. L., Marsh, K. A., McCallon, H. L., Tam, R., Van Dyk, S., & Wheelock, S. 2006, AJ, 131, 1163
- Tonry et al. (2001) Tonry, J. L., Dressler, A., Blakeslee, J. P., Ajhar, E. A., Fletcher, A. B., Luppino, G. A., Metzger, M. R., & Moore, C. B. 2001, ApJ, 546, 681
- Tully & Fisher (1988) Tully, R. B., & Fisher, J. R. 1988, Catalog of Nearby Galaxies (Catalog of Nearby Galaxies, by R. Brent Tully and J. Richard Fisher, pp. 224. ISBN 0521352991. Cambridge, UK: Cambridge University Press, April 1988.)
- van Albada (1982) van Albada, T. S. 1982, MNRAS, 201, 939
Appendix A Diagnosing Bulge Types: Notes on Individual Galaxies
Here, we briefly describe the bulge diagnosis for all
bulge-disk galaxies in our sample. For each galaxy we give the Hubble
type from the RC3 (de Vaucouleurs et al., 1991) and the Carnegie Atlas
(Sandage & Bedke, 1994) (RC3 first, then Carnegie Atlas separated by a
slash). Our diagnosis of the bulge is then stated, followed by a brief
motivation for that diagnosis.
IC 342 .SXT6../… Pseudobulge. The bulge shows a strong nuclear spiral and near the very center breaks into large clumps, that are almost a ring shape. The decomposition yields , and the bulge is actively forming stars with mag.
IC 749 .SXT6../SBc(rs) Pseudobulge. The decomposition yields , and the bulges is actively forming stars with mag. There is no optical image in the HST archive.
NGC 300 .SAS7../Sc(s) No Bulge/Pseudobulge. The “bulge” is probably better described as a nuclear star cluster. Nonetheless, a decomposition yields , and the bulges is inactive with mag.
NGC 404 .LAS-*./S0 Classical bulge. There is a very small
nuclear spiral, however that is embedded within a much larger bulge
that shows little-to-no substructure. The luminosity of the galaxy
contained within the small nuclear spiral only accounts for 0.8% of
the total light, as compared to the larger bulge which is roughly 1/4
of the total light. The decomposition yields , and the bulges is inactive with mag.
NGC 628 .SAS5../Sc(s) Pseudobulge. The spiral arms of the outer disk extend all the way to the central ,̈ whereas the bulge begins to dominate the surface brightness profile at .̈ The decomposition yields , and the bulges is actively forming stars with mag.
NGC 672 .SBS6../SBc(s) Pseudobulge. The bulge is extremely elongated, and shows patchiness that is similar to what is seen in late-type disk galaxies. The decomposition yields , and the bulges is actively forming stars with mag.
NGC 925 .SXS7../SBc(s) Pseudobulge. The decomposition yields
, and the bulges is actively forming stars with
mag. The optical HST images are not well
centered, making the morphology uncertain. Nonetheless, there appears
to have patchiness that is similar to what is seen in late-type disk
galaxies.
NGC 1023 .LBT-../SB0 Classical Bulge. The bulge looks very much like and E type, there is no sign of spiral structure of any disk-like morphology. The decomposition yields , and the bulges is inactive with mag.
NGC 1058 .SAT5../Sc(s) Pseudobulge. There is a prominent, nearly
face-on spiral, that extends to the central .̈ The
decomposition yields , and the bulges is actively forming
stars with mag.
NGC 1097 .SBS3../RSBbc(s) Pseudobulge. The bulge has a prominent
nuclear ring. The nuclear ring is evident in the surface brightness
profile from 5-15ëven in the near-IR. The decomposition yields
, and the bulges is actively forming stars with
mag.
NGC 1313 .SBS7../SBc(s) Pseudobulge. The bulge shows patchiness
that is similar to what is seen in late-type disk galaxies. The
decomposition yields , and the bulges is inactive with
mag.
NGC 1317 .SXR1../Sa Pseudobulge. The bulge has a prominent
nuclear bar and spiral. The decomposition yields , and the
bulges is actively forming stars with mag.
NGC 1433 PSBR2../SBb(s) Pseudobulge. The bulge has a prominent
nuclear spiral. The decomposition yields , and the bulges is
actively forming stars with mag.
NGC 1512 .SBR1../SBb(rs) pec Pseudobulge. The bulge has a
prominent nuclear ring and spiral. The decomposition yields ,
and the bulges is actively forming stars with
mag.
NGC 1543 RLBS0../RSB0/a Pseudobulge. There is a prominent
nuclear bar. The decomposition yields , and the bulges is not
actively forming stars with
mag.
NGC 1559 .SBS6../SBc(s) Pseudobulge. A flocculent spiral extends
all the way to the center of the galaxy. The decomposition yields
, and the bulges is actively forming stars with
mag.
NGC 1566 .SXS4../Sbc(s) Pseudobulge. The bulge shows a bright
two armed spiral at the center which becomes more diffuse around
.̈ The decomposition yields , and the bulges is
actively forming stars with mag.
NGC 1617 .SBS1../Sa(s) Classical Bulge. There is a mild
(non-spiral) dust lane slightly off center from the bulge center,
otherwise the bulge has a smooth E-like morphology. The decomposition
yields , and the bulges is not forming stars with
mag.
NGC 1637 .SXT5../SBc(s) Pseudobulge. A flocculent spiral extends
all the way to the central arcsecond, where it becomes elongated and
clumpy. The decomposition yields , and the bulges is
actively forming stars with mag.
NGC 1672 .SBS3../Sb(rs) Pseudobulge. There is a bright spiral
arm that almost completely wraps around the center of the bulge. Near
ẗhis spiral breaks into more spiral arms. The decomposition
yields , and the bulges is
actively forming stars with mag.
NGC 1744 .SBS7../SBcd(s) No bulge/Pseudobulge. The “bulge” is probably better described as a nuclear star cluster. Nonetheless, a decomposition yields , and the bulges is actively forming stars with mag.
NGC 1808 RSXS1../Sbc pec Pseudobulge. The bulge has a very high
surface brightness flocculent spiral. The decomposition yields
, and the bulges is actively forming stars with mag.
NGC 2403 .SXS6../Sc(s) Pseudobulge. The bulge is comprised of
several clumps of stars, reminiscent of a very late-type disk
galaxy. The decomposition yields
, and the bulges is actively forming stars with mag.
NGC 2500 .SBT7../Sc(s) Pseudobulge. The bulge is comprised of
several clumps of stars, reminiscent of a very late-type disk
galaxy. The decomposition yields
, and the bulges is actively forming stars with mag.
NGC 2655 .SXS0../Sa pec Classical Bulge. This bulge has
moderately prominent dust-lanes, however it is not clear if the dust
is spiral. The decomposition yields
, and the bulges is not active with mag.
NGC 2685 RLB.+P./S0 pec Classical Bulge. There is a dust lane
that is offset from the center of the bulge, it is possibly
disk-contamination. Otherwise the bulge is smooth, and appears similar
to an E-type. The decomposition yields
, and the bulges is not active with mag.
NGC 2775 .SAR2../Sa(r) Classical Bulge. There is a clear break
in the disk near ,̈ inside which the bulge is smooth and
E-type. The decomposition yields , and the bulges is not active with mag.
NGC 2841 .SAR3*./Sb Classical Bulge. At the very center of the bulge there is a small nuclear spiral, however the vast majority of bulge light is dominated by smooth isophotes, that appears similar to an E-type galaxy. The decomposition yields , and the bulges is not active with mag.
NGC 2903 .SXT4../Sc(s) Pseudobulge. The bulge light is dominated
by a flocculent spiral that breaks into clumps in the center. The
decomposition yields
, and the bulge is actively forming stars with mag.
NGC 2950 RLBR0../RSB0 Pseudobulge. The bulge shows a nuclear
bar, but otherwise shows little spiral structure. The decomposition
yields , and the bulge is not active with mag.
NGC 2964 .SXR4*./Sc(s) The bulge has a strong nearly face-on
nuclear spiral. The decomposition
yields , and the bulge is actively forming stars with mag.
NGC 2976 .SA.5P./Sd No bulge/Pseudobulge. The center of the
galaxy shows flocculent spiral structure. However, there is not a
significant rise in surface brightness. Indeed, the decomposition
shows %, thus it is probably best to say the galaxy has
no bulge. The decomposition
yields , and the bulge is actively forming stars with mag.
NGC 2997 .SXT5../Sc(s) Pseudobulge. The bulge is comprised of a
bright nuclear spiral that nearly forms a ring at .̈ The
decomposition
yields , and the bulge is actively forming stars with mag.
NGC 3031 .SAS2../Sb(r) Classical Bulge. There is a dust lane
that extends to near the center of the galaxy, however most of the
light is dominated by smooth isophotes that are resemble an E galaxy.
The decomposition yields
, and the bulges is not active with mag.
NGC 3032 .LXR0../RSa pec Pseudobulge. The bulge has a prominent
spiral that extends to the center of the galaxy. The decomposition
yields , and the bulge is actively forming stars with mag.
NGC 3156 .L…*./ S0 Pseudobulge. There is a dust-lane that near
the center becomes a nuclear spiral. The morphology is some what
uncertain. The decomposition
yields , and the bulge is not active with mag.
NGC 3184 .SXT6../Sc(r) Pseudobulge. The bulge has a prominent
spiral that extends to the center. The decomposition
yields , and the bulge is actively forming stars with mag.
NGC 3185 RSBR1../SBa(s) Pseudobulge. The bulge has a nuclear
ring that has radius of about ,̈ with spiral arms extending
off the ring. The decomposition yields , and the bulge is
actively forming stars with
mag.
NGC 3190 .SAS1P/Sa Pseudobulge. The galaxy is somewhat inclined
which makes morphology somewhat uncertain, however there appears to be
spiral structure extending to the center of the galaxy. The
decomposition
yields , and the bulge is not active with mag.
NGC 3198 .SBT5../Sc(s) Pseudobulge. The bulge shows a prominent
spiral. The decomposition yields , and the bulge is actively
forming stars with
mag.
NGC 3319 .SBT6./SBc(s) Pseudobulge. The bulge is very elongated,
and broken into several star clusters. The decomposition yields
, and the bulge is actively forming stars with
mag.
NGC 3344 RSXR4./Sbc(rs) Classical Bulge. The bulge shows no sign
of spiral structure, and is morphologically similar to an E
galaxy. The decomposition
yields , and the bulge is not active with mag.
NGC 3351 .SBR3./SBb(r) Pseudobulge. The bulge has a nuclear
spiral and a prominent nuclear ring. The decomposition yields
, and the bulge is actively forming stars with
mag.
NGC 3368 .SXT2./Sab(s) Pseudobulge. The bulge has a strong
nuclear spiral. The decomposition yields , and the bulge is
not active with
mag.
NGC 3384 .LBS-*./SB01 Pseudobulge. The bulge has a nuclear
bar. The decomposition yields , and the bulge is not active
with
mag.
NGC 3412 .LBS0../SB0 Classical Bulge. The bulge shows no sign of
spiral structure, and is morphologically similar to an E galaxy. The
decomposition
yields , and the bulge is not active with mag.
NGC 3486 .SXR5./Sbc(r) Pseudobulge. The bulge shows spiral
structure extending from the ring (at )̈ to the center of
the galaxy. The decomposition yields , and the bulge is
actively forming stars with
mag.
NGC 3489 .LXT+../S0-Sa Pseudobulge. The bulge has a nuclear
spiral, which becomes a nuclear bar in the central few arcseconds. The
decomposition yields , and the bulge is not active
mag.
NGC 3511 .SAS5./Sc(s) Pseudobulge. The decomposition yields
, and the bulge is actively forming stars
mag. There is not optical HST image.
NGC 3521 .SXT4./Sbc(s) Classical Bulge. There is a distinct
change in morphology from the outer disk to the bulge, near ïnside of which the bulge appears similar to an E-type galaxy. The
decomposition yields , and the bulge is actively forming
stars
mag.
NGC 3593 .SAS0*./Sa pec Pseudobulge. The bulge shows a prominent
nuclear spiral. The decomposition yields , and the bulge is
actively forming stars
mag.
NGC 3621 .SAS7./Sc(s) Pseudobulge. The bulge light is dominated
by a flocculent spiral. The decomposition yields , and the
bulge is actively forming stars
mag.
NGC 3675 .SAS3./Sb(r) Pseudobulge. The bulge light is dominated
by a flocculent spiral. The decomposition yields , and the
bulge is actively forming stars
mag.
NGC 3726 .SXR5./Sbc(rs) Pseudobulge. The decomposition yields
, and the bulge is actively forming stars
mag. There is no optical HST image.
NGC 3906 .SBS7./… Pseudobulge. This bulge is broken into
several nuclear star clusters, similar to a very late-type galaxy.
The decomposition yields , and the bulge is
actively forming stars mag.
NGC 3938 .SAS5./Sc(s) Pseudobulge. The bulge shows a prominent
face-on flocculent spiral. The decomposition yields , and
the bulge is
actively forming stars mag.
NGC 3941.LBS0../ SB0/a. Pseudobulge. The decomposition yields
, and
the bulge is not active mag. There is no optical HST image.
NGC 3945 RLBT+../RSB0 Pseudobulge. The bulge shows a strong
nuclear bar.The decomposition yields , and the bulge is not
active mag.
NGC 3953 .SBR4./SBbc(r) Pseudobulge. The decomposition yields
, and the bulge is not
active mag. There is not optical HST image.
NGC 3982 .SXR3*/… Pseudobulge. The bulge shows a prominent
face-on nuclear spiral. The decomposition yields
, and the bulge is actively forming stars mag.
NGC 3990 .L..-* / S0-Sa Pseudobulge. The decomposition yields
, and the bulge is actively forming stars mag. There is not optical HST image.
NGC 4020 .SB.7? /… No Bulge/Pseudobulge. The decomposition
yields
, and the bulge is actively forming stars mag. There is not optical HST image.
NGC 4117 .L..0*./… Pseudobulge. The bulge light shows a spiral
pattern. The decomposition yields
, and the bulge is not active mag.
NGC 4136 .SXR5./Sc(r) Pseudobulge. The decomposition yields
, and the bulge is actively forming stars mag. There is not optical HST image.
NGC 4138 .LAR+../Sa(r) Pseudobulge. The bulge morphology is
somewhere between pseudo- and classical. The decomposition yields
, and the bulge is not active mag.
NGC 4150 .LAR0$./S0-Sa Classical Bulge. There is a very weak
spiral dust pattern, however the center of the spiral is not
coincident with the center of the stellar light. Also, most of the
bulge light appears to come from a classical like component in which
the dust resides. The decomposition yields
, and the bulge is slightly active mag.
NGC 4203 .LX.-*./S0 Classical Bulge. Other than a thin-faint
wisp of dust, the bulge light is smooth and looks very similar to an
E-type galaxy. The decomposition yields
, and the bulge is mildly active with mag.
NGC 4237 .SXT4./Sc(r) Pseudobulge. The galaxy is a nearly
face-on flocculent spiral that extends all the way into the resolution
limit of HST. The decomposition yields
, and the bulge is actively forming stars with mag.
NGC 4254 .SAS5../Sc(s) Pseudobulge. The galaxy is a nearly
face-on spiral that extends all the way into the resolution limit of
HST. The decomposition yields
, and the bulge is actively forming stars with mag.
NGC 4258 .SXS4./Sb(s) Pseudobulge (possibly Classical
Bulge). The bulge has a nuclear spiral. Their is an opaque dust-lane
that is off center that may affect morphology. The decomposition
yields
, and the bulge is mildly forming stars with mag.
NGC 4267 .LBS-$./… Classical Bulge. The bulge has smooth
undisturbed isophotes, no sign of disk-like morphology. The
decomposition yields
, and the bulge is not active with mag.
NGC 4274 RSBR2./Sa(sr) Pseudobulge. The bulge has a prominent
nuclear spiral, and possibly a moderately inclined nuclear ring. The
decomposition yields
, and the bulge is mildly forming stars with mag.
NGC 4293 RSBS0../Sa Pseudobulge. The bulge is flattened and
shows a patchy, moderately spiral pattern. The decomposition yields
, and the bulge is actively forming stars with
mag.
NGC 4294 .SBS6./SBc(s) Pseudobulge. The decomposition yields
, and the bulge is actively forming stars with
mag. There is no optical HST image.
NGC 4303 .SXT4../Sc(s) Pseudobulge. The bulge shows a tightly
wound spiral, that extends down to a small nuclear bar. The
decomposition yields , and the bulge is actively forming
stars with
mag.
NGC 4314 .SBT1./SBa(rs) pec Pseudobulge. The bulge has a very
prominent nuclear ring, and nuclear spiral. The decomposition yields
, and the bulge is mildly forming stars with
mag.
NGC 4321 .SXS4../Sc(s) Pseudobulge. The bulge has a two very
prominent spiral arms that almost form a ring. The decomposition
yields , and the bulge is actively forming stars with
mag.
NGC 4371 .LBR+../SB0(r) Pseudobulge. This bulge shows
little-to-no spiral structure, however there is a nuclear ring (near
)̈ and a nuclear bar. The decomposition yields , and
the bulge is not active with
mag.
NGC 4380 .SAT3*/Sab(s) Pseudobulge. The galaxy has a flocculent
spiral that extends into the central tens of parsecs. The
decomposition yields , and the bulge is actively forming
stars with
mag.
NGC 4394 RSBR3./SBb(sr) Pseudobulge. There is a weak face-on
spiral at that comprises the central öf the bulge. The
decomposition yields , and the bulge is not active with
mag.
NGC 4413 PSBT2*/… Pseudobulge. The decomposition yields
, and the bulge is actively forming stars with
mag. There is no optical HST image.
NGC 4414 .SAT5$/Sc(sr) Pseudobulge. The bulge shows spiral
structure, and there is little-to-no break from the spiral of the
outer disk. The decomposition yields , and the bulge is
actively forming stars with
mag.
NGC 4419 .SBS1./Sa Pseudobulge. The decomposition yields
, and the bulge is actively forming stars with
mag. There is no optical HST image.
NGC 4421 .SBS0../… Classical Bulge. The decomposition yields
, and the bulge is actively forming stars with
mag. There is no optical HST image.
NGC 4424 .SBS1*/Sa pec Pseudobulge. The bulge is broken into
several knots (or star clusters) threaded with a dust-lane. The
decomposition yields , and the bulge is actively forming
stars with
mag.
NGC 4442 .LBS0../SB0 Classical Bulge. The bulge isophotes are
smooth and very much like an E-type galaxy. The decomposition yields
, and the bulge is not active with
mag.
NGC 4448 .SBR2./Sa(late) Pseudobulge. The bulge shows a mild
spiral pattern that continues to its center. The decomposition yields
, and the bulge is not active with
mag.
NGC 4450 .SAS2../Sab pec Pseudobulge. The bulge shows a spiral
pattern. The decomposition yields , and the bulge is not
active with
mag.
NGC 4457 RSXS0../RSb(s) Pseudobulge. The decomposition yields
, and the bulge is mildly active with
mag. There is no optical HST image.
NGC 4491 .SBS1*/… Pseudobulge. The decomposition yields
, and the bulge is not active with
mag. There is no optical HST image.
NGC 4498 .SXS7../… Pseudobulge. The bulge is very thin,
elongated, and broken into clumps of stars. The decomposition yields
, and the bulge is actively forming stars with
mag.
NGC 4501 .SAT3../Sbc(s) Pseudobulge. The bulge is a nuclear
spiral that becomes radial near ,̈ and this may be
indicating that the bulge also contains a nuclear bar. The
decomposition yields , and the bulge is not active with
mag.
NGC 4519 .SBT7./SBc(rs) Pseudobulge. The bulge is a spiral that
breaks into several clumps near the center. The decomposition yields
, and the bulge is actively forming stars with
mag.
NGC 4526 .LXS0*./S0 Classical Bulge. This is not a standard
bulge. The bulge is very large and when viewed at high contrast looks
very much like an E-type galaxy. However, in the central 10ẗhere is a spiral that is not continuing the spiral of the outer disk,
but rather seems embedded within a smooth E-like bulge. We decide that
most of the light is dominated by the component that appears
classical. The decomposition yields , and the bulge is not
very active with
mag.
NGC 4548 .SBT3./… Classical Bulge. The decomposition yields
, and the bulge is not active with
mag. There is no optical HST image.
NGC 4559 .SXT6./Sc(s) Pseudobulge. The bulge is a nuclear spiral
that breaks into a few star clusters in the center of the galaxy. The
decomposition yields , and the bulge is actively forming
stars with
mag.
NGC 4569 .SXT2./Sab(s) Pseudobulge. The bulge shows a nuclear
spiral that becomes elongated near the center. The decomposition
yields , and the bulge is actively forming stars with
mag.
NGC 4571 .SAR7./Sc(s) Pseudobulge. The bulge shows a prominent
face-on flocculent spiral that extends from the outer disk all the way
to the center of the galaxy. The
decomposition yields . There is no 8 m data.
NGC 4578 .LAR0*./S0 Classical Bulge. The bulge light is very
smooth and featureless, much like an E-galaxy. The decomposition
yields , and the bulge is not active with
mag.
NGC 4580 .SXT1P/Sc(s)-Sa Pseudobulge. The decomposition yields
, and the bulge is actively forming stars with
mag. There is no available optical HST image.
NGC 4605 .SBS5P/Sc(s) No bulge/Pseudobulge. The ’bulge’ is
really almost non-existent; the decomposition yields
%. There morphology of the bulge light is broken into
several star clusters, and there is no obvious center of the galaxy
from looking at the image. The decomposition yields , and
the bulge is actively forming stars with
mag.
NGC 4612 RLX.0../E5 Classical Bulge. The decomposition yields
, and the bulge is not active with
mag. There is no optical HST image available.
NGC 4639 .SXT4./SBb(r) Pseudobulge. The galaxy has a spiral that
continues unbroken into the center of the bulge. The decomposition
yields , and the bulge is not active with
mag.
NGC 4651 .SAT5./Sc(r) Pseudobulge. The bulge is a nuclear
spiral. The decomposition yields , and the bulge is actively
forming stars with
mag.
NGC 4654 .SXT6./SBc(rs) Pseudobulge. The bulge is a prominent
spiral that breaks into clumps near the center. The decomposition
yields , and the bulge is actively forming stars with
mag.
NGC 4688 .SBS6./… Pseudobulge. The decomposition yields
, and the bulge is not active with
mag. There is no optical HST image available.
NGC 4689 .SAT4../Sa Pseudobulge. The decomposition yields
, and the bulge is actively forming stars with
mag.There is no optical HST image available.
NGC 4698 .SAS2./Sa Classical Bulge. The bulge show a very faint
spiral structure, however the bulge light is dominated by smooth
E-like isophotes. The decomposition yields , and the bulge is
not active with
mag.
NGC 4701 .SAS1./… Pseudobulge. The bulge light is a strong
multiple arm spiral that becomes elongated near the center, possibly
indicating a nuclear bar. The decomposition yields , and the
bulge is actively forming stars with
mag.
NGC 4713 .SXT7./… No Bulge/Pseudobulge. The ’bulge’ is almost
non-existent (%). The spiral pattern of the disk extends
into the central arcsecond of the galaxy. The decomposition yields
, and the bulge is actively forming stars with
mag.
NGC 4725 .SXR2P/SBb(r) Classical Bulge. The bulge has some
patchy non-spiral dust, but is mostly dominated by a smooth component
that is similar to E-type galaxies. The decomposition yields
, and the bulge is not active with
mag.
NGC 4736 RSAR2./RSab(s) Pseudobulge. The bulge has a strong
nuclear spiral and a nuclear bar.The decomposition yields ,
and the bulge is not active with mag.
NGC 4808 .SAS6*/Sc(s) Pseudobulge. The decomposition yields
, and the bulge is actively forming stars with
mag. There is no optical HST image available.
NGC 4941 RSXR2*/Sab(s) Pseudobulge. There is a nuclear spiral
that extends to the central few arcseconds. Inside of that there
appears to be a nuclear bar. The decomposition yields ,
and the bulge is mildly active with mag.
NGC 4984 RSXR2*/Sab(s) Pseudobulge. The decomposition yields
,
and the bulge is actively forming stars with mag. There is no optical HST image available.
NGC 5005 .SXT4./Sb(s) Pseudobulge. This bulge has a prominent
two armed spiral in the central .̈ The becomes radial most
likely indicating a nuclear bar, and finally there is a small nuclear
cluster that is not spherical in the optical images. The decomposition
yields , and the bulge is mildly active with
mag.
NGC 5033 .SAS5./Sb(s) Pseudobulge. The bulge light is dominated
by a flocculent spiral. There is no break in the spiral pattern of the
outer disk to that of the bulge. The decomposition yields ,
and the bulge is actively forming stars with mag.
NGC 5055 .SAT4./Sbc(s) Pseudobulge. The bulge light is dominated
by a flocculent spiral. The spiral of the outer disk extends into the
central few arcseconds. The light in the central arcsecond is
dominated by a nuclear star cluster. The decomposition yields
,
and the bulge is actively forming stars with mag.
NGC 5068 .SXT6./SBc(s) No bulge/ Pseudobulge. The bulge is
almost non-existent with %. The bulge is very elongated
and comprised of several star clusters. The decomposition yields
,
and the bulge is actively forming stars with mag.
NGC 5128 .L…P./S0 + S pec Classical Bulge. The bulge light is
dominated by a smooth component that is very much like an E-type
galaxy, however there is a strong dust lane going across the center of
the galaxy. The decomposition yields , and the bulge is not
active with
mag.
NGC 5194 .SAS4P/Sbc(s) Pseudobulge. Though this galaxy is
clearly interacting with NGC 5194B we include it because it is well
studied, and may provide useful in understanding how interactions in
the outer disk relate to pseudobulge growth. The bulge light is
dominated by a strong nuclear spiral. The decomposition yields
, and the bulge is not active with
mag.
NGC 5236 .SXS5./SBc(s) Pseudobulge. The bulge light is broken
into several large clumps. There is a roughly spiral dust pattern in
the central 2-4.̈The decomposition yields , and the bulge
is actively forming stars with
mag.
NGC 5248 .SXT4./Sbc(s) Pseudobulge. The bulge light is comprised
of a nuclear spiral that also forms a ring near .̈ The
decomposition yields , and the bulge is actively forming
stars with mag.
NGC 5273 .LAS0../ S0/a Classical Bulge. The very center of the
bulge has a small dust pattern that is almost spiral, however the vast
majority of th bulge light is smooth and appears similar to an E-type
galaxy. The decomposition yields , and the bulge is not
active
with mag.
NGC 5338 .LB..*./… Bulge Type Uncertain. The decomposition
yields , and the bulge is active
with mag. There is no optical HST image available.
NGC 5457 .SXT6./Sc(s) Pseudobulge. The bulge is spiral structure
of the disk extends to the center of the galaxy. A bright nuclear star
cluster dominates the central arcsecond. The decomposition yields
, and the bulge is mildly active
with mag.
NGC 5474 .SAS6P/Scd Pseudobulge. The bulge is a set of star
clusters roughly arranged in a spiral pattern. The decomposition
yields , and the bulge is not active
with mag.
NGC 5585 .SXS7./Sd(s) Pseudobulge. The bulge is a set of star
clusters roughly arranged in a spiral pattern. The decomposition
yields , and the bulge is mildly active
with mag.
NGC 5643 .SXT5./SBc(s) Pseudobulge. The bulge is a nuclear
spiral that extends to the center of HST image. The decomposition
yields , and the bulge is actively forming stars
with mag.
NGC 5832 .SBT3$/… Pseudobulge. The decomposition yields
, and the bulge is not active
with mag. There is no optical HST image available.
NGC 5879 .SAT4*/Sb(s) Pseudobulge. The flocculent spiral of the
outer disk shows now break and continues to the central sub-arcsecond
of the galaxy. The decomposition yields , and the bulge is
actively forming stars
with mag.
NGC 5949 .SAR4$/Sc Pseudobulge. The decomposition yields
, and the bulge is actively forming stars
with mag. There is no optical HST image available.
NGC 6207 .SAS5./Sc(s) Pseudobulge. The flocculent spiral of the
outer disk shows now break and continues to the central sub-arcsecond
of the galaxy. The decomposition yields , and the bulge is
actively forming stars
with mag.
NGC 6300 .SBT3./SBb(s) pec Pseudobulge. The bulge light contains
a nuclear spiral that extends to the bulge center. The decomposition
yields , and the bulge is actively forming stars
with mag.
NGC 6503 .SAS6./Sc(s) Pseudobulge. The flocculent spiral of the
outer disk shows now break and continues to the central sub-arcsecond
of the galaxy. The decomposition yields , and the bulge is
slightly active with mag.
NGC 6684 PLBS0../SBa(s) Classical Bulge. The bulge light is for
the most part smooth and similar to an E-type galaxy. There is
possibly a nuclear bar near .̈ The decomposition yields
, and the bulge is
not active with mag.
NGC 6744 .SXR4./Sbc(r) Classical Bulge. There is a mild dust
lane that passes near the center, otherwise the bulge light is smooth
and very similar to an E-type galaxy. The decomposition yields
, and the bulge is
not active with mag.
NGC 7177 .SXR3./Sab(r) Pseudobulge. The bulge light is comprised
of a bar that passes through the center and ends with a ring near
.̈ The decomposition yields , and the bulge is
not active with mag.
NGC 7217 RSAR2./Sb(r) Classical Bulge. There is an abrupt break
in the spiral pattern of the outer disk near ,̈ inside of
this the bulge is mostly smooth and similar to an E-type galaxy. The
decomposition yields , and the bulge is
not active with mag.
NGC 7331 .SAS3./Sb(rs) Classical Bulge. The disk is inclined
making morphology difficult, and not trustworthy. There is possibly a
nuclear spiral in the bulge. The decomposition yields , and
the bulge is
not active with mag.
NGC 7457 .LAT-$./S01 Classical Bulge. The bulge isophotes are
smooth and look very much like an E-type galaxy. The decomposition
yields , and the bulge is
not active with mag.
NGC 7713 .SBR7*/Sc(s) No bulge/Pseudobulge. The bulge is very
small with %. The flocculent spiral of the disk extends
all the way into the center of the galaxy until a nuclear star cluster
dominates the light in the sub-arcsecond region. The decomposition
yields , and the bulge is
actively forming stars with mag.
NGC 7741 .SBS6./SBc(s) Pseudobulge. There is a weak nuclear
spiral in the center of the bulge. The decomposition yields
, and the bulge is
actively forming stars with mag.
NGC 7793 .SAS7./Sd(s) Pseudobulge. The flocculent spiral of the
outer disk shows now break and continues to the central sub-arcsecond
of the galaxy. The decomposition yields , and the bulge is
actively forming stars with mag.
UGC 10445 .S..6?/… Pseudobulge. The bulge light is comprised
of diffuse low surface brightness light and a set of bright star
clusters near the center. The decomposition yields , and the
bulge is
not active with mag.
Appendix B Decomposition Results
| Galaxy | BulgeaaP- Pseudobulge C- Classical Bulge | M | log() | log(h) | M8,dust | M3.6-M8.0 | |||
|---|---|---|---|---|---|---|---|---|---|
| Morphology | mag | log(pc) | mag arcsec-2 | mag arcsec-2 | log(pc) | mag | mag | ||
| IC0342 | P | 1.78 0.37 | -17.17 0.70 | 1.86 0.38 | 14.92 0.70 | 19.88 0.08 | 3.46 0.02 | -19.89 | 1.99 0.16 |
| IC0749 | … | 1.44 1.06 | -13.40 1.27 | 2.31 0.86 | 20.94 1.16 | 20.21 0.15 | 3.14 0.03 | -15.05 | 0.98 0.54 |
| NGC0300 | P | 1.64 0.49 | -10.91 1.01 | 1.32 0.54 | 18.49 1.01 | 20.74 0.04 | 3.29 0.01 | -9.63 | -1.46 1.40 |
| NGC0404 | C | 3.74 0.33 | -17.66 0.44 | 2.25 0.32 | 16.43 0.44 | 17.31 0.13 | 2.51 0.02 | -16.09 | -0.46 0.05 |
| NGC0628 | P | 1.55 0.17 | -18.53 0.17 | 2.92 0.10 | 18.88 0.16 | 20.13 0.06 | 3.58 0.01 | -18.80 | 0.18 0.01 |
| NGC0672 | P | 1.10 1.14 | -10.86 1.22 | 1.23 0.35 | 18.11 1.20 | 20.04 0.14 | 3.26 0.02 | -14.84 | 2.20 1.17 |
| NGC0925 | P | 0.74 0.32 | -17.68 0.38 | 3.05 0.14 | 20.37 0.33 | 20.46 0.10 | 3.53 0.01 | -20.41 | 2.86 0.06 |
| NGC1023 | C | 2.47 0.34 | -20.90 0.53 | 2.89 0.21 | 16.35 0.53 | 19.02 0.12 | 3.55 0.02 | -18.11 | -1.17 0.08 |
| NGC1058 | P | 1.09 0.46 | -14.74 1.11 | 1.89 0.30 | 17.53 1.10 | 19.73 0.05 | 3.04 0.01 | -16.20 | 0.82 0.08 |
| NGC1097 | P | 1.96 0.16 | -21.47 0.17 | 3.10 0.12 | 16.83 0.17 | 19.17 0.11 | 3.68 0.02 | -22.59 | 1.31 0.01 |
| NGC1313 | P | 1.32 1.22 | -13.67 1.00 | 1.97 0.28 | 18.99 0.97 | 18.42 0.07 | 3.03 0.01 | -13.71 | -0.72 0.11 |
| NGC1317 | P | 1.44 0.12 | -21.75 0.18 | 2.70 0.09 | 14.55 0.18 | 18.06 0.10 | 3.38 0.02 | -21.95 | 0.40 0.01 |
| NGC1433 | P | 0.80 0.10 | -18.91 0.22 | 2.48 0.07 | 16.30 0.22 | 19.64 0.05 | 3.51 0.01 | -19.06 | 0.26 0.01 |
| NGC1512 | P | 1.79 0.62 | -19.11 0.61 | 2.76 0.22 | 17.51 0.61 | 20.06 0.76 | 3.45 0.12 | -18.96 | 0.21 0.00 |
| NGC1543 | P | 1.51 0.16 | -19.73 0.26 | 2.64 0.14 | 16.28 0.26 | 19.40 0.09 | 3.37 0.01 | -17.52 | -1.27 0.01 |
| NGC1559 | P | 0.68 0.29 | -20.38 0.28 | 2.91 0.09 | 16.96 0.27 | 17.59 1.69 | 3.28 0.11 | -25.22 | 5.50 0.03 |
| NGC1566 | P | 1.60 0.57 | -19.21 0.96 | 2.61 0.27 | 16.66 0.96 | 18.81 0.11 | 3.39 0.01 | -19.56 | 0.21 0.03 |
| NGC1617 | C | 2.05 0.22 | -19.41 0.27 | 2.58 0.16 | 16.29 0.27 | 18.82 0.11 | 3.36 0.01 | -17.60 | -1.04 0.05 |
| NGC1637 | P | 1.62 0.53 | -16.77 0.86 | 2.08 0.22 | 16.47 0.86 | 19.50 0.11 | 3.05 0.01 | -20.76 | 3.42 0.06 |
| NGC1672 | P | 2.05 0.17 | -20.51 0.24 | 2.69 0.14 | 15.73 0.23 | 19.44 0.08 | 3.62 0.01 | -22.61 | 1.99 0.00 |
| NGC1744 | P | 0.54 1.23 | -15.29 1.00 | 2.33 1.03 | 19.19 0.95 | 19.54 0.65 | 3.55 0.23 | -17.00 | 5.16 2.36 |
| NGC1808 | P | 0.77 0.05 | -22.31 0.12 | 2.49 0.04 | 12.93 0.12 | 17.05 0.04 | 3.33 0.01 | -25.17 | 3.27 0.01 |
| NGC2403 | P | 0.66 0.33 | -16.82 0.33 | 2.75 0.09 | 19.74 0.32 | 20.04 0.81 | 3.28 0.15 | -17.92 | 1.20 0.02 |
| NGC2500 | P | 1.73 0.76 | -15.27 0.55 | 2.52 0.16 | 20.14 0.54 | 19.15 0.08 | 3.01 0.02 | -15.92 | 0.38 0.13 |
| NGC2655 | C | 2.36 0.35 | -20.65 0.55 | 2.76 0.37 | 15.98 0.55 | 17.88 0.13 | 3.19 0.01 | -19.82 | -0.55 0.10 |
| NGC2685 | C | 2.12 0.30 | -18.96 0.35 | 2.51 0.23 | 16.39 0.35 | 18.17 0.16 | 2.96 0.02 | -16.79 | -1.00 0.00 |
| NGC2775 | C | 3.51 0.35 | -20.61 0.45 | 3.16 0.26 | 17.99 0.44 | 19.55 0.21 | 3.46 0.03 | -20.18 | -0.38 0.08 |
| NGC2841 | C | 3.60 0.27 | -20.33 0.29 | 2.95 0.36 | 17.24 0.29 | 18.95 0.10 | 3.48 0.02 | -18.30 | -0.79 0.01 |
| NGC2903 | P | 0.46 0.04 | -18.95 0.09 | 2.33 0.02 | 15.49 0.09 | 17.99 0.04 | 3.25 0.01 | -20.92 | 2.17 0.01 |
| NGC2950 | P | 1.32 0.60 | -22.11 0.88 | 2.62 0.17 | 13.82 0.88 | 19.38 0.25 | 3.61 0.03 | -19.45 | -1.25 0.01 |
| NGC2964 | P | 1.05 0.22 | -18.42 0.32 | 2.25 0.12 | 15.62 0.31 | 18.44 0.11 | 3.19 0.01 | -20.45 | 1.96 0.06 |
| NGC2976 | P | 1.06 0.14 | -10.53 0.19 | 0.65 0.08 | 15.53 0.18 | 19.68 0.03 | 2.91 0.01 | -14.11 | 1.44 0.10 |
| NGC2997 | P | 1.02 0.12 | -18.87 0.18 | 2.58 0.07 | 16.85 0.18 | 20.13 0.07 | 3.83 0.04 | -20.57 | 1.49 0.01 |
| NGC3031 | C | 3.88 0.23 | -21.21 0.36 | 3.10 0.28 | 17.11 0.36 | 19.07 0.11 | 3.52 0.01 | -20.25 | -0.51 0.01 |
| NGC3032 | P | 2.60 0.29 | -18.94 0.66 | 2.67 0.53 | 17.21 0.66 | 20.35 0.34 | 3.16 0.04 | -20.21 | 1.40 0.02 |
| NGC3156 | P | 1.65 0.54 | -19.51 0.68 | 2.65 0.13 | 16.57 0.68 | 18.26 0.41 | 3.07 0.05 | -18.97 | -0.38 0.00 |
| NGC3184 | P | 1.65 0.42 | -16.20 0.61 | 2.28 0.29 | 18.03 0.60 | 20.12 0.09 | 3.37 0.01 | -17.70 | 1.38 1.80 |
| NGC3185 | P | 1.02 0.76 | -18.57 2.02 | 2.69 0.45 | 17.71 2.00 | 18.85 0.79 | 3.19 0.11 | -19.37 | 0.65 0.00 |
| NGC3190 | P | 1.99 0.65 | -20.47 0.95 | 2.70 0.27 | 15.84 0.95 | 18.61 0.23 | 3.38 0.02 | -19.17 | -0.42 1.97 |
| NGC3198 | P | 1.30 0.56 | -16.60 1.00 | 2.41 0.27 | 18.26 1.00 | 19.91 0.09 | 3.35 0.01 | -18.23 | 1.18 1.10 |
| NGC3319 | P | 0.61 0.13 | -17.39 0.12 | 2.98 0.05 | 20.33 0.11 | 22.25 0.09 | 3.61 0.02 | -17.36 | 1.20 0.18 |
| NGC3344 | C | 2.39 0.33 | -17.20 0.50 | 2.34 0.18 | 17.32 0.50 | 19.70 0.07 | 3.20 0.01 | -16.69 | -0.31 6.02 |
| NGC3351 | P | 1.54 0.22 | -18.87 0.24 | 2.47 0.16 | 16.32 0.24 | 19.28 0.09 | 3.31 0.01 | -19.93 | 0.91 0.03 |
| NGC3368 | P | 1.63 0.18 | -19.59 0.22 | 2.50 0.12 | 15.72 0.22 | 18.30 0.12 | 3.15 0.02 | -19.16 | -0.23 0.43 |
| NGC3384 | P | 1.42 0.20 | -19.52 0.34 | 2.38 0.15 | 15.21 0.34 | 19.22 0.13 | 3.29 0.03 | -16.79 | -1.28 0.01 |
| NGC3412 | C | 2.65 0.31 | -18.60 0.62 | 2.35 0.54 | 15.97 0.62 | 19.22 0.15 | 3.02 0.01 | -15.73 | -1.35 0.02 |
| NGC3486 | P | 1.62 0.56 | -16.79 0.77 | 2.22 0.25 | 17.14 0.77 | 19.06 0.31 | 2.93 0.05 | -19.67 | 1.57 0.19 |
| NGC3489 | P | 1.47 0.28 | -18.90 0.54 | 2.29 0.22 | 15.36 0.54 | 18.35 0.11 | 2.93 0.01 | -17.53 | -0.69 0.08 |
| NGC3511 | … | 1.55 0.58 | -17.90 0.60 | 2.77 0.25 | 18.75 0.59 | 19.31 0.12 | 3.49 0.02 | -20.20 | 1.97 0.01 |
| NGC3521 | C | 2.60 0.82 | -19.61 1.17 | 2.54 0.49 | 15.88 1.16 | 17.93 0.21 | 3.27 0.02 | -20.12 | 0.43 0.10 |
| NGC3593 | P | 0.81 0.11 | -20.15 0.17 | 2.71 0.06 | 16.22 0.17 | 19.58 0.13 | 3.25 0.01 | -20.87 | 1.95 0.00 |
| NGC3621 | P | 2.79 0.48 | -17.65 0.62 | 2.58 0.49 | 18.06 0.61 | 17.26 0.05 | 3.31 0.01 | -18.84 | 0.81 0.17 |
| NGC3675 | P | 1.62 0.66 | -19.27 1.02 | 2.67 0.43 | 16.88 1.01 | 18.28 0.16 | 3.26 0.01 | -19.92 | 0.55 0.32 |
| NGC3726 | … | 0.83 0.16 | -17.03 0.22 | 2.51 0.08 | 18.34 0.22 | 19.97 0.07 | 3.47 0.01 | -18.26 | 1.25 0.03 |
| NGC3906 | P | 0.97 0.46 | -18.20 0.41 | 2.90 0.20 | 19.12 0.29 | 20.03 0.60 | 3.44 0.17 | -15.62 | 0.96 0.90 |
| NGC3938 | P | 1.35 0.12 | -17.48 0.13 | 2.53 0.07 | 17.99 0.13 | 19.60 0.04 | 3.33 0.01 | -18.94 | 1.11 1.00 |
| NGC3941 | … | 1.53 0.47 | -19.09 0.86 | 2.32 0.30 | 15.32 0.86 | 17.49 0.14 | 2.92 0.01 | -17.43 | -1.18 0.01 |
| NGC3945 | P | 1.54 0.14 | -20.88 0.19 | 2.90 0.11 | 16.44 0.19 | 20.71 0.37 | 3.64 0.10 | -18.13 | -1.26 0.01 |
| NGC3953 | … | 1.54 0.61 | -18.93 1.04 | 2.59 0.33 | 16.84 1.04 | 18.91 0.11 | 3.41 0.01 | -18.89 | -0.42 0.07 |
| NGC3982 | P | 1.95 0.19 | -16.82 0.20 | 2.21 0.11 | 17.03 0.20 | 18.60 0.11 | 2.91 0.01 | -17.02 | 0.58 5.24 |
| NGC3990 | … | 1.08 0.57 | -17.81 1.16 | 2.32 0.22 | 16.59 1.16 | 18.64 0.20 | 2.75 0.01 | -18.70 | 1.03 0.01 |
| NGC4020 | … | 0.30 0.93 | -13.92 1.86 | 2.03 0.17 | 19.05 1.81 | 18.46 0.06 | 3.16 0.02 | -15.07 | 0.50 0.77 |
| NGC4117 | P | 1.36 0.47 | -17.34 0.62 | 2.52 0.24 | 18.08 0.62 | 19.74 2.23 | 2.84 0.11 | -16.67 | -0.22 0.02 |
| NGC4136 | … | 0.64 0.56 | -14.21 0.75 | 2.19 0.15 | 19.53 0.74 | 20.34 0.06 | 3.16 0.01 | -16.03 | 0.94 0.19 |
| NGC4138 | P | 1.65 0.47 | -19.94 0.76 | 2.26 0.21 | 14.18 0.76 | 17.39 0.19 | 3.07 0.02 | -18.98 | -0.95 0.95 |
| NGC4150 | C | 5.37 0.29 | -19.36 0.56 | 2.81 0.49 | 17.49 0.56 | 19.67 0.23 | 2.98 0.03 | -17.98 | 0.16 0.11 |
| NGC4203 | C | 2.76 0.29 | -20.45 0.57 | 2.84 0.40 | 16.55 0.57 | 20.46 0.19 | 3.60 0.04 | -20.32 | 0.27 0.05 |
| NGC4237 | P | 1.35 0.41 | -19.85 0.40 | 2.80 0.18 | 16.97 0.39 | 18.26 0.33 | 3.12 0.03 | -18.83 | 0.58 0.10 |
| NGC4254 | P | 1.72 0.56 | -20.85 0.50 | 2.87 0.21 | 16.31 0.49 | 17.39 0.17 | 3.43 0.02 | -22.99 | 1.51 0.03 |
| NGC4258 | P | 2.80 0.28 | -19.72 0.42 | 2.77 0.05 | 16.96 0.42 | 18.82 0.06 | 3.50 0.01 | -19.42 | 0.04 0.30 |
| NGC4267 | C | 4.23 0.27 | -21.80 0.36 | 3.01 0.33 | 16.04 0.35 | 20.10 0.51 | 3.50 0.07 | -18.81 | -1.30 0.01 |
| NGC4274 | P | 1.60 0.35 | -19.65 0.56 | 2.65 0.27 | 16.44 0.56 | 19.56 0.14 | 3.52 0.02 | -19.80 | 0.12 0.01 |
| NGC4293 | P | 1.93 0.36 | -18.07 0.48 | 2.17 0.28 | 15.59 0.48 | 19.00 0.10 | 3.51 0.02 | -19.18 | 1.68 0.64 |
| NGC4294 | … | 1.31 0.89 | -13.50 0.72 | 2.32 0.25 | 20.92 0.69 | 19.44 0.04 | 3.09 0.01 | -15.96 | 2.31 0.12 |
| Galaxy | BulgeaaP- Pseudobulge C- Classical Bulge | M | log() | log(h) | M8,dust | M3.6-M8.0 | |||
|---|---|---|---|---|---|---|---|---|---|
| Morphology | mag | log(pc) | mag arcsec-2 | mag arcsec-2 | log(pc) | mag | mag | ||
| NGC4303 | P | 1.75 0.21 | -21.26 0.13 | 2.43 0.05 | 13.69 0.13 | 17.23 0.04 | 3.50 0.01 | -22.60 | 1.00 0.01 |
| NGC4314 | P | 3.00 0.30 | -19.13 0.26 | 2.78 0.19 | 17.57 0.26 | 18.94 0.15 | 3.30 0.03 | -19.13 | 0.35 0.09 |
| NGC4321 | P | 1.20 0.19 | -19.93 0.24 | 2.79 0.13 | 16.85 0.23 | 20.33 0.24 | 3.76 0.04 | -21.87 | 2.41 0.07 |
| NGC4371 | P | 3.92 0.31 | -22.11 0.32 | 3.21 0.59 | 16.73 0.32 | 19.33 0.42 | 3.50 0.04 | -19.32 | -1.21 0.10 |
| NGC4380 | P | 1.85 0.28 | -17.56 0.39 | 2.65 0.28 | 18.49 0.38 | 19.97 0.07 | 3.33 0.01 | -17.77 | 0.46 0.18 |
| NGC4394 | P | 1.99 0.12 | -20.70 0.19 | 2.85 0.10 | 16.37 0.18 | 18.96 0.04 | 3.55 0.01 | -17.08 | -1.91 0.05 |
| NGC4413 | … | 1.09 0.49 | -17.46 1.01 | 2.45 0.26 | 17.62 1.01 | 20.03 0.15 | 3.20 0.04 | -18.65 | 1.83 0.17 |
| NGC4414 | P | 0.45 0.49 | -17.78 1.57 | 2.17 0.14 | 15.91 1.57 | 17.18 0.04 | 3.07 0.00 | -19.48 | 1.11 0.93 |
| NGC4419 | … | 1.88 0.60 | -19.07 0.99 | 2.40 0.55 | 15.76 0.99 | 17.37 0.10 | 3.06 0.01 | -20.42 | 0.84 0.05 |
| NGC4421 | … | 2.70 0.36 | -20.56 0.37 | 2.94 0.20 | 16.96 0.37 | 19.03 0.31 | 3.33 0.03 | -17.59 | -1.17 0.03 |
| NGC4424 | P | 0.65 0.21 | -18.82 0.23 | 2.75 0.09 | 17.75 0.22 | 19.01 0.09 | 3.24 0.01 | -19.64 | 1.09 0.01 |
| NGC4442 | C | 2.36 0.14 | -20.63 0.17 | 2.84 0.10 | 16.38 0.17 | 19.27 0.12 | 3.38 0.01 | -17.82 | -1.17 0.03 |
| NGC4448 | P | 1.19 0.45 | -18.40 0.81 | 2.55 0.22 | 17.16 0.81 | 18.95 0.12 | 3.22 0.01 | -18.17 | -0.30 0.61 |
| NGC4450 | P | 2.06 0.42 | -19.12 0.58 | 2.56 0.29 | 16.48 0.58 | 18.74 0.19 | 3.35 0.02 | -19.33 | -0.66 0.15 |
| NGC4457 | … | 1.43 0.40 | -19.02 0.82 | 2.35 0.15 | 15.52 0.82 | 19.82 0.24 | 3.18 0.04 | -19.05 | 0.20 0.06 |
| NGC4491 | … | 0.91 0.44 | -13.47 0.79 | 1.82 0.18 | 18.46 0.79 | 19.31 0.03 | 2.60 0.01 | 999.00 | -2.86 0.07 |
| NGC4498 | P | 1.00 0.63 | -16.19 0.89 | 2.70 0.23 | 20.10 0.88 | 19.74 0.13 | 3.15 0.01 | -17.58 | 1.48 1.07 |
| NGC4501 | P | 0.89 0.65 | -19.16 1.32 | 2.56 0.24 | 16.43 1.10 | 18.09 0.09 | 3.46 0.02 | -20.46 | -0.37 0.03 |
| NGC4519 | P | 0.84 0.15 | -17.53 0.19 | 2.47 0.07 | 17.64 0.19 | 18.49 0.04 | 3.10 0.00 | -19.60 | 1.76 1.04 |
| NGC4526 | C | 3.53 0.14 | -21.78 0.12 | 3.21 0.10 | 17.09 0.12 | 19.49 0.19 | 3.62 0.03 | -20.30 | 0.03 0.07 |
| NGC4548 | … | 2.89 0.32 | -19.94 0.51 | 2.86 0.36 | 17.16 0.51 | 19.58 0.12 | 3.63 0.02 | -18.81 | -0.66 0.02 |
| NGC4559 | P | 1.07 0.53 | -17.62 0.55 | 2.89 0.20 | 19.65 0.52 | 19.80 0.09 | 3.55 0.01 | -18.42 | 1.07 0.12 |
| NGC4569 | P | 1.97 0.38 | -19.76 0.60 | 2.43 0.28 | 15.22 0.60 | 19.49 0.12 | 3.66 0.01 | -21.09 | 1.38 1.22 |
| NGC4571 | P | 1.88 0.46 | -17.85 0.33 | 3.10 0.17 | 20.45 0.32 | 20.69 0.23 | 3.49 0.03 | … | … … |
| NGC4578 | C | 3.66 0.25 | -21.69 0.33 | 3.08 0.43 | 16.51 0.33 | 19.17 0.22 | 3.42 0.02 | -19.08 | -1.26 0.01 |
| NGC4580 | … | 0.56 0.13 | -14.80 0.17 | 2.20 0.05 | 19.00 0.15 | 19.16 0.03 | 3.10 0.00 | -17.96 | 1.92 0.12 |
| NGC4605 | P | 0.61 0.13 | -12.13 0.18 | 0.89 0.06 | 15.15 0.17 | 18.62 0.09 | 2.99 0.01 | -16.04 | 1.47 0.86 |
| NGC4612 | … | 3.71 0.40 | -21.28 0.71 | 3.04 0.30 | 16.75 0.70 | 19.96 1.31 | 3.43 0.21 | -18.72 | -1.23 0.03 |
| NGC4639 | P | 1.32 0.76 | -18.38 1.17 | 2.60 0.43 | 17.44 1.17 | 20.03 0.30 | 3.26 0.03 | -17.61 | -0.27 0.21 |
| NGC4651 | P | 1.58 0.74 | -18.49 0.99 | 2.67 0.53 | 17.68 0.99 | 19.07 0.55 | 3.25 0.07 | -18.73 | 0.54 0.53 |
| NGC4654 | P | 0.57 0.09 | -18.28 0.14 | 2.67 0.04 | 17.89 0.14 | 18.90 0.03 | 3.38 0.01 | -19.89 | 1.72 0.13 |
| NGC4688 | … | 1.43 0.32 | -16.16 0.32 | 2.83 0.15 | 20.78 0.32 | 19.89 0.09 | 3.05 0.01 | -14.74 | -0.13 0.32 |
| NGC4689 | … | 1.24 0.21 | -18.81 0.21 | 3.02 0.10 | 19.12 0.21 | 20.10 0.05 | 3.72 0.01 | -21.13 | 1.30 0.03 |
| NGC4698 | C | 3.19 0.29 | -20.08 0.44 | 3.04 0.24 | 17.92 0.44 | 20.50 0.15 | 3.45 0.02 | -17.63 | -1.05 0.38 |
| NGC4701 | P | 1.79 0.31 | -18.95 0.44 | 2.70 0.20 | 17.37 0.44 | 19.75 0.86 | 3.01 0.07 | -19.68 | 1.54 0.18 |
| NGC4713 | P | 1.60 0.80 | -15.75 2.26 | 2.48 0.22 | 19.46 0.55 | 17.98 0.10 | 3.15 0.01 | -16.57 | 0.72 0.18 |
| NGC4725 | C | 3.61 0.22 | -20.51 0.28 | 3.00 0.22 | 17.31 0.28 | 19.65 0.13 | 3.66 0.01 | -19.22 | -0.67 0.02 |
| NGC4736 | P | 1.30 0.20 | -19.40 0.28 | 2.20 0.14 | 14.40 0.28 | 17.19 0.20 | 2.76 0.04 | -19.02 | -0.08 0.03 |
| NGC4808 | … | 1.01 0.46 | -15.33 0.69 | 2.27 0.29 | 18.82 0.67 | 18.50 0.04 | 2.96 0.01 | -17.65 | 1.22 0.37 |
| NGC4941 | P | 1.93 0.34 | -16.46 0.50 | 1.97 0.23 | 16.20 0.50 | 19.80 0.10 | 2.96 0.01 | -16.35 | 0.49 0.21 |
| NGC4984 | … | 1.76 0.23 | -20.49 0.41 | 2.68 0.14 | 15.72 0.41 | 21.87 0.17 | 3.80 0.04 | -21.12 | 1.18 0.02 |
| NGC5005 | P | 1.20 0.27 | -20.21 0.31 | 2.25 0.14 | 13.85 0.31 | 18.70 0.17 | 3.50 0.03 | -20.38 | 0.36 0.96 |
| NGC5033 | P | 1.70 0.55 | -19.02 0.51 | 2.24 0.18 | 14.98 0.51 | 20.46 0.10 | 3.65 0.02 | -20.49 | 1.10 0.24 |
| NGC5055 | P | 1.33 0.68 | -20.14 0.96 | 2.98 0.33 | 17.59 0.96 | 18.91 1.68 | 3.48 0.14 | -21.49 | 1.20 0.07 |
| NGC5068 | P | 0.30 0.11 | -11.78 0.35 | 1.67 0.06 | 19.39 0.33 | 19.80 0.05 | 3.07 0.02 | -14.35 | 2.08 0.38 |
| NGC5128 | C | 2.63 0.46 | -20.13 0.41 | 2.66 0.48 | 15.97 0.41 | 17.25 0.24 | 3.16 0.04 | -18.93 | -0.15 0.03 |
| NGC5194 | P | 0.50 0.13 | -19.58 0.22 | 2.78 0.06 | 17.14 0.21 | 18.98 0.10 | 3.47 0.02 | -19.58 | 0.05 0.02 |
| NGC5236 | P | 0.44 0.06 | -19.95 0.11 | 2.42 0.03 | 14.97 0.10 | 18.16 0.07 | 3.49 0.01 | -22.17 | 1.93 0.02 |
| NGC5248 | P | 0.69 0.27 | -19.83 0.50 | 2.74 0.10 | 16.70 0.50 | 19.24 0.18 | 3.42 0.02 | -21.41 | 1.62 0.00 |
| NGC5273 | C | 4.07 0.37 | -18.64 0.51 | 2.63 0.63 | 17.31 0.51 | 19.87 0.15 | 3.24 0.02 | -18.23 | -0.08 0.03 |
| NGC5338 | … | 3.26 0.39 | -17.22 0.53 | 2.88 0.89 | 20.01 0.53 | 21.67 0.28 | 3.17 0.03 | -17.34 | 0.95 0.02 |
| NGC5457 | P | 1.52 0.92 | -16.77 1.34 | 2.57 0.51 | 18.90 1.34 | 20.05 0.09 | 3.47 0.01 | -18.14 | 0.27 1.25 |
| NGC5474 | P | 0.74 0.20 | -16.75 0.22 | 2.50 0.08 | 18.54 0.22 | 20.04 0.24 | 3.09 0.06 | -16.67 | -0.09 0.03 |
| NGC5585 | P | 0.89 0.16 | -16.00 0.19 | 2.39 0.07 | 18.77 0.18 | 19.81 0.06 | 3.09 0.01 | -16.51 | 0.03 0.03 |
| NGC5643 | P | 2.96 0.18 | -18.89 0.30 | 2.30 0.13 | 15.44 0.30 | 18.97 0.07 | 3.40 0.01 | -20.06 | 1.10 0.16 |
| NGC5832 | … | 1.63 1.28 | -15.24 1.23 | 2.31 0.53 | 19.11 1.22 | 19.32 0.17 | 3.17 0.03 | -14.48 | -0.14 0.03 |
| NGC5879 | P | 1.34 0.88 | -18.28 0.85 | 2.53 0.23 | 17.16 0.85 | 20.04 0.37 | 3.27 0.07 | -19.78 | 1.13 0.43 |
| NGC5949 | … | 1.67 0.93 | -14.58 1.53 | 2.29 1.05 | 19.69 1.51 | 19.54 0.18 | 3.18 0.02 | -16.58 | 0.66 0.14 |
| NGC6207 | P | 1.40 0.80 | -16.61 0.60 | 2.71 0.56 | 19.75 0.57 | 19.04 0.95 | 3.08 0.11 | -16.77 | 0.66 0.62 |
| NGC6300 | P | 0.52 0.19 | -18.53 0.34 | 2.70 0.08 | 17.80 0.34 | 18.74 0.05 | 3.39 0.01 | -20.40 | 1.08 0.04 |
| NGC6503 | P | 0.95 0.77 | -13.88 1.33 | 1.72 0.22 | 17.54 1.33 | 18.36 0.06 | 2.95 0.01 | -14.72 | 0.26 0.20 |
| NGC6684 | C | 3.45 0.41 | -19.39 0.52 | 2.72 0.80 | 17.03 0.51 | 19.24 0.19 | 3.14 0.02 | -17.55 | -1.21 0.02 |
| NGC6744 | C | 3.06 0.53 | -20.06 0.50 | 3.18 0.39 | 18.68 0.49 | 20.03 0.45 | 3.79 0.14 | -18.21 | -0.57 0.12 |
| NGC7177 | P | 1.79 0.22 | -19.90 0.23 | 2.73 0.10 | 16.58 0.23 | 18.66 0.14 | 3.17 0.01 | -19.67 | -0.10 0.06 |
| NGC7217 | C | 2.16 0.30 | -21.35 0.37 | 3.27 0.13 | 17.82 0.36 | 19.89 4.89 | 3.55 0.50 | -20.04 | -0.10 0.03 |
| NGC7331 | C | 5.73 0.34 | -22.75 0.48 | 3.73 0.30 | 18.69 0.48 | 18.06 0.23 | 3.48 0.03 | -19.23 | -1.13 0.65 |
| NGC7457 | C | 2.72 0.40 | -19.59 0.48 | 2.85 0.23 | 17.46 0.48 | 19.02 0.17 | 3.49 0.04 | -17.32 | -1.23 0.02 |
| NGC7713 | P | 1.13 0.95 | -15.53 0.72 | 2.32 0.21 | 18.90 0.70 | 19.01 0.40 | 3.33 0.06 | -14.34 | 0.87 0.80 |
| NGC7741 | P | 0.52 0.09 | -17.44 0.12 | 2.83 0.03 | 19.50 0.11 | 20.57 0.07 | 3.37 0.01 | -18.23 | 1.42 0.19 |
| NGC7793 | P | 1.08 0.41 | -15.99 0.50 | 2.26 0.17 | 18.15 0.49 | 18.55 0.06 | 2.99 0.01 | -17.38 | 1.09 0.06 |
| UGC10445 | P | 1.30 0.62 | -14.95 0.56 | 2.77 0.26 | 21.71 0.55 | 21.79 0.25 | 3.26 0.03 | -14.49 | -0.36 0.23 |
Here we show figures of all bulge-disk decompositions used in this paper. For each galaxy the points of the surface brightness profile that are included in the fitting are represented by filled circles, those points not included in the fit are represented by crosses. The fits are represented by three solid red lines, one for the Sérsic function, another for the exponential outer disk, and the third is the sum of the bulge and disk light. We plot all profiles against because to facilitate identification of structural features such as bars and rings.