Bars do drive spiral density waves
Abstract
Recently, Buta et al. (2009, AJ, 137, 4487) examined the question ”Do Bars Drive Spiral Density Waves?”, an idea supported by theoretical studies and also from a preliminary observational analysis (Block et al., 2004). They estimated maximum bar strengths , maximum spiral strengths , and maximum =2 arm contrasts for 23 galaxies with deep AAT -band images. These were combined with previously published and values for 147 galaxies from the OSUBSGS sample and with the 12 galaxies from Block et al. (2004). Weak correlation between and was confirmed for the combined sample, whereas the AAT subset alone showed no significant correlations between and , nor between and . A similar negative result was obtained in Durbala et al. (2009) for 46 galaxies. Based on these studies, the answer to the above question remains uncertain.
Here we use a novel approach, and show that although the correlation between the maximum bar and spiral parameters is weak, these parameters do correlate when compared locally. For the OSUBSGS sample a statistically significant correlation is found between the local spiral amplitude, and the forcing due to the bar’s potential at the same distance, out to 1.6 bar radii (the typical bar perturbation is then of the order of a few percent). Also for the sample of 23 AAT galaxies of Buta et al. (2009) we find a significant correlation between local parameters out to 1.4 bar radii. Our new results confirm that, at least in a statistical sense, bars do indeed drive spiral density waves.
1 Introduction
The response of an outer disk to a rotating bar is intimately related to the maintenance of long lasting spiral arms in galaxies. Optical photometry (Schweizer, 1976) established that besides the gas and young stars, the spirals are present also in the old population. This was confirmed by near-infrared surveys (Eskridge et al., 2002), and is particularly true for grand-design spirals (Knapen & Beckman, 1996). Short-lived stellar density waves can be induced via disk instabilities (Bertin et al., 1977; Goldreich & Tremaine, 1978), or by galaxy interactions (Toomre & Toomre, 1972), but such transient patterns fade after 10 galaxy rotations (Sellwood & Carlberg, 1984), unless they are maintained by some feedback cycle, e.g. due to the swing amplification (Toomre, 1981). On the other hand, spiral arms are excited by a growing bar, as demonstrated by the very first N-body simulations (Hohl, 1971) and by analytical calculations (Athanassoula, 1980).
Support for the bar/spiral connection is provided by the examples where prominent spirals extend from the ends of the bar (see e.g. NGC 1300, p. 525 in Binney & Tremaine 2008, or NGC 986 in Buta et al. 2010). Also, grand-design spirals are more frequent in barred than in non-barred galaxies (Elmegreen & Elmegreen, 1982). Nevertheless, a direct connection between bars and spirals has been difficult to prove observationally.
The possible driving of spirals by bars was addressed by Block et al. (2004), who compared the maximum of bar-related torque strength (the maximum of tangential force amplitude normalized by mean radial force) with the maximum associated with the spirals ,, after separating the bar and spiral components based on their Fourier density amplitude profiles. Near-IR observations were used, to show the effect of the bar on the surrounding mass, rather than on the gas or the formation of young stars. Based on 12 galaxies observed in the -band, Block et al. (2004) found a strikingly clear correlation between and . However, the correlation is less clear in later studies using larger samples and deeper images. In Buta et al. (2005) we analyzed the -band images from the Ohio State University Bright Spiral Galaxy Survey (OSUBSGS, Eskridge et al. 2002) for 147 galaxies, and were able to “weakly verify a possible correlation between and ”. More recently, in Buta et al. (2009) we analyzed deep Anglo-Australian Telescope (AAT) observations for 23 galaxies, with no statistically significant correlation between and , nor between and (the maximum of m=2 Fourier density amplitude of spirals). Similarly, Durbala et al. (2009) found no correlations when analyzing Sloan -band data for 46 isolated barred galaxies; a lack of correlation between bar and spiral arm strengths was seen also by Seiger et al. (2003) who analysed 41 galaxies. Nevertheless, Buta et al. (2009) showed that the correlation is present when combining the AAT data with the previous data sets of Block et al. (2004) and Buta et al. (2005).
In this paper the bar/spiral connection is re-investigated using the same samples which were used by Buta et al. (2005, 2009): the OSUBSGS sample containing 100 barred galaxies, and our AAT sample of 23 barred galaxies. A novel approach is used: instead of comparing the maximum bar strength with the maximum spiral density amplitude, we compare the locally measured bar forcing and spiral amplitude as a function of distance. The locally felt forcing due to bar is a more important parameter than the maximum forcing, since the is typically attained well inside the spiral structure. Also, we examine the spiral density rather than force amplitude, since the former measures more directly the possible response to bar forcing. Using our approach, a statistically significant correlation is demonstrated to exist between the bar forcing and the spiral amplitude, up to a considerable distance beyond the end of the bar.
2 Calculation of bar forcing and spiral amplitudes
We calculate the amplitude of the bar tangential forcing as a function of distance from the galaxy center, , and compare it to the =2 surface brightness amplitude of the spirals, , at the same radial distances, normalized to bar radius, . The Spearman rank correlation coefficient between and and its significance level are then measured as a function of . A non-parametric test is used in order to avoid making assumptions about the distributions of the compared quantities. The distance up to which a significant correlation is found is regarded as a statistical estimate of the region inside which bars are able to drive spiral structure.
We use near-IR images to evaluate the galaxy potential, and derive the tangential force amplitude at each distance, normalized to the azimuthally averaged radial force
Several assumptions are made: (1) the mass-to-luminosity ratio () is constant, (2) the vertical profile of the disk and the bar is approximated with an exponential function, and (3) the vertical scale height, , scales with the galaxy size as (Speltincx et al., 2008), where is the isophotal radius from 2MASS (Skrutskie et al., 2006). The calculations are made with polar integration (Salo et al., 1999; Laurikainen & Salo, 2002), based on azimuthal Fourier decomposition of the deprojected image
which also provides the Fourier density profile used to characterize the spiral amplitudes (note the normalization). The gravity is calculated separately for each component (using ) and added together. Compared to direct Cartesian integration, the polar method suppresses effectively the spurious force maxima which otherwise could arise in the noisy outer disks (Salo et al., 2004). To account for the different 3D-distribution of the bulge light, multi-component decompositions are used (Laurikainen et al., 2005), reducing the artificial tangential force amplitudes arising from the bulge deprojection stretch. The polar method makes it also easy to exclude the contribution of spirals on the calculation of , by setting the Fourier density amplitudes to zero beyond a certain cutting distance, , representing the end of the bar.
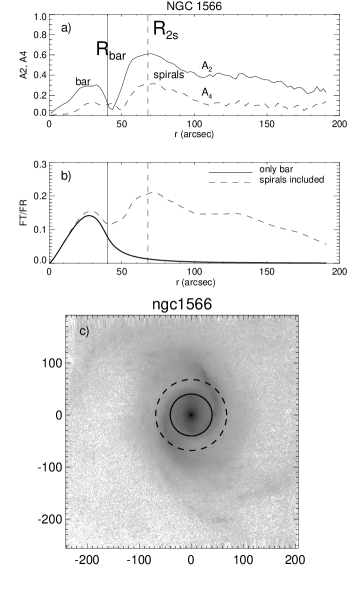
Our method is illustrated in Figure 1, where the radial profiles of the =2 and =4 Fourier density amplitudes, and the ratio are shown for NGC 1566. In this particular example the and have two well-separated local maxima associated with the bar and spiral, but the distinction is not always clear. The profile is constructed both for the total (bar+spiral) force field, and without the contribution of the spiral arms. The bar-only profile is obtained using a cutting distance in the force calculation. Our method of isolating the bar forcing is different from that of Buta et al. (2003, 2005, 2009), who extrapolated the bar density into the spiral region based on Gaussian fits to Fourier density profiles. Here we assume that the bar and the spiral dominate their radial domains with no significant overlap.
3 Bar driven spiral structure in the OSUBSGS and AAT samples
The OSUBSGS is a magnitude-limited sample ( mag) of galaxies with Hubble types . The -band images typically reach mag/arcsec2 in depth. Our bar identifications and lengths are from Table 3 in Laurikainen et al. (2004), and are based on the Fourier amplitude and phase profiles (’Fourier bars’; NGC 2207 was omitted, leaving 103 galaxies for analysis).
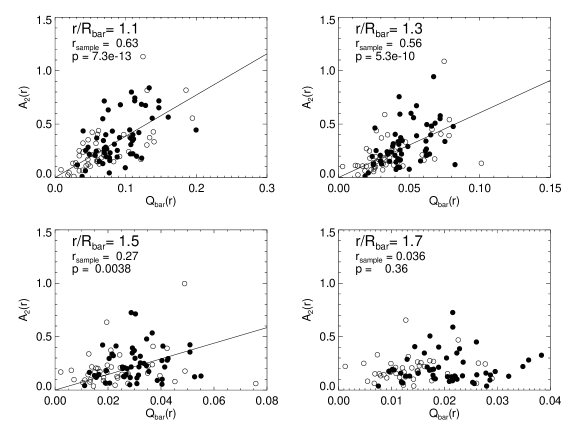
A statistically significant correlation is found between the amplitude , and the bar forcing, , when these parameters are compared at the same radial distances. See Fig. 2 where the different panels represent examples of measurements at successively larger radial distances with respect to the bar. The bar force is cut using , which means that we are conservative in eliminating any contamination by the spiral arms themselves in the forcing. The correlation is very strong just beyond the bar, and stays statistically significant until 1.6 (rank correlation coefficient , significance ). The correlation is similar for long () and short () bars, when normalized to the disk scale length. The range of the significant correlation is similar also for early () and late type () spirals (not shown in the plots).
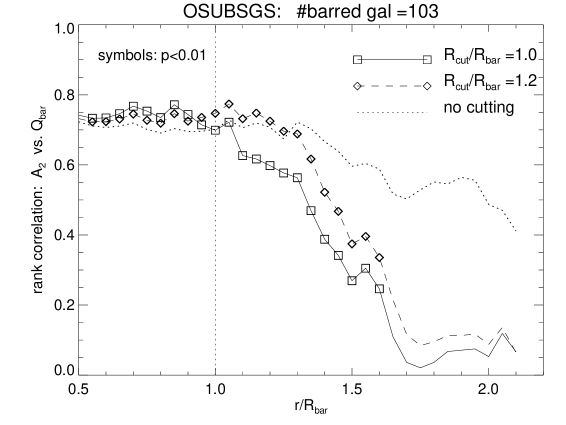
Figure 3 collects the correlation coefficients between and at different distances . Note that in the bar region, where represents the bar itself, the correlation is strong as expected. Outside the bar arises from spiral structures (the forcing is still dominated by the bar). The radial trend depends only slightly on the adopted cutting distance for the bar (using reasonable values ). The correlation is also insensitive to the exact assumptions made about vertical structure: an uncertainty by a factor of two in corresponds to uncertainty in bar strength. Monte Carlo trials show that even random errors in (and ) affect only marginally the significance of the correlation (for trials the median for ).
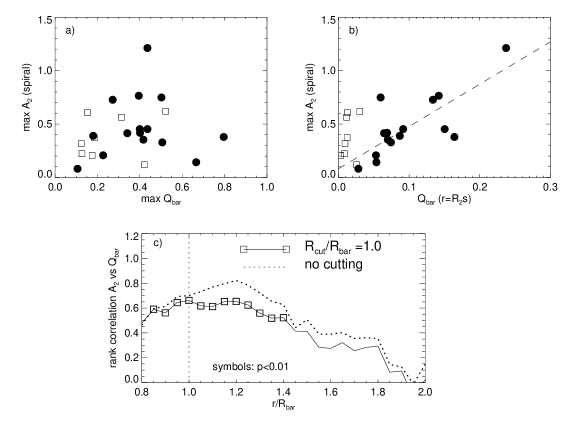
We made a similar analysis for the AAT sample of 23 barred galaxies, using the data and bar lengths from Buta et al. (2009). The -band images typically reach a surface brightness level of 22-24 mag/arcsec2. The sample covers a wide range of bar strengths, extending to strongly barred galaxies, for which case a strongest correlation between and is expected. However, as discussed in Buta et al. (2009), no statistically significant correlation is obtained between the maximum of and the maximum of (Fig. 4a). The result is similar for galaxies having the maximum spiral amplitude nearer () or further () outside the bar. However, a statistically significant correlation is found if the local bar forcing at the location of the maximum spiral amplitude is examined (Fig. 4b). The correlation is particularly clear if we limit to cases where . This is in accordance with our result for the OSUBSGS where a statistical dependence is present but discernible only up to certain distance beyond the bar end. Indeed, if we repeat the analysis we made for the OSUBSGS sample (Fig. 4c), a statistically significant correlation is found between and up to 1.4 . The somewhat smaller range in the AAT analysis is probably due to the smaller sample size in comparison to the OSUBSGS sample.
4 Discussion
4.1 Comparison to previous studies of bar/spiral correlation
Our analysis for OSUBSGS has indicated a significant correlation between the local tangential bar force and the local surface brightness Fourier amplitude , up to 1.6. How does this compare with the previous analyses of vs. , some of which indicated a correlation, while others did not? In Buta et al. (2005) we did not explicitly state the correlation coefficient, but using the data tabulated in the paper one finds a Pearson linear correlation coefficient . For a sample of galaxies this implies a very significant correlation (). Though different quantities are compared, this statistically significant correlation between maximum values agrees with our present analysis of the correlation between local quantities.
Likewise, the negative results in Buta et al. (2009) for the AAT sample alone (N=23), and in Durbala et al. (2009) for the Sloan sample (N=46), are accounted for by the smaller number of galaxies. The standard procedure for testing the significance of a positive linear correlation (see e.g. Wall & Jenkins 2003, Sect. 4.2.2) implies that in order to accept the correlation (at a significance level ), the sample correlation coefficients must be and , for and , respectively. Assume for a while that a linear correlation between and exists, and that these quantities are drawn from a bivariate-Gaussian distribution with an actual correlation coefficient (equal to the sample correlation coefficient in Buta et al. 2005). We may then ask what the odds are of detecting this correlation, i.e. of observing a sufficiently high sample correlation when drawing a random sample with different N’s. Applying the Fisher probability distribution for the sample with a known (Wall & Jenkins, 2003) implies that for there is only a 25% chance of detecting the correlation, even for the change is only about . If we use the rank correlation coefficient instead of the linear correlation coefficient, the chances are reduced to 15% and 38%, respectively (obtained by Monte Carlo trial estimates). Thus the negative results for these small samples do not rule out true correlations.
The current method seems to be capable of exposing the correlation even for fairly small samples, indicating the advantage of comparing the local quantities. In particular, close to the bar the spiral amplitudes are strongly correlated with the bar forcing. This radial dependence of the correlation probably explains the very strong correlation found in Block et al. (2004). The fact that their small sample (N=12) showed the strongest correlation (r=0.86) is likely to result from the way the galaxies were selected, containing many examples where the spirals are strong right at the ends of the bar. Indeed, according to the tabulated values in their paper, the mean ratio between the radial locations of the spiral and bar maximum forces was , compared to in Buta et al. (2005), which was based on a magnitude limited sample of spirals, with many different types of bar/spirals.
4.2 Physical mechanisms
Our observational analysis indicates a clear statistical relation between bars and spirals. At least the following mechanisms might account for this:
1) Spiral structure is a direct response to bar forcing and/or the spirals represent a continuation of the density wave associated with the bar (Lindblad, 1960; Toomre, 1969; Bertin & Lin, 1996). Recently, spiral arms have also been interpreted as manifold orbits emanating from unstable Lagrangian points near the bar ends (Romero-Gómez et al., 2006; Athanassoula et al., 2009).
2) Spirals are coupled to the bar via non-linear resonance coupling (Tagger et al., 1987; Masset & Tagger, 1997). Such couplings are seen in N-body simulations (Rautiainen & Salo, 1999), but it is uncertain how frequent such cases really are.
The first explanation is likely to apply to the strong correlation just outside the bar. In this case the spirals are expected to share the constant (or slowly-evolving) pattern speed of the bar. Similarly, in the case of non-linear coupling, though the spiral pattern speed is slower than that of the bar, it still represents a steady long-lived pattern. On the other hand, in the region where no correlation is present, the spirals are independent structures, representing either a long-lasting mode with a slower pattern speed than the bar (Sellwood & Sparke, 1988), or are just short-lived transient wave packets with a range of propagation speeds (Sellwood & Kahn, 1991; Salo & Laurikainen, 2000).
Note that some correlation may be present even if bars and spirals are independent, since both types of structures are favored by gravitationally more reactive disks. Nevertheless in this case a correlation between maximum values would also be expected.
Sellwood (2008) discusses the importance of distinguishing between long-lived spiral modes and transient waves. This stems from the fact that the latter are much more efficient in driving angular momentum transport in the disk. In case of steady patterns the angular momentum exchange with stars is limited to resonances, whereas in the case of transient patterns this may occur over a large range of radii. Multiple transient patterns also lead to radial mixing of stars, as well as secular heating of the disk.
In the current samples no significant correlation is seen beyond , at which distance the typical force amplitudes associated with the bar fall below a few percent level. This provides an observational lower estimate for the extent of bar-driving. Namely, in the outer disk the determination of the spiral amplitude is more prone to uncertainties due to image noise and background subtraction, diluting any correlation that may be present. Also, we are fairly conservative in cutting the bar contribution close to , since in the case where the spiral arms are a part of the mode associated with the bar, the local spiral forcing would also contribute to maintaining the pattern.
Although the correlation we find is strictly statistical, it is interesting to consider how it applies to the individual example of NGC 1566, shown in Fig. 1. For this galaxy , and the maximum related to the strong spirals is at (Buta et al., 2009), though there are additional spiral arms even beyond . The strong spirals, with a maximum at 1.7 bar lengths, fall marginally in the region where bar-driving is expected. Continuing the same interpretation, the spiral beyond would be an independent pattern. Indeed, NGC 1566 has been quoted as an example of a galaxy with at least two separate spiral structures (Bosma, 1992).
5 Conclusions
A connection between bar forcing and spiral density amplitudes was investigated for two near-infrared galaxy samples: 103 barred galaxies from the magnitude-limited OSUBSGS survey, and 23 barred galaxies in our AAT Survey. The main results are:
(1) For both samples a statistically significant correlation is found between the local tangential bar forcing, , and the local spiral amplitude, , up to a radial distance of 1.5.
The correlation suggests that, at least in a statistical sense, the stellar spirals of the disk are not transient features but rather represent a continuation of the bar mode itself, or are driven by the bar through some mechanism. Further out, the spirals may be either independent modes or transient wave packets.
(2) The obtained range of the correlation is similar for early and late-type spirals ( and ) , and also for small and large bars ( smaller/larger than unity).
This does not favor the idea that only certain types of bars could drive spiral structure, or that the forcing on the stellar component requires the presence of significant gas component. Nevertheless, the current samples are small, and a larger number of galaxies is needed to draw reliable conclusions about morphological type dependencies, or to probe whether the statistical correlation extends to even larger distances beyond the bar. In this respect the forthcoming S4G survey (The Spitzer Survey of Stellar Structure in Galaxies; Sheth 2009, Sheth et al. 2010) will be extremely useful, providing unprecedentedly deep 3.6 and 4.5 micron observations for nearly 2300 nearby galaxies.
References
- Athanassoula (1980) Athanassoula, E., 1980, A&A, 88, 184
- Athanassoula et al. (2009) Athanassoula, E., Romero-Gómez, M., Bosma, A., Masdemont, J. J., 2009, MNRAS, 400, 1706
- Bertin & Lin (1996) Bertin G.,& Lin, C. C., 1996, in Spiral structure in Galaxies: a density wave theory (Cambridge: The MIT Press)
- Binney & Tremaine (2008) Binney J.,& Tremaine, S., 2008, in Galactic Dynamics (Princeton University Press, 2nd edition)
- Bertin et al. (1977) Bertin, G., Lau, Y. Y., Lin, C. C., Mark, J. W.-K., Sugiyama, L., 1977, Pub. Nat. Acad. Sci., 74, 4726
- Bosma (1992) Bosma, A., in Longo, G., Capaccioli M, Busarello G, eds., “Morphological and Physical Classification of Galaxies”, Dordrecth, Kluwer, 207
- Block et al. (2004) Block, D. L., Buta, R., Knapen, J. H., Elmegreen, D. M., Elmegreen, B. G., Puerari, I., 2004, AJ, 128, 183
- Buta et al. (2003) Buta, R., Block, D. L., Knapen, J. H., 2003, AJ, 126, 1148
- Buta et al. (2005) Buta, R., Vasylyev, S., Salo, H., Laurikainen, E., 2005, AJ, 130, 506
- Buta et al. (2009) Buta, R., Knapen, J. H., Elmegreen, B. G., Salo, H., Laurikainen, E., Elmegreen, D. M., Puerari, I., Block, D. L., 2009, AJ, 137, 4487
- Buta et al (2010) Buta, R. et al, submitted to ApJS.
- Durbala et al. (2009) Durbala, A., Buta, R., Sulentic, J. W., Verdes-Montenegro, L., 2009, MNRAS, 397, 1756
- Elmegreen & Elmegreen (1982) Elmegreen, D. M., Elmegreen, B. G., 1982, MNRAS, 201, 1035
- Eskridge et al. (2002) Eskridge, P. B. et al., 2002, ApJS, 143, 73
- Goldreich & Tremaine (1978) Goldreich, P., Tremaine, S., 1978, ApJ, 222, 850
- Hohl (1971) Hohl, F, 1971, ApJ, 168, 343
- Knapen & Beckman (1996) Knapen, J, Beckman, J.E. 1996, MNRAS, 283, 251
- Laurikainen & Salo (2002) Laurikainen, E., Salo, H., 2002, MNRAS, 337, 1118
- Laurikainen et al. (2004) Laurikainen, E., Salo, H., Buta, R., Vasylyev, S., 2004a, MNRAS, 355, 1251
- Laurikainen et al. (2005) Laurikainen, E., Salo, H., Buta, R., 2005, MNRAS, 362, 1319 132, 2634
- Lindblad (1960) Lindblad, P.O., 1960, Stockholm Obs. Ann., Vol. 21, No.4
- Masset & Tagger (1997) Masset, F., Tagger, M., 1997, A&A, 322, 442
- Romero-Gómez et al. (2006) Romero-Gómez, M., Masdemont, J. J., Athanassoula, E., García-Gómez, C., 2006, A&A, 453, 39
- Rautiainen & Salo (1999) Rautiainen, P., Salo, H., 1999, A&A, 348, 737
- Salo et al. (1999) Salo, H., Rautiainen, P., Buta, R., Purcell, G. B., Cobb, M. L., Crocker, D. A., Laurikainen, E., 1999, AJ, 117, 792
- Salo & Laurikainen (2000) Salo, H., Laurikainen, E., 2000, MNRAS, 319, 393
- Salo et al. (2004) Salo, H., Laurikainen, E, Buta, R., 2004 in . L. Block, I. Puerari, K. C. Freeman, R. Groess, & E. K. Block, eds. ASSL, Vol. 319, Penetrating Bars Through Masks of Cosmic Dust. Kluwer, Dordrecht, p.673
- Schweizer (1976) Schweizer, F, 1976 ApJS, 31, 313
- Seiger et al. (2003) Seiger, M. S., Chorney, N. E., James, P. A., 2003 MNRAS, 342, 1
- Skrutskie et al. (2006) Skrutskie, M. F., Cutri, R. M., Stiening, R., Weinberg, M. D., Schneider, S., Carpenter, J. M., and 25 coauthors, 2006, AJ, 131, 1163
- Sellwood & Carlberg (1984) Sellwood, J. A., Carlberg, R. G., 1984, ApJ, 282, 61
- Sellwood & Sparke (1988) Sellwood, J. A, Sparke, L. S., 1988, MNRAS, 231, 25
- Sellwood & Kahn (1991) Sellwood, J. A, Kahn, L. S., 1991, MNRAS, 250, 278
- Sellwood (2008) Sellwood, J.A., 2008, in ’Dynamical Evolution of Disk Galaxies’, Astronomical Society of the Pacific Conference Series 396, eds. G. Funes & E. M. Corsini
- Sheth (2009) Sheth, K. 2009, BAAS Vol 41, 711.
- Sheth et al. (2010) Sheth, K. et al, submitted to PASP.
- Speltincx et al. (2008) Speltincx, T., Laurikainen, E., Salo, H., 2008, MNRAS, 383, 317
- Tagger et al. (1987) Tagger, M., Sygnet, J. F., Athanassoula, E., Pellat, R., 1987, ApJ, 318, L43
- Toomre (1969) Toomre, A., 1969, ApJ, 158, 899
- Toomre (1981) Toomre, A., 1981, in The Structure and Evolution of Normal Galaxies, ed. S.M. Fall (Cambridge Univ. Press), 111
- Toomre & Toomre (1972) Toomre, A., Toomre, J, 1972, ApJ, 178, 623
- Wall & Jenkins (2003) Wall, J.V., Jenkins, C.R. 2003, Practical Statistics for Astronomers (Cambridge Univ. Press)