The Jet-Driven Outflow in the Radio Galaxy SDSS J1517+3353: Implications for Double-Peaked Narrow-Line AGN
Abstract
We report on the study of an intriguing active galaxy that was selected as a potential multiple supermassive black hole merger in the early-type host SDSS J151709.20+335324.7 () from a complete search for double-peaked [O III] lines from the SDSS spectroscopic QSO database. Ground-based SDSS imaging reveals two blue structures on either side of the photometric center of the host galaxy, separated from each other by about kpc. From a combination of SDSS fibre and Keck/HIRES long-slit spectroscopy, it is demonstrated that, in addition to these two features, a third distinct structure surrounds the nucleus of the host galaxy. All three structures exhibit highly-ionized line emission with line ratios characteristic of Seyfert II AGN. The analysis of spatially resolved emission line profiles from the HIRES spectrum reveal three distinct kinematic subcomponents, one at rest and the other two moving at -350 kms-1 and 500 kms-1 with respect to the systemic velocity of the host galaxy. A comparison of imaging and spectral data confirm a strong association between the kinematic components and the spatial knots, which implies a highly disturbed and complex active region in this object. A comparative analysis of the broadband positions, colors, kinematics and spectral properties of the knots in this system lead to two plausible explanations: a.) a multiple-AGN produced due to a massive dry merger, or, b.) a very powerful radio jet-driven outflow. Subsequent VLA radio imaging reveals a clear jet aligned with the emission line gas, confirming the latter explanation. We use the broadband radio measurements to examine the impact of the jet on the ISM of the host galaxy, and find that the energy in the radio lobes can heat a significant fraction of the gas to the virial temperature. Finally, we discuss tests that may help future surveys distinguish between jet-driven kinematics and true black-hole binaries. J1517+3353 is a remarkable laboratory for AGN feedback and warrants deeper follow-up study.
In the Appendix, we present high-resolution radio imaging of a second AGN with double-peaked [O III] lines, SDSS J112939.78+605742.6, which shows a sub-arcsecond radio jet. If the double-peaked nature of the narrow lines in radio-loud AGN are generally due to radio jet interactions, we suggest that extended radio structure should be expected in most of such systems.
Subject headings:
galaxies: jets — galaxies: kinematics and dynamics — galaxies: individual (SDSS J1517+3353)— lines: profiles — galaxies: evolution1. Introduction
Active galactic nuclei are characterized by a non-stellar continuum, narrow emission lines (FWHM ), and often broad emission lines (FWHM ). The narrow lines generally originate in an extended high ionization region, hundreds of parsecs in size, called the Narrow-Line Region (NLR). In rare cases, the narrow lines from an AGN display a double peaked profile (Zhou et al., 2004), with separations between line peaks on the scale of a 100 km s-1 or greater, implying complex kinematics of the scale of the NLR. Recent searches for such double-peaked lines in large spectroscopic databases (Liu et al., 2009; Smith et al., 2009; Wang et al., 2009) uncover that they occur in about a percent of spectroscopic AGN.
Many explanations have been proposed for such double-peaked AGN. These include: unusual kinematics in the NLR, from a bipolar jet or outflow (Whittle & Wilson, 2004; Das, 2005), a highly anisotropic NLR geometry (Falcke et al., 1998; Xu & Komossa, 2009) or an unresolved binary AGN, separated on NLR scales (e.g., Smith et al., 2009). Indeed, current double-peaked narrow line samples may include examples of all such processes. For example, Smith et al. (2009) find that radio-bright AGN are more common in their sample compared to a control sample of non double-peaked SDSS QSOs. A detailed study of examples of double-peaked narrow-line AGN can help unravel ways to discriminate between different explanations. In particular, the phenomenon of merging super-massive black holes (SMBHs) has important implications for galaxy merger statistics and evolution, and narrow-line kinematics have been used to constrain merger rates at (Comerford et al., 2009). In addition, the influence of the AGN on the evolution of its host is an important physical input needed to understand galaxy evolution, but is poorly constrained from observations. Understanding the fraction of double-peaked AGN that are truly merging systems or strong AGN outflows is an important step towards defining reliable samples for studies of galaxy merging and AGN feedback. Here, we present a study of an AGN with strong signatures of a double nucleus, which turns out, after careful analysis, to be a powerful jet-driven outflow.
The intriguing nature of J1517+3353 was noticed during a systematic search of QSOs from SDSS Data Release 7 (DR7) to identify objects with double peaked emission-line profiles in [O III] and certain other emission lines (Smith et al., 2009). Of the approximately AGN with [O III] in the SDSS spectral range, about 40% had sufficient quality spectra to show double peaks of a typical nature. Approximately 1% of the objects had definite double-peaked narrow lines. Only two candidates, including J1517+3353, showed resolved double nuclei in the SDSS images. J1517+3353 was chosen for follow-up spectroscopy because its spectral line profile and appearance in the SDSS images made it appear to be a prime candidate for harboring a double SMBH system.
An interesting point to note is that J1517+3353 is a Type II AGN, despite being classified as a Type I QSO in the SDSS database. Smith et al. (2009) attribute this to a selection bias which causes double-peaked narrow line objects disproportionately to satisfy the SDSS requirement of an emission line wider than km s-1 for classification as a QSO. For clarity, in this paper, the term ’double-peaked narrow line AGN’ refers to AGN with or without broad lines which have two well-defined peaks in their narrow emission lines.
The organization of this paper is as follows: after introducing the observational data (§2), we present basic analyses of the images and spectra (§3-5) and a study the emission line profiles (§6). An ionization analysis (§7) and presentation of new VLA data (§8) is followed by a discussion of the system and implications for AGN merger studies (§9). We assume a flat CDM cosmology with H km s-1 Mpc-1.
2. Observations
2.1. SDSS and Keck Datasets
The most current version of the SDSS J1517+3353 survey dataset was downloaded from the SDSS DR7 Data Access Server (http://das.sdss.org), comprised of images of the galaxy and its surrounding field in the five Survey filter bands (ugriz), as well as a spectrum from the SDSS spectroscopic survey taken through a fibre aperture centered on the galaxy. All data was processed and calibrated by the standard SDSS data pipeline through the SDSS DAS (Adelman-McCarthy et al., 2008).
A major limitation of the SDSS spectroscopic data is its lack of resolved spatial information, which, we will show, is necessary to disentangle the various components in this system. To gain this added dimension, follow-up spectroscopic observations of the galaxy were made on the Keck I telescope, using the High-Resolution Echelle Spectrometer in red-optimized mode (HIRES-r). The spectra were taken on the night of April 21 2008, in twilight as part of a bright object program planned for the end of the night. The median seeing over the period of the observations was about . Sky conditions were clear and transparent.
A -long slit with decker C5 (slitwidth of ) was used. The slit was placed over the centroid of the galaxy in the telescope guide camera and aligned along a position angle of in order to cover both central peaks in the galaxy. This PA placed the slit at an angle of from parallactic, implying that atmospheric dispersion effects, while small, are not negligible (see §6). Image grabs of the slit relative to a half arcminute field of sky around the galaxy were taken a few times during the observing sequence with the HIRES guider camera. These images were subsequently compared to the SDSS images to verify the alignment of the HIRES slit on the sky.
The echelle and cross-disperser grating angles were chosen to place as many emission lines as possible on the green and red CCD chips of the HIRES science camera. Two exposures of seconds each were taken with the same slit alignment. Quartz Halogen and ThAr arc-lamp calibration spectra with the same instrument configuration as the science frames were taken at the end of the night after sunrise.
Spectroscopic calibration and data reduction of the raw HIRES data were performed using the XIDL HIRES Reduction package developed by Jason Prochaska 222Available at http://www.ucolick.org/xavier/HIRedux/. Following bias subtraction and the application of pixel-to-pixel superflats to the science and calibration spectra, the quartz halogen lamp exposures were used to trace the echelle orders. Archived XIDL/HIRES ThAr arc templates were tweaked to match our wavelength calibration arc-lamp exposures. These were then used to generate a wavelength solution for each order. Finally, each curved order was extracted and rectified, giving a set of two dimensional long slit spectra, one per exposure for each echelle order, spanning a wavelength range from , with small gaps in coverage redward of . Cosmic rays were flagged using a sigma-clipping algorithm and the resultant cosmic ray masks were examined visually to verify that compact subtructure in the two-dimensional spectra were not flagged in error.
Following the observations, it was discovered that the HIRES slit had shifted slightly between the two exposures, by less than perpendicular to the long axis of the slit. Since the observations were made in growing twilight, the guiding drift was most likely a result of the strong change in the level of sky background between the two exposures. The most immediate effect is a difference in the shape of the emission lines from the spectra taken during the two exposures. Therefore, in our subsequent analysis, we treated each exposure independently. Interestingly, the line profile differences between exposures largely affect the blue part of the lines, which provides some valuable insight into the spatial structure of the emission line region. Therefore, when appropriate, a comparative approach between the two spectral exposures was employed in the analysis of our HIRES dataset.
2.2. VLA dataset
The moderately bright radio source (B2 1515+34 Colla, et al., 1970) corresponding to J1517+3353 was detected in the FIRST survey (Becker et al., 1995), with a 1.4 GHz flux density of mJy, making it an ideal target for high resolution radio imaging. Consequently, observations were taken with VLA in A-configuration on 30 October 2008 in four bands: 1.4, 5, 8, and 22 GHz. Between 5 and 10 minutes of data were obtained at each frequency. The observations were processed and reduced using AIPS in the standard fashion with flux densities tied to 3C286. CLEANed images were produced with the Difmap package using natural weighting. Integrated flux densities at each frequency band were estimated from the sum of the clean components. Flux densities for the core components were derived in Difmap using gaussian fits to the visibility data. The images and the relation between radio and optical structures are discussed in §8. Flux density measurements are tabulated in Table 3. At the redshift of the galaxy () the FIRST measurement corresponds to a monochromatic luminosity at 1.2 GHz of erg s-1 Hz-1. Comparing to the SDSS optical photometry of the host galaxy, this yields a Kellerman R radio-loudness index of 440 (defined in Kellermann et al., 1989), which is strictly a lower limit, since the host luminosity is dominated by stellar light. The high value of R places J1517+3353 in the category of narrow-line Radio Galaxies.
VLA images for a second radio bright AGN with double-peaked narrow lines were also taken as part of this program. These data are presented in the Appendix.
3. Image Analysis
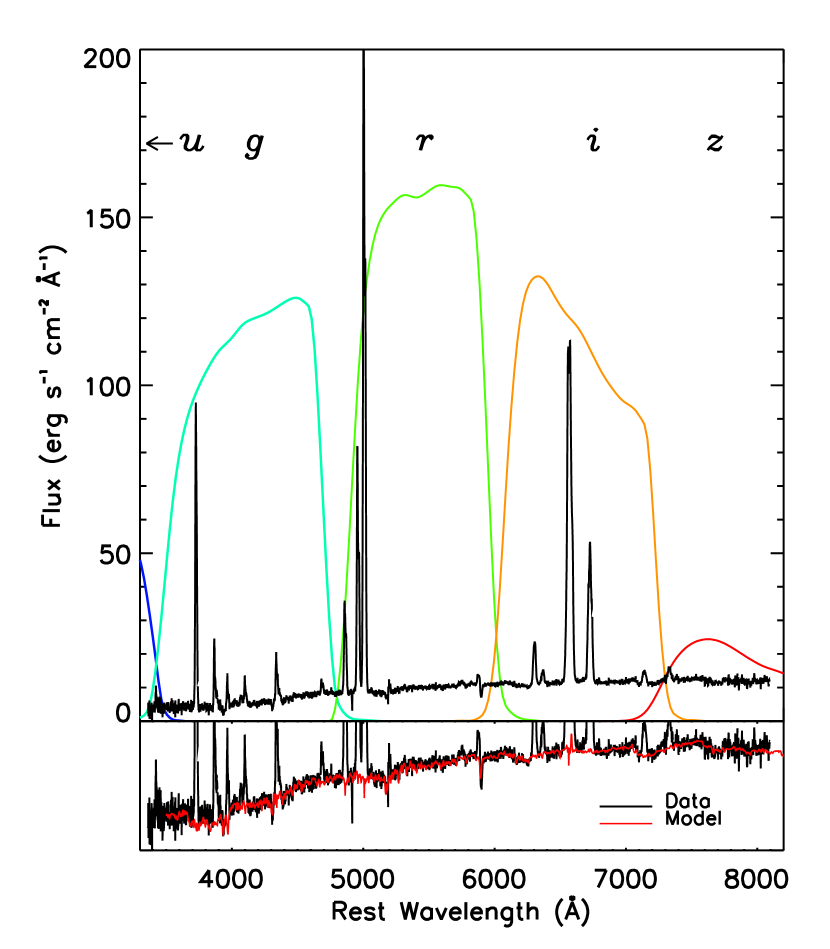
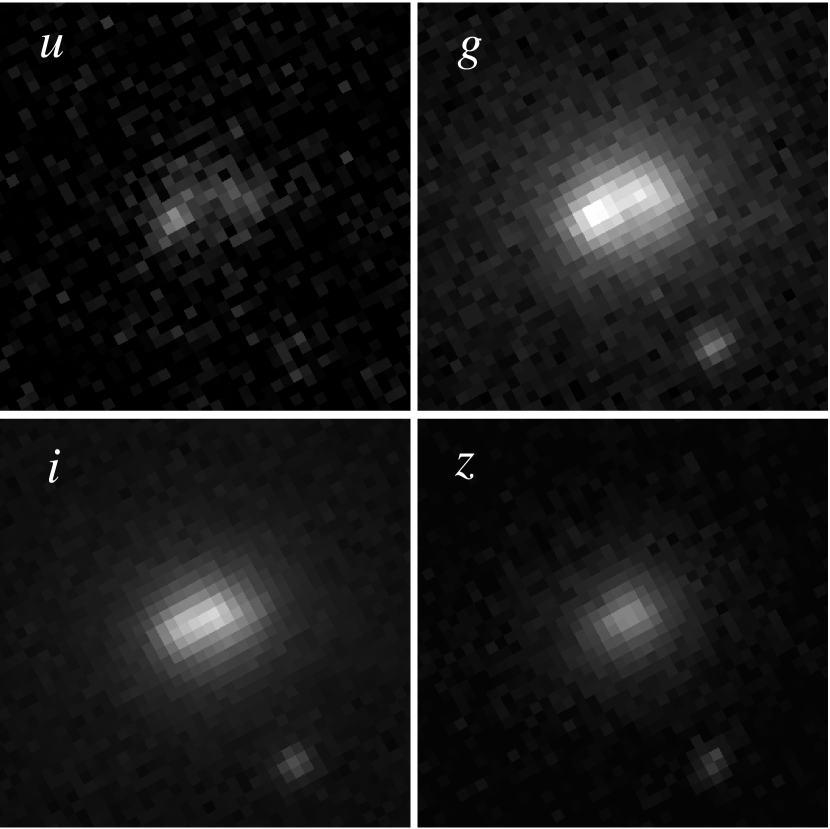
The SDSS survey images of SDSS J1517+3353 bring out the basic structure of its active region well. In terms of overall S/N, the g-band image has the highest sensitivity to faint substructure, but careful consideration of the spectral properties of the galaxy suggest that this is not the best image for a structural study. In Fig. 1, the bandpasses of the SDSS imaging filters are plotted against the SDSS spectrum of SDSS J1517+3353. A number of strong emission lines such as [OII], [OIII] and the H[NII] complex may be identified in this spectrum. The equivalent widths of most of these bright lines are so high that the regions of the gri images within a radius of around the center of galaxy are strongly contaminated by line emission. The light from the galaxy in the z-band, in contrast, is dominated by stellar continuum, implying that only this image actually traces the true shape of the host galaxy stellar distribution. This is brought out in Fig. 2, where we display the ugiz images of the galaxy. The first three images clearly show an elongated central structure, mirroring the near-UV light distribution in the u-band. The z-band shape, however, is more circularly symmetric and uniform, consistent with the expected shape of an early-type host.
The SDSS u-band covers wavelengths blueward of the rest-frame Balmer break and is dominated by Balmer and two-photon nebular continuum emission, with relatively little light coming from stars in this part of the spectrum (see our spectral synthesis discussion in §4). Consequently, the structure of the u-band image very likely traces the emission line distribution and, by extension, the ionized gas distribution in the galaxy. For these reasons, most measurements of gaseous or stellar substructure in this paper were made from the u- and z-band images respectively, despite their lower S/N compared to the images in the other SDSS filter bands.
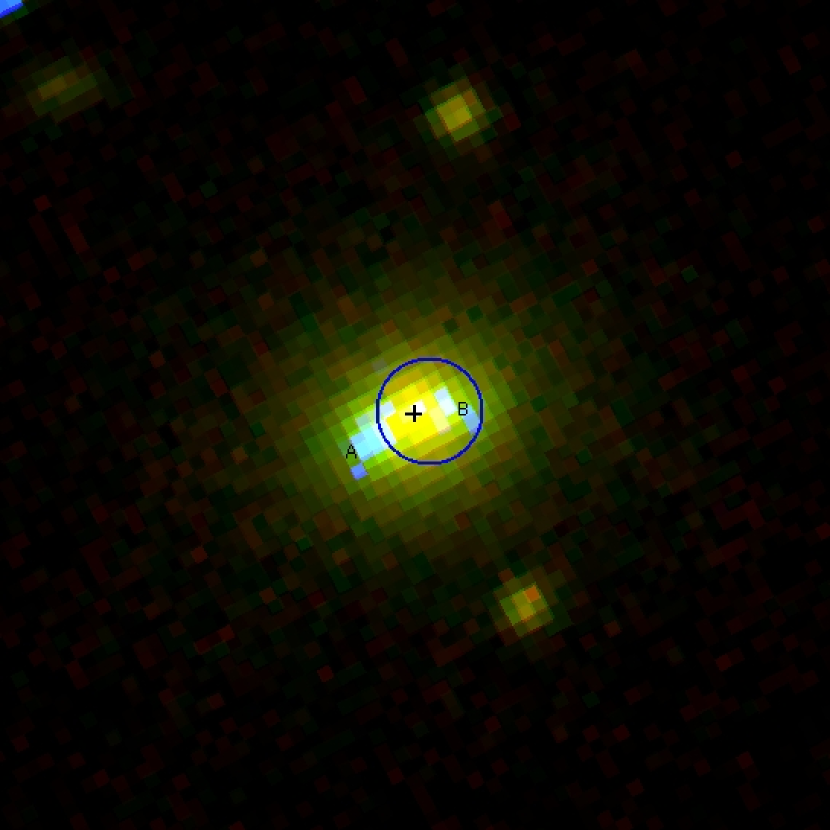
Fig. 3 shows a urz three band color image of SDSS J1517+3353. While most of the galaxy is red [(g-i)], the two knots on either side of the nucleus are considerably bluer. We label them as Knots A and B, as shown in the Figure. From the u-band image, we estimate the separation between the approximate centroids of the blue knots to be , or kpc at the redshift of the galaxy. The center of the host galaxy itself is determined from the centroid of the z-band image and is marked in Fig. 2 by a cross. The two knots are at different distances from this center: A is away while B is away. The entire extent of the central complex of blue features spans roughly , or about kpc.
It is very likely that the central several kpc of SDSS J1517+3353 contains an elongated structure that is distributed very differently from the stars in the galaxy. While the latter is smooth, red and axisymmetric, the former is elongated, knotty and quite blue. The spectral properties of the galaxy’s light sampled by the various SDSS filter bands hint that the blue knots actually trace emission-line bright ionized gas rather than blue stellar continuum from young stars, or featureless AGN light. However, this imaging analysis is far from conclusive. For a more detailed look at the constituents of the galaxy’s circumnuclear region, we turn now to a detailed analysis of the SDSS spectrum.
4. SDSS Spectrum: Line and Continuum Measurements
The location of the SDSS fibre aperture with respect to the galaxy is shown as a blue circle in Fig. 2. The center of the aperture is offset slightly to the west of the actual center of the galaxy. As a consequence, the SDSS spectrum completely samples Knot B, but does not cover the central part of Knot A. Our analysis of SDSS line profiles in §6 suggest that the light from some of Knot A does actually enter the fibre aperture, implying that the knot has an emission line distribution that is spatially resolved from the ground.
The SDSS spectrum (plotted in Fig. 1) covers a rest-frame wavelength range from . The S/N of the spectrum is quite high, with a suite of strong and weak emission lines overlayed upon continuum with numerous stellar photospheric features. Visually, the emission line spectrum is broadly characteristic of a Seyfert II AGN. The ratio of [O III]/H is high, and several high excitation lines are clearly detected, such as [Ne V], the temperature sensitive [O III] and He II.
The richness of the SDSS spectrum, its large wavelength range and high S/N enables us to put valuable constraints on the stellar population of the host galaxy and the physical conditions of the line-emitting gas. Procedurally, these analyses are inter-related. This is because the principal nebular diagnostics of temperature and ionization state depend on the accurate measurement of weak emission lines, which can be influenced substantially by stellar spectral features underlying the line (Keel & Miller, 1983; Filippenko & Halpern, 1984). Accurate spectral modeling with an emphasis on consistently fitting photospheric features is important and also yields some insight into the stellar populations of the host galaxy within the central regions probed by the SDSS spectroscopic aperture.
We modeled the continuum using the set of galaxy template spectra available from the SDSS spectroscopic cross-correlation pipeline 333Available at http://www.sdss.org/dr6/algorithms/spectemplates/index.html. These empirical templates span a range of galaxy types, from early to late. While we are unable to constrain such things are star-formation history and metallicity of the stellar populations using empirical templates, this set is nevertheless ideal for the purposes of continuum modeling, since they are based on spectra taken with the same spectrograph as all SDSS spectroscopic data and, therefore, closely match the wavelength range and resolution of the spectrum of SDSS J1517+3353. Since our primary aim is the careful subtraction of the stellar continuum and not a detailed study of the stellar populations of the host, we chose to use the empirical template suite in the following continuum analysis.
To each galaxy template, we added a combination of Balmer recombination and two-photon continua, constrained to match the strength of the H line. A variable extinction correction in the form of a foreground screen with a Galactic extinction law was also applied. These modified templates were then compared to the restframe galaxy spectrum and the extinction was varied to get the closest fit. The fitting was done by eye, since only a small number of basic galaxy templates were finally used.
The best fitting template was that of a normal early-type galaxy, with an reddening of E(B-V). In Fig. 1 (lower panel, we show the galaxy spectrum with the best-fit template overplotted in red. The fit is remarkably good: both the general shape of the galaxy continuum and the depth of stellar absorption features are matched extremely well over the entire wavelength range of the spectrum. In keeping with the age of typical massive early-type galaxies, the host’s stellar population is likely to be predominantly old, with a median light-weighted age of several Gyrs.
The best-fit synthetic template was subtracted from the spectrum of the galaxy, leaving a pure emission line spectrum. From this, we measured the strengths of all detectable emission lines. Given the quality of the continuum subtraction, line strengths were simply derived by adding up the flux between the wings of each emission line. Statistical errors include uncertainties in the local continuum level and the noise variance of the spectrum. The line flux measurements are listed in Table 1.

5. HIRES spectrum: Registration
The Keck/HIRES dataset addresses the question of whether the two distinct velocity components in the SDSS spectrum are spatially distinct, as expected for a pre-merger binary AGN, and are related to the two blue knots in the SDSS images. The high spectral resolution of HIRES (R ) imparts an added benefit – the velocity substructure of the line-emitting gas is exquisitely resolved; and as we shall show, this brings out an additional important velocity component not apparent in the lower resolution SDSS data.
However, before we undertake a full spatial and kinematic analysis, it is necessary to determine the exact location of the center of the galaxy along the long slit axis so that the structure of the emission lines can be compared with the structures seen in the SDSS images. To do this, we first extracted echelle orders in the reddest parts of the HIRES spectrum where the host galaxy stellar light is strongest and most dominant, while being free of significant emission line contamination. Since the high spectral resolution of HIRES spreads the light from the continuum over a very large number of pixels along the dispersion direction, integrating over a large stretch of red spectrum is necessary to overcome the combined noise from the sky background, read-out and electronic shot noise. We collapsed the red spectral orders in wavelength to obtain a profile of the galaxy continuum light along the HIRES slit. In Fig. 4, this continuum profile is plotted, along with a profile of the integrated [O III] emission line, extracted in a similar way but integrating in wavelength only between the wings of the line. We have applied a shift of to the [O III] profile to correct for the difference in atmospheric refraction between the mean of the wavelengths used to extract the continuum profile ( Å) and the observed wavelength of the [O III] line. The continuum profile has a well-defined peak, corresponding to the position of the center of the galaxy along the slit. In this way, we tie the peak of the continuum light in the SDSS z-band image to a position along the HIRES slit. This location serves as a reference point with which to compare the positions of features in the HIRES and SDSS datasets.
6. Line-Profile Analysis
6.1. Emission Line Kinematics: Description
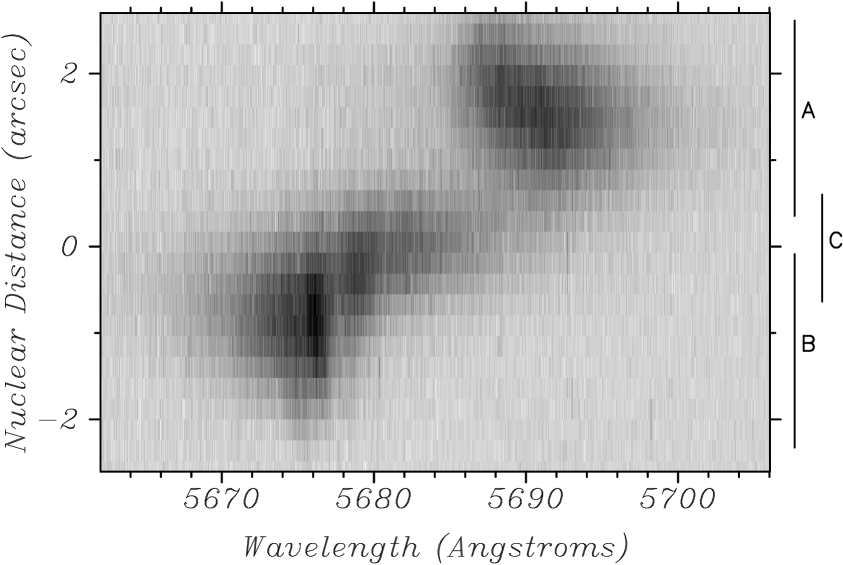
The [O III] emission line from the HIRES spectrum of SDSS J1517+3353 is shown in Fig. 5. The spectrograph dispersion is miniscule compared to the kinematic width of the line and the its shape tracks the kinematics of the line emitting gas within the active region. In general, three relatively distinct structures can be distinguished: two bright features separated by or about kms-1 with blue- and red-shifted kinematics with respect to the systemic velocity of the galaxy, and a third component at intermediate velocities, which spans the location of the nucleus. By comparing the position of the features along the slit to the position of the knots in the SDSS images of the galaxy, it is clear that the bluer feature corresponds to Knot B, while the redder feature corresponds to Knot A. We will call the third region of emission, cospatial with the nucleus, as Feature C. There are tentative clues that this may be a distinct structure: its kinematics appear to differ from Knot B, though both overlap in the sky and may possibly be contiguous in space. Henceforth, we will use the term ‘Feature’ to label a kinematic component and the term ‘Knot’ to label substructure seen in the images. Therefore, we associated Feature A with Knot A and Feature B with Knot B. A close examination of the color image in Fig. 2 indicates a possible faint blue knot coincident with the nucleus, which may be associated with Feature C.
Features A and B display fairly asymmetric line profiles. Feature A has a sharp blue edge and a high velocity, extended red wing. In constrast, Feature B exhibits a somewhat less pronounced extended blue wing. Broadly, the kinematic structure of Feature B is roughly antisymmetric to that of Feature A, and a rough mirror symmetry appears to exist between the profiles of these two features. However, there are some differences in detail. Feature B shows definite kinematic substructure, in the form of a narrow ridge of emission which extends over the length of the Feature and defines its red edge. Feature A, on the other hand, has a much smoother, less peaky profile. Also, Feature A shows a definite gradient in both line asymmetry and peak velocity as a function of distance from the nucleus. If this gradient exists along Feature B, it is far less pronounced and not evident under the the ridge-like substructure which dominates the peak of the line.
Visually, the kinematics of Feature C appear more symmetric, but its emission has to be distentangled from that of the much brighter Feature B before a systematic study of its kinematics can be attempted. To do this, we adopt the technique of gaussian decomposition of line profiles.
6.2. Gaussian Decomposition of Emission Lines
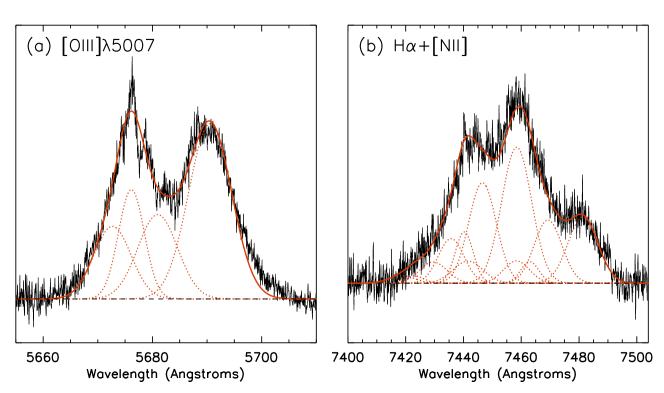
A parametrization of the kinematics of the line-emitting gas may be obtained by fitting gaussian subcomponents to the profile of the [O III] keeping in mind that these components may not necessarily be identified with physically independent structures. Not surprisingly, a single gaussian is insufficient to model the profile of the [O III] line, either integrated or even at any given location along the slit. However, an inspection of the [O III] line highlights some simplifications that serve to guide our fits. Visually, the kinematics of Features A and B are relatively continuous along the slit, so we adopt the following approach. First, we independently fit one to two gaussians to the line profile for the parts of the slit that do not sample Feature C (nuclear distances of for Feature A and for Feature B). Then, we adopt these same gaussians at inner nuclear radii, maintaining their peak wavelength and width, and scale them while fitting additional gaussians to Feature C. In this way, we can determine physically motivated gaussian fits to all three features and model the [O III] line reasonably well (Fig. 6a).
Because of its strong blue wing, Feature B requires at least two gaussians to describe its structure – a narrow component centered at Åwith a line width of Å( kms-1), and a broad component centered at Å with a line width of Å ( kms-1). Feature A can be adequately modeled by a single gaussian centered at Å with a line width of Å ( kms-1), which slightly underestimates the red wing, though within the tolerance of this fitting exercise. After accounting for these three components, we are left with the emission from Feature C, which we fit by a single gaussian centered at Å with a line width of Å ( kms-1). The ratio of the fluxes in the three components is measured to be Flux(A:B:C) = 2.1 : 1.5 : 1.0. Since the various Features are larger than the HIRES slitwidth, we do not have a good handle on slit losses and, therefore, these flux ratios are probably not representative of the actual fluxes in the Features.
The other set of bright emission lines in the HIRES spectrum is the H,[N II] complex. These three lines are strongly blended in the HIRES spectra due to their large line widths. Therefore, we used the gaussian subcomponents from the [O III] line fits to attempt a constrained fit to the H+[N II] complex, by shifting and broadening each [O III] subcomponent appropriately, and scaling all nine shifted gaussians in strength to fit the integrated profile of these lines, as shown in Fig. 6b. We require that the ratio of the [N II] lines be 3:1, dictated by atomic physics. It may be argued that this process is preferable as a way to fit H+[N II], since, in the absence of a strong dependence between gas kinematics and ionization, the average line profiles of all emission lines from a spatially resolved emission line region should be very similar. From Fig. 6b, it is clear that this approach yields very acceptable fits to these lines. The quality of the fit was equally good for the line profiles extracted from both HIRES exposures, strengthening the validity and robustness of our approach.
The details of the [O III] subcomponents and their ratios with respect to H and [N II] are listed in Table 2. Since our HIRES spectra are not flux-calibrated, we used the total flux in [O III] and H+[N II] complex measured from the SDSS spectrum to scale the uncorrected values from the HIRES fits, before estimating the ratios listed in the table.
| Emission Line | Flux ( erg s-1 cm-2) |
|---|---|
| H | |
| H | |
| HeII | |
| H | |
| HeI | |
| H | |
6.3. Emission Lines in the SDSS Spectrum
Valuable insight into the ionization and extinction properties of the gas in the Features may be obtained by combining the results of the HIRES subcomponent fitting with the wider suite of emission lines in the SDSS spectrum, in particular the intermediate strength lines of H and the [S II] doublet.
We start with a three-component gaussian fit to the [O III] line in the SDSS spectrum. In the case of the HIRES data, four gaussian components were needed to completely describe the [O III] line. However, the much lower spectral resolution of the SDSS data prevents us from consistently deblending the two components that constitute the profile of Feature B. Therefore, we treat these two components as equivalent to a single one at lower resolution and only used three gaussians to fit the [O III] profile in the SDSS spectrum. The fit was guided by the results of the HIRES analysis. Given the different sky coverage of the SDSS aperture compared to the HIRES slit, coupled with the highly complex and nonuniform structure of the galaxy’s active region, the subcomponents that were used to fit the [O III] line in the HIRES spectrum do not exactly match the [O III] line the SDSS spectrum. However, slightly altered versions of the HIRES subcomponents, carefully broadened to match the resolution and dispersion of the SDSS spectrum, provide a very reasonable fit. The properties of these subcomponents are listed in Table 2. Note that we did not attempt to fit the wings of the [O III] line in any detail. The wings of emission lines from Seyfert NLRs frequently display ionization properties that differ from the bulk of the line (Whittle, 1985; Veilleux, 1991)
While H is detected in the HIRES dataset, it is much too weak for a profile analysis study. Instead, we use the fit to the SDSS [O III] line, described above, as a template to fit H, as well as few other strong lines in the SDSS spectrum. The [O III] subcomponents were shifted to the observed wavelength of each line to be fitted, corrected for the wavelength-dependent differences in SDSS spectral resolution between [O III] and the line, and then scaled in strength to reproduce the profile of line. Lines fitted in this manner were H, the H+[N II] complex and the [S II] doublet at 6720 Å.
To conclude, using a combination of constrained gaussian subcomponent fits and scaled template matching, we estimate, for each spectral Feature, kinematic parameters such as a bulk velocity and line width, as well as the strengths of six strong emission lines in a fairly self-consistent and controlled manner (Table 2). We are now poised to explore the physical properties of the ionized gas in some detail.
7. Emission Line Properties
With these careful line measurements, we can investigate the ionization state and physical conditions of the line-emitting gas in the Narrow-Line Region of SDSS J1517+3353, with the final aim of discriminating between the two most likely scenarios for the morphology and dynamics of the galaxy: a multiple black-hole merger or a powerful jet-driven outflow.
7.1. Physical Conditions in the NLR
We start by evaluating some basic average properties of the line-emitting gas: its density, temperature and dust content. The electron density of the gas can be estimated approximately from the ratio of the [S II] doublet. For both the high velocity Knots A & B, we estimate the ratio to be , which translates to an electron density log in cm-3. For the nuclear Knot C, , giving log cm-3. The densities of all three Knots are comparable, though the nuclear gas may be slightly denser, at least in the parts of the clouds which emit most of the [S II] line.
For typical AGN Narrow Line Regions, the Balmer decrement HH has a value of 3.1. Deviations from this standard value are a signature of dust extinction in, or along the line of sight to, the line-emitting gas. We have measured H and H for each individual subcomponent in §6, from which, for the three Features A/C/B, we get the ratio of the two lines to be 5.3/4.6/3.3. This implies that Feature A is significantly more dust reddened than Feature B, with Feature C in between. Assuming that the dust is distributed as a foreground screen and follows a Galactic extinction law (Cardelli et al., 1989), we derive the visual extinction towards Features A/C/B to be 1.35/0.98/0.1, after correcting by for the dust in our own galaxy towards the direction of SDSS J1517+3353. This may be compared to the average value of implied by the spectral synthesis analysis in Sec. 4
The [O III] auroral emission line is sensitive to the electron temperature of the ionized gas. Though weak, this line is clearly detected in the SDSS spectrum. We measure the ratio to be , after applying a reddening correction for an average extinction of . Using the standard calibration from Osterbrock (1989) and taking a mean density of log , this yields an electron temperature estimate of K, somewhat lower than a typical AGN NLR, though within the range measured in the normal population.
Finally, we explore whether the emission line region may be composed of an extended complex of H II regions from recent star formation, rather then AGN activity. For this, we look at line ratio combinations which discriminate between AGN and star-forming systems (for e.g, Kewley et al., 2006, and references therein). We measure a ratio of [N II]/H to be 0.65/0.42/0.59 for Knots A/B/C. At these values, AGN/star-forming composite galaxies have [O III]/H less than 1.83/2.95/2.08, whereas we measure this ratio to be 7.37/7.81/6.09, placing all three knots significantly above the transition between AGN and the star-forming sequence. While [N II]/H in SDSS J1517+3353 is somewhat lower than the median value for Seyfert-like AGN, the high [O III]/H ratio clearly places the galaxy in this general class, separate from LINERs. Ionization by the UV radiation from young stars is clearly not very important in exciting the line emission. This is consistent with the continuum spectral analysis of Section 4.1, in which we found that the light of the host galaxy is dominated by an old stellar population, with little or no evidence for blue light from young stars, even blueward of the Balmer break. Hence, whatever mechanism is responsible for ionizing the gas does not contribute greatly to the visible continuum.
| Comp. | [OIII] | Fluxes in other lines | ||||||
|---|---|---|---|---|---|---|---|---|
| Velocity | FWHM | Flux | H | H | [NII] | [SII] | [SII] | |
| B | -300 | 360 | 1250 | 16024 | 529106 | 22166 | 105 | 147 |
| C | 0.0 | 450 | 1200 | 19730 | 91091 | 54181 | 265 | 267 |
| A | 550 | 560 | 1460 | 19830 | 1060100 | 68983 | 240 | 339 |
| Band | Beam size (asec) | Flux Density (mJy) | ||
|---|---|---|---|---|
| Major | Minor | Core | Total | |
| 1.4 GHz (L band) | 2.75 | 1.41 | 92.0 | 127 |
| 5 GHz (C band) | 0.74 | 0.41 | 44.7 | 58.0 |
| 8 GHz (X band) | 0.40 | 0.23 | 32.5 | 39.0 |
| 22 GHz (K band) | 0.14 | 0.09 | 17.0 | 17.0 |
7.2. Ionization of the NLR
The richness of the emission line spectrum allows a detailed look into the processes that ionize the emission line region of the AGN. If the kinematics of the gas are driven primarily by a radio jet, then shocks should be widely present throughout the NLR and serve as a good source of ionizing photons. If, on the other hand, the emission line region is primarily photoionized by merging accreting black holes, we may expect normal nuclear photoionization to dominate the excitation of the NLR.
The dynamical and physical modeling of shocks is a complex process, involving, among other variables, important dependences on geometry and magnetic fields. Shocks compress and collisionally ionize gas, leading to post-shock emission which produces a profuse ionizing spectrum. These ionizing photons then propagate outward from the post-shock region and produce an extended ‘precursor’ region. The emergent spectrum is therefore a combination of shock and precursor emission. The canonical models of Dopita & Sutherland (1995), which we adopt here, successfully reproduce the basic features of emission line spectra of Seyferts and radio galaxies, as long as both shock and precursor emission are taken into account. They predict emission line ratios of most strong emission lines that are very similar to the predictions from standard photoionization models. Unfortunately, this means that we are not able to use strong, well-measured lines to verify the presence or absence of shock-ionized gas, since both shocks and AGN photoionization models generally produce the same relative strengths of these lines. Instead, we turn to line ratios involving weaker lines, such as [Ne V], He II and [O I] which may help discriminate between the two types of models, as shown in Fig. 7. The shock models are shown as solid lines in the Figure, spanning shock velocities from 200 km s-1 to 500 km s-1.
For comparison to the shock models, we employ a set of modern nuclear photoionization models from Groves et al. (2004), which include the effects of dust and a broad spectrum of cloud properties, and are quite successful at matching the strengths of weak AGN lines, while generally maintaining the fit to strong lines. For our purposes, we fix the gas metallicity at twice solar (appropriate for the nuclear regions of massive early-type galaxies) and choose a gas density of cm-3 to match those measured from the [S II] lines. The remaining degrees of freedom in the models are the ionization parameter , defined as the ratio of the number densities of ionizing photons to gas at the face of a cloud, and the shape of the ionizing continuum, assumed to be a power-law in frequency, with a spectral index . The two models tracks plotted in Figure 7 as dotted lines are for of and : each track is a sequence in ionization parameter over the range . These tracks encapsulate most of the ionization variation in the dusty models.
Note that Fig. 7 employs only the integrated line strengths measured from the SDSS spectrum, not measurements from the gaussian fitting treatment. The weak lines in the spectrum do not have the necessary S/N for accurate subcomponent analysis. In order to place J1517+3353 in the context of the broader AGN population, the Figure also contains data points from a sample of nearby Seyferts and NLRGs drawn from the literature.
In general, both sets of models match the line ratios of J1517+3353 well. The photoionization models fail badly in one case (Fig. 7a), where they severely over-predict the strength of [Ne III], considerably more than is observed in almost all the narrow line AGN on the plot. This failure has been noted in previous studies of Seyfert ionization (e.g. Whittle et al., 2005). All in all, the shock models seem to perform consistently the best in matching the measurements. Shock velocities around km s-1 are needed to explain the line ratios – at the low end, but of the same order as the measured FWHM of the kinematic subcomponents. Based on this, we tentatively conclude that shocks are the most likely source of ionization in most of the emission line gas in the galaxy. The limitations of current NLR ionization models prevent any conclusive statements to be made, as photoionization models can also explain most of the line ratios quite adequately.
In summary, the profiles of a number of emission lines from the AGN in SDSS J1517+3353 can be characterized by a minimal set of four gaussian subcomponents which appear to be associated with three spatially and kinematically distinct features seen in the central kpc of the galaxy. These features are bluer than the mean color of the host galaxy and do not trace the galaxy’s light. From our line profile analysis, we see that the kinematics of these features are strongly disturbed, far in excess of any motion that may be driven by virial processes, even in a massive early-type galaxy such as this AGN host. Two of the features, A and B, are in overall bulk motion with respect to the nucleus of the galaxy. Their profiles display some symmetries, but the relative distance of these features from the nucleus are quite different, with Feature B being significantly closer to the center of the galaxy than Feature A. Their gas excitation properties are similar and produce a highly ionized Seyfert-like spectrum, though Feature A is associated with much greater dust extinction, either instrinsic or along the line of sight, than Feature B. The third feature, C, is coincident with the galaxy’s center of light and probably surrounds the true nucleus of the galaxy. Unlike Features A and B, Feature C has a kinematic profile which is quite symmetric. Its excitation properties are a bit different from the two off-nuclear features, with stronger lines from low ionization species.

8. VLA maps
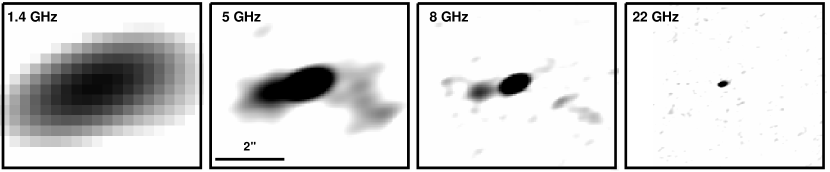
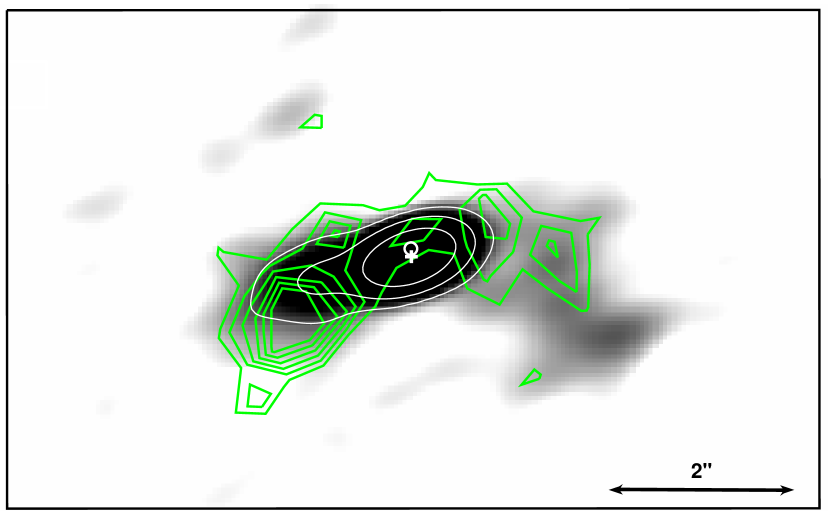
We present four VLA maps of J1517+3353 in Fig. 8 at each of the four bands: 1.4, 5, 8 and 22 GHz. The maps clearly show that the radio source is elongated, with a moderately bright (32.5 mJy at 8 GHz) unresolved flat-spectrum core, and a steep-spectrum bipolar jet which disappear at the highest frequencies (22 GHz). The astrometric position of the radio core is 15:17:9.24228, +33:53:24.5663 (J2000), accurate to 25 mas. The eastern jet is brighter than the western jet and appears more collimated. Of the four VLA images, the 5 GHz map provides the best combination of resolution and sensitivity to extended structure and we adopt this map to compare the radio structure to the optical structures in the NLR. In Fig. 9, contours of the 5 GHz map are overlayed on the SDSS u-band image, with native astrometric information used to align the images. The center of the VLA core lies (0.42 SDSS image pixels) south of the location of the nucleus in the z-band image. Given the restrictions imposed by the seeing limited resolution and the S/N of the SDSS images, we hesitate to attribute this offset to any real difference between the nuclear positions of the galaxy and the radio jet. Instead, we assume that our error in absolute registration between the SDSS and VLA imaging datasets is of the order of . The principal component of this error is the uncertainty of the nuclear position measured from the SDSS z-band image.
Despite the registration uncertainty, it is immediately clear that there is a close similarity in structure between the radio jet and the emission line gas. The western jet shows a strong bend of about at from the core. This bend is traced by the emission-line gas, such that Knot B is cospatial with the location of the jet bend. Knot A appears to border the southern edge of the eastern jet. Based on the extreme kinematics, ionization conditions and physical proximity of the jets and the emission line features, we conclude that the radio source is strongly interacting with gas on kpc scales in the galaxy. This gas is being accelerated and possibly ionized by strong shocks driven by this interaction. Similar structures are found in other radio galaxies at comparable and higher redshifts (Tadhunter et al., 1989; Solórzano-Iñarrea et al., 2001) and a relationship between extended radio jets and the disturbance of AGN emission line regions has been known for decades (Heckman et al., 1981; Whittle, 1992).
As noted in §6.1, Feature B has a narrow ridgeline in its [O III] profile, which appears around the nucleus and extends to about (Fig. 4). Feature A, while being broadly antisymmetric with Feature B, does not appear to show any such ridgeline. This may be related to a difference in the mode of jet-gas interaction between the western and eastern jets. The western jet bends sharply as it emerges from the nucleus. If the bend is produced by a strong interaction between the initially unbent jet and a dense gas cloud near the nucleus, it will be a site of high pressures and strong jet-gas interaction signatures. In such a scenario, the narrow ridge of emission may be a localized area of coherently accelerated ionized gas within the broader outflow. Such a system is known already in the radio Seyfert Mkn 78 (Whittle & Wilson, 2004). In this galaxy, a bend in the radio jet is linked with a region of strong line splitting, which extends for hundreds of parsecs from the location of the bend. A very similar process may be occurring at the bend in J1517+3353. The eastern jet, on the other hand, does not bend and the associated Feature A is smooth, with no conspicuous velocity substructure. We speculate that the difference in radio brightness and the level of collimation between the two jets may also be a consequence of a strong localized interaction in the western jet.
9. Discussion
9.1. The Nature of SDSS J1517+3353
Despite its initial selection as a candidate for a multiple merging black hole system, several lines of evidence confirm that the double-peaked lines of J1517+3353 are due to a strong emission line outflow produced by a jet-ISM interaction. The radio jet and emission line gas are co-aligned and appear to trace each other quite closely. This is characteristic of Radio Galaxies and Seyferts that show jet-ISM interaction signatures (Whittle & Wilson, 2004, and references therein). The profiles of the kinematically distinct components appear to show a particular mirror symmetry (§5.3), consistent with gas accelerated by a bipolar flow or jet. In addition, the emission line spectrum is consistent with ionization by strong shocks with a mean velocity of km s-1, consistent with the line widths of the emission line sub-components. Finally, the host galaxy does not appear to display any obvious signatures of recent merger activity. The isophotes are quite regular and the galaxy colors outside the emission line region are quite red. The stellar continuum appears to be that of an early-type galaxy with some extinction in the central regions, presumably due to dust near the nucleus. There is no sign of the substantial recent star-formation which may indicate a gas-rich merger of the sort that can host merging accreting SMBHs.
9.2. Analysis of the Interaction
Through a combination of spectral line decomposition and high resolution radio imaging, it is possible to now associate the eastern and western radio jets with specific emission line knots. In this way, a comparison can be made between the dynamics of the emission line gas and the energy content of the radio source.
We begin by estimating the mass and kinetic energies of the ionized gas. The extinction corrected Balmer line luminosity is a direct measure of the total amount of ionized gas:
| (1) |
where is the luminosity distance of the galaxy in cm and is the H flux. Using the measurements in Table 2, the masses of Feature A/B are both estimated to be around solar masses. Taking the peak velocity and FWHM as a measure of the motion in the gas, we calculate bulk and turbulent kinetic energies. These are combined to yield total kinetic energies in Features A and B of and ergs respectively.
The internal energy of the ionized gas is related to its density and temperature, and can be parametrized by the mass of ionized gas:
| (2) |
where is the mean molecular weight of the gas. For the Features A/B, we get for both. This is 2.5-3 orders of magnitude lower than the kinetic energy of the gas. If we assume that the emission line luminosity of the gas is erg/s, we derive a timescale at which this internal energy is radiated away years. It is clear that the thermal energy of the ionized gas has to replenished, either through jet-driven shocks or photoionization from the central AGN.
The ionized gas energies may be compared to that of the radio source. A listing of the measured flux densities in the four VLA bands in given in Table 3. The mean radio spectral index of the extended emission between 5 and 8 GHz is . Assuming that this synchrotron spectrum extends between 0.01 GHz and 100 GHz, the total radio luminosity () of the jets can be estimated by normalizing the spectrum to the flux of the jets at 5 GHz, which gives erg s-1. From the 5 GHz image, we estimate the size of the eastern jet to be about , which, if we assume a cylindrical jet geometry, gives a radio-emitting volume of kpc3. Combining this with equipartition energy arguments of Miley (1981), and assuming that the radio emitting plasma has a filling factor , mean relativisitic pressures, magnetic fields and energies are estimated to be dyne cm-2, G and ergs. The synchrotron lifetime of the radio source million years, comparable or longer than a typical lifetime for Seyfert-like activity, and much smaller than the timescale on which the radio-source imparts energy to the emission line gas through shocks and pressure-driven acceleration (see below). Synchrotron emission is probably not a major loss mechanism for the energy in the radio plasma. In addition, the energy content of the radio source, assuming equipartition, is more than two orders of magnitude higher than the kinetic energy content of the ionized gas. Only a small fraction of the energy in the lobes needs to go into accelerating the ISM of the galaxy, through radio source expansion or ram pressure-driven shocks, to fully account for the dynamics of the emission line material. We envision a scenario where the jet propagates rapidly to kpc scales, at velocities much larger than the ionized gas, sweeping up the ISM of the host galaxy and shocking it as it expands. The denser component of the shocked ISM in direct contact with the jet is visible as the NLR. There may be a potentially large fraction of shocked gas which cannot cool efficiently by line emission and may remain invisible (e.g. Mellema et al., 2002). Therefore, the amount of energy from the jet that is lost to line emission is highly unconstrained.
The pressure of the relativistic plasma, acting over the area of the jet, is the principal source of momentum for the ionized gas. A rough interaction timescale can be derived by equating to the measured bulk momentum in the gas:
| (3) |
which yields years, for kpc2 and an average bulk flow velocity of km s-1. The timescale for the acceleration of the gas could be significantly smaller if the major part of the acceleration happened at sub-kpc radii in the galaxy, where is expected to be higher. However, the gas would then have to coast out to where it is currently observed on kpc scales at or below its measured bulk velocity of , adding more than years to the overall timescale for the interaction. The timescale would also be longer if the accelerating force was smaller than determined by , or if the accelerated gas contained a substantial neutral component not detected in emission lines, as implied by some studies (e.g. Morganti et al., 2005). Therefore, is probably a lower limit to the actual time that the jet interaction has been happening in this system.
An upper limit to the energy flux of the jet then follows:
| (4) |
This flux is about an order of magnitude larger than the emission line luminosity and two orders of magnitude greater than the radio luminosity. If the timescale of the interaction is indeed as short as , we infer that only a small fraction of the energy output of the jet is lost to shock-excited radiation or other radiative mechanisms.
How does the energy in the lobes compare to the binding energy of the host galaxy? We estimate a velocity dispersion of the galaxy from the NaD absorption line, which is strong and well-defined in the SDSS spectrum. A gaussian fit to the line yields a FWHM of 14.76 Å which gives a velocity dispersion km s-1, after a small correction for the SDSS spectrograph resolution. The amount of mass that can be unbound by the energy content of the radio source (i.e, ) is given by:
| (5) |
where we have taken the gravitational binding energy of a unit mass of gas in the central regions of the galaxy to be approximately ergs gm-1, assuming that the underlying mass density traces a singular isothermal sphere.
Combining our estimates of and gives M⊙ which should be accurate to dex, given our uncertainties in the mass distribution of the host galaxy and the velocity dispersion. The energy in the lobes can easily unbind the total mass in ionized gas (). If we assume a gas fraction in the galaxy of and taking its stellar mass to be , the gas content of the galaxy, in both hot and cold ISM phases, is estimated to be . The energy in the radio lobes can unbind a good fraction of all the gas in the galaxy and is certainly capable of heating most of this gas to its virial temperature, as long as it is effectively coupled with the ISM. The synchrotron lifetime of the lobes sets a simple upper limit to the efficiency of thermalization of the lobe energy. If the radio source is to serve as a source of feedback to the hot atmosphere of the host galaxy, then the energy in the non-thermal population of the lobes has to be exchanged with the surrounding gas within about 16 million years, or else most of it will be lost to radiation, which couples inefficiently with the hot gas.
9.3. Strong AGN Outflows: Implications for Binary SMBH Searches
J1517+3353 serves as a case study of a powerful AGN outflow that effectively masquerades as a candidate for merging accreting SMBHs. Only through spatially-resolved spectroscopy and radio imaging is its true nature revealed. In the presence of a jet or strong nuclear outflow, it is much more likely that complex line kinematics on kpc scales are the result of gas interacting with the outflow rather than from inspiralling black holes. Smith et al. (2009) find that their double-peaked AGN sample includes more FIRST detected radio bright AGN than the parent QSO population, implying that a non-negligible fraction of the split lines probably come from jet interactions. Whittle (1992) points out that clear non-gravitational kinematics are seen even in radio-quiet Seyferts with 20 cm luminosities W Hz-1. We suggest that a radio prior be applied to double-peaked samples to identify such outflows. A radio galaxy like J1517+3353 can be detected to in wide-area 20 cm mJy-level surveys like FIRST and NVSS, while radio-quiet sources above the threshold from Whittle (1992) are detectable with 100 Jy pointed radio observations out to and with wide-area surveys to . Modestly deep follow-up of double-peaked narrow-line samples with existing radio facilities to separate outflows from true black hole mergers.
About 10% of local optically-selected Seyfert galaxies have total radio luminosities greater than W Hz-1 (de Bruyn & Wilson, 1978; Rush et al., 1996; Ho & Ulvestad, 2001), significantly higher than the fraction of SDSS AGN which show double-peaked profiles. If only one in ten AGN with bright nuclear radio sources have extended jets, outflows can conceivably account for most of, if not the entire, double-peaked population. Clearly, stronger constraints on the radio content of these samples is needed before they can be used to study merger rates and SMBH evolution.
On the other hand, we have demonstrated that double-peaked emission can indicate the existence of powerful, galaxy-wide outflows, where massive AGN feedback is caught in the act. These samples may dentify the best laboratories with which to directly tackle the details of feedback physics, such as the importance of momentum-driven winds, the effects of anisotropic obscuration, and the efficiency of coupling between the output of the AGN and material in the host galaxy.
Appendix A VLA Imaging of SDSS J112939.78+605742.6
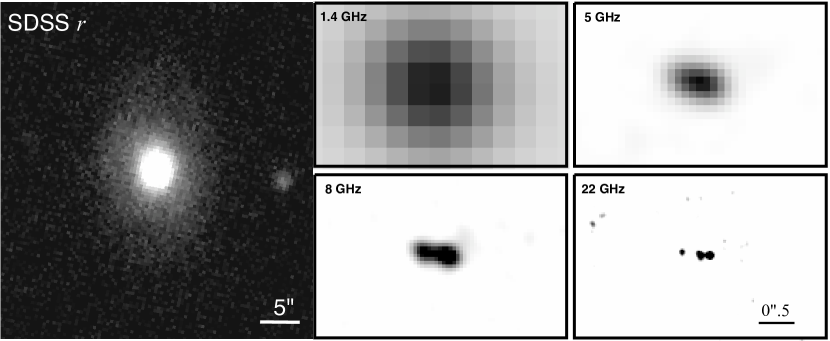
As part of the VLA program described in §2.2, we also imaged a second galaxy from sample of Smith et al. (2009): SDSS J112939.78+605742.6. This object was detected in the NVSS survey with a 1.4 GHz flux density of mJy. The SDSS spectrum of this galaxy shows clear double peaked [O III] lines at a redshift of 0.112, a Type II AGN spectrum and a relatively evolved stellar population, similar to J1517+3353, though the equivalent width of the strong emission lines are several times lower than in J1517+3353. Smith et al. (2009) measure a [O III] line-splitting of 550 km s-1. The SDSS images show a red host with a pronounced central bulge and relatively faint disk, seen at a mild inclination to the line of sight. No evidence can be seen in the images for extended blue nuclear structures; the bulge isophotes appear circular and uniform in all SDSS images.
In Fig. 10, we plot the SDSS r-band image of J1129+6057 and radio maps in the four VLA bands. The radio source is found to be quite compact and resolves into a linear triple structure in the 22 GHz map, reminiscent of a classic core-jet geometry. The centroid of the galaxy bulge from the r-band image lies closest to the middle of the three radio knots and we identify that with a radio core. Unlike J1517+3353, the core in the J1129+6057 radio source is not dominant and is actually weaker than the jets at 22 GHz. The overall size of the radio source is ( pc) between the outer knots, significantly more physically compact than the radio jet in J1517+3353.
Since a clear extended jet structure is seen in this galaxy as well, we believe that the most likely cause of the double-peaked narrow lines is due to a jet interaction. We find no signature of double black holes in this system: the triple structure of the radio source can be explained by an extended source geometry and the location of the core is essentially at the photometric center of the host galaxy, while in a system of in-spiraling black holes, the core would most likely be considerably offset from the galaxy’s center. Unfortunately, the relative association between emission line gas and the jets cannot be verified at this stage given the compactness of the radio source. Emission line mapping at 100 mas scale resolution is needed to do this.
The presence of extended jets in radio bright double-peaked narrow line AGN highlights the role that jet interactions can play in producing disturbed emission line regions. The highly compact nature of J1129+6057 shows that even sub-kpc radio jets can produce NLR-wide disturbances and high resolution imaging is needed to fully study the region of influence of the jet.
References
- Adelman-McCarthy et al. (2008) Adelman-McCarthy, J.K et al. 2008, ApJS, 175, 297
- Baldwin et al. (1981) Baldwin, J. A., Phillips, M. M., & Terlevich, R. 1981, PASP, 93, 5
- Becker et al. (1995) Becker, R.H., White, R.L., & Helfand, D.J. 1995, ApJ, 450, 559
- Binette, Wilson, & Storchi-Bergmann (1996) Binette, L., Wilson, A.S., & Storchi-Bergmann, T. 1996, A&A, 312, 365
- Cardelli et al. (1989) Cardelli, J.A., Clayton, G.C., & Mathis, J.S. 1989, ApJ, 345, 245
- Cohen & Osterbrock (1981) Cohen, R.D., & Osterbrock, D.E. 1981, ApJ, 243, 81
- Colla, et al. (1970) Colla, G., et al. 1970, A&AS, 1, 281
- Comerford et al. (2009) Comerford, J., et al. 2009, ApJ, 698, 956
- Davidson & Netzer (1979) Davidson, D., & Netzer, H. 1979, Rev. Mod. Phys. 51, 715
- Das (2005) Das, V., Crenshaw, D. M., Hutchings, J. B., Deo, R. P., Kraemer, S. B., Gull, T. R., Kaiser, M. E., Nelson, C. H., & Weistrop, D. 2005, AJ, 130, 945
- de Bruyn & Wilson (1978) de Bruyn, A.G., & Wilson, A.S. 1978, A&A, 64, 433
- Dopita & Sutherland (1995) Dopita, M.A., & Sutherland, R.S. 1995, ApJ, 455, 468
- Falcke et al. (1998) Falcke, H., Wilson, A.S., & Simpson, C. 1998, ApJ, 502, 199
- Filippenko & Halpern (1984) Filippenko, A.V., & Halpern, J.P. 1984, 285, 458
- Groves et al. (2004) Groves, B.A., Dopita, M A., & Sutherland, R.S. 2004, ApJS, 153, 9
- Heckman et al. (1981) Heckman, T.M., Miley, G.K., van Breugel, W.J., & Butcher, H. 1981, ApJ, 247, 403
- Ho & Ulvestad (2001) Ho., L.C.& Ulvestad, J.S. 2001, ApJS, 133, 77
- Kauffmann et al. (2003) Kauffmann, G., et al 2003, MNRAS, 346, 1055
- Keel & Miller (1983) Keel, W.C., & Miller, J.S. 1982, ApJ, 266, 89
- Kellermann et al. (1989) Kellermann, K.I., Sramek, R., Schmidt, M., Shaffer, D.B., & Green, R. 1989, AJ, 98, 1195
- Kewley et al. (2006) Kewley, L.J., Groves, B., Kauffmann, G., & Heckman, T. 2006, MNRAS, 372, 961
- Koski (1978) Koski, A.T. 1978, ApJ, 223, 56
- Liu et al. (2009) Liu, X., Shen, Y., Strauss, M.A., & Greene, J.E. 2009, arXiv:0908.2426
- Mellema et al. (2002) Mellema, G., Kurk, J.D., & Röttgering, H.J.A. 2002, A&A, 395, 13
- Miley (1981) Miley, G. 1980, ARA&A, 18, 165
- Morganti et al. (2005) Morganti, R., Tadhunter, C.N., & Osterloo, T.A. 2005, A&A, 444, 9
- Osterbrock (1989) Osterbrock, D.E 1989, ”Astrophysics of Gaseous Nebulae and Active Galactic Nuclei”, University Science Books
- Rush et al. (1996) Rush, B., Malkan, M.A., & Edelson, R.A. 1996, ApJ, 473, 130
- Smith et al. (2009) Smith, K.L., Shields, G.A., Bonning, E.W., McMullen, C.C., & Salviander, S. 2009, arXiv:0908.1998
- Solórzano-Iñarrea et al. (2001) Solórzano-Iñarrea, C., Tadhunter, C.N., & Axon, D.J. 2001, MNRAS, 323, 965
- Stasińska (1984) Stasińska, G. 1984, A&A, 135, 341
- Tadhunter et al. (1989) Tadhunter, C.N., Fosbury, R.A., & Quinn, F.J. 1989, MNRAS, 240, 225
- Veilleux & Osterbrock (1987) Veilleux, S., & Osterbrock, D.A. 1987, etc, etc
- Veilleux (1991) Veilleux, S. 1991, ApJS, 75, 383
- Wang et al. (2009) Wang, J., Chen, Y, Hu, C., Mao, W., Zhang, S., Bian, W. 2009, arXiv:0910:0580
- Whittle (1985) Whittle, M. 1985 MNRAS, 216, 817
- Whittle (1992) Whittle, M. 1992, ApJ, 387, 109
- Whittle & Wilson (2004) Whittle, M., & Wilson, A.S. 2004, AJ, 127, 606
- Whittle et al. (2005) Whittle, M., Rosario, D.J., Silverman, J.D., Nelson, C.H., & Wilson, A.S., 2005, AJ, 129, 10
- Xu & Komossa (2009) Xu, D., & Komossa, S. 2009, ApJ, 705, 20
- Zhou et al. (2004) Zhou, H., Wang, T., Zhang, X., Dong, X., & Li, C. 2004, ApJ, 33, 36