∎
Tel.: +650-424-4001
Fax: +650-424-3994
11email: aschwanden@lmsal.com
GeV Particle Acceleration in Solar Flares and Ground Level Enhancement (GLE) Events
Abstract
Ground Level Enhancement (GLE) events represent the most energetic class of solar energetic particle (SEP) events, requiring acceleration processes to boost GeV ions in order to produce showers of secondary particles in the Earth’s atmosphere with sufficient intensity to be detected by ground-level neutron monitors, above the background of cosmics rays. Although the association of GLE events with both solar flares and coronal mass ejections (CMEs) is undisputed, the question arises about the location of the responsible acceleration site: coronal flare reconnection sites, coronal CME shocks, or interplanetary shocks? To investigate the first possibility we explore the timing of GLE events with respect to hard X-ray production in solar flares, considering the height and magnetic topology of flares, the role of extended acceleration, and particle trapping. We find that 50% (6 out of 12) of recent (non-occulted) GLE events are accelerated during the impulsive flare phase, while the remaining half are accelerated significantly later. It appears that the prompt GLE component, which is observed in virtually all GLE events according to a recent study by Vashenyuk et al., is consistent with a flare origin in the lower corona, while the delayed gradual GLE component can be produced by both, either by extended acceleration and/or trapping in flare sites, or by particles accelerated in coronal and interplanetary shocks.
Keywords:
Solar Flares — Particle Acceleration — Ground Level Enhancements1 Introduction
A key aspect that motivated this review is the question whether ground level enhancement (GLE) events, which apparently require acceleration processes that produce GeV particles, originate from flare regions in the solar corona or from shocks driven by coronal mass ejections propagating through the corona and interplanetary space. GLE events represent the largest solar energetic particle (SEP) events that accelerate GeV ions with sufficient intensity so that secondary particles are detected by ground-level neutron monitors above the galactic cosmic-ray background (Lopate 2006; Reames 2009b). A catalog of 70 GLE events, occurring during the last six solar cycles from 1942 to 2006, has been compiled (Cliver et al. 1982; Cliver 2006), which serves as the primary database of many GLE studies. So, GLE events are very rare, occurring only about a dozen times per solar cycle, which averages to about one event per year. While GLE events with 1 GeV energies represent the largest energies produced inside our solar system, they are at the bottom of the cosmic ray spectrum, which covers an energy range of eV, exhibiting a “spectral knee” between particles accelerated inside our galaxy ( eV) and in extragalactic sources ( eV).
While coronal mass ejections (CMEs) are widely considered as the main drivers of geoeffective phenomena, as pointed out in the so-called “solar flare myth” paradigm (Gosling 1993), the acceleration site of high-energy particles detected in-situ in the heliosphere can often not unambiguously be localized, and thus we have to consider both options. Several timing studies of GLE events have shown evidence for multiple (impulsive and gradual) components, so there is often not a simple dichotomy of acceleration sites. In order to address our central question whether GeV particles producing GLE events are either of solar or of heliospheric origin, we will review various aspects of flare observations of GLE events, such as the relative timing of the release of GLE-associated particles during solar flares (Section 2.1), prompt flare-associated acceleration of GLE protons (Section 2.2), the maximum energies of gamma-ray producing particles in solar spectra (Section 2.3), the height of acceleration regions (Section 2.4), the magnetic topology of solar flare acceleration regions (Section 2.5), and the role of extended acceleration phases and particle trapping in solar flares (Section 2.6). We summarize our conclusions in Section 3. Complementary aspects of the same question from the view of CME-associated shocks are treated in the article of Gang Li, and active region characteristics of GLE-associated flares are reviewed by Nariaki Nitta in this volume.
2 Flare Observations of GLE Events
All GLE events are associated with solar flares of the most intense category, i.e., GOES X-class flares in most cases, althouth there are exceptions, e.g., see the 1979 August 21 event (Cliver et al. 1983) or the 1981 May 10 event (Cliver 2006). At the same time, coronal mass ejections (CME) were reported in all recent cases. Thus we can say that flares and CMEs are both necessary conditions for a GLE event, but it leaves us with the ambiguity where the acceleration of GeV particles reponsible for GLE events takes place. In the following we investigate and review various observational aspects of relevant flare data that could shed some light into this question.
2.1 Solar Particle Release Times
For the analysis of the timing of GLE events we are using initial solar release times that are normalized to the Earth-arrival times of electromagnetic signals, based on the compilation of 16 events during 1997-2006 (Gopalswamy et al. 2010; Reames 2009a) and of 30 events during 1973-2006 (Reames 2009b).
| GLE | Date | Type II | Hard X-ray | SPR | Delay | Delay | Location |
|---|---|---|---|---|---|---|---|
| # | start time | peak time | time | SPR-II | SPR-HXR | ||
| [UT] | [UT] | [UT] | [min] | [min] | |||
| 56 | 1998-May-02 | 13:41 | 13:39:39 | 13:55:02 | +14.0 | +15.4 | S15W15 |
| 57 | 1998-May-06 | 08:03 | 08:05:12 | 08:11:50 | +8.8 | +6.6 | S15W64 |
| 58 | 1998-Aug-24 | 22:02 | 22:05:54 | 22:40:26 | +38.4 | +34.5 | N35E09 |
| 59 | 2000-Jul-14 | 10:19 (10:28∗) | 10:18:45 | 10:24:50 | -3.2 | +6.0 | N22W07 |
| 60 | 2001-Apr-15 | 13:47 | 13:47:06 | 13:54:02 | +7.0 | +8.9 | S20W84 |
| 61 | 2001-Apr-18 | 02:17 | 02:13:27 | 02:32:38 | +15.6 | +19.2 | W115 |
| 63 | 2001-Dec-26 | 05:12 | 05:17:30 | 05:28:56 | +16.9 | +11.4 | N08W54 |
| 64 | 2002-Aug-24 | 01:01 | 01:02:33 | 01:08:26 | +7.4 | +5.8 | S02W81 |
| 65 | 2003-Oct-28 | 11:02 | 11:05:12 | 11:13:26 | +11.4 | +8.2 | S16E08 |
| 66 | 2003-Oct-29 | 20:42 | 20:44:27 | 21:03:56 | +21.9 | +19.5 | S15W02 |
| 67 | 2003-Nov-02 | 17:14 | 17:19:00 | 17:22:08 | +8.1 | +3.1 | S14W56 |
| 69 | 2005-Jan-20 | 06:44 | 06:48:27 | 06:47:50 | +3.8 | -0.7 | N12W58 |
| 70 | 2006-Dec-13 | 02:26 | 02:27:24 | 02:42:20 | +16.3 | +14.9 | S06W26 |
References: Reames et al. 2001 (#59); Aschwanden and Alexander 2001 (#59); Pohjolainen et al. 2001 (#56); Shumilov et al. 2003 (#56); Vashenyk et al. 2003 (#59); Chertok et al. 2001 (#59); Torsti et al. 2004 (#56); Miroshnichenko 2005 (#66,67); Klassen et al. 2005 (#65); Simnett an Roelof 2005a,b (#69); Kocharov et al. 2006 (#56); Martirosyan and Chilingarian 2005 (#69); Kuznetsov et al. 2006 (#69); Simnett 2006, 2007 (#69); Wang and Wang 2006 (#69); Li et al. 2007 (#59); Bieber et al. 2008 (#69,70); Bombardieri et al. 2008 (#69); Grechnev et al. 2008 (#69); McCracken et al. 2008 (#69); Moraal et al. 2008 (#69); Watanabe et al. 2008 (#65); Chupp and Ryan 2009 (#65,69); Li et al. 2009 (#70); Masson and Klein 2009 (#69); Matthiä et al. 2009 (#69); Reames et al. 2009a,b (all events); Wang 2009 (#59); Vashenyuk et al. 2011 (#59-61,65,67,69,70). – *) There are two type II events for the 2000-Jul-14 flare, one starting at 10:19 UT (Chertok et al. 2001), the other starting at 10:28 UT (Gopalswamy 2010).
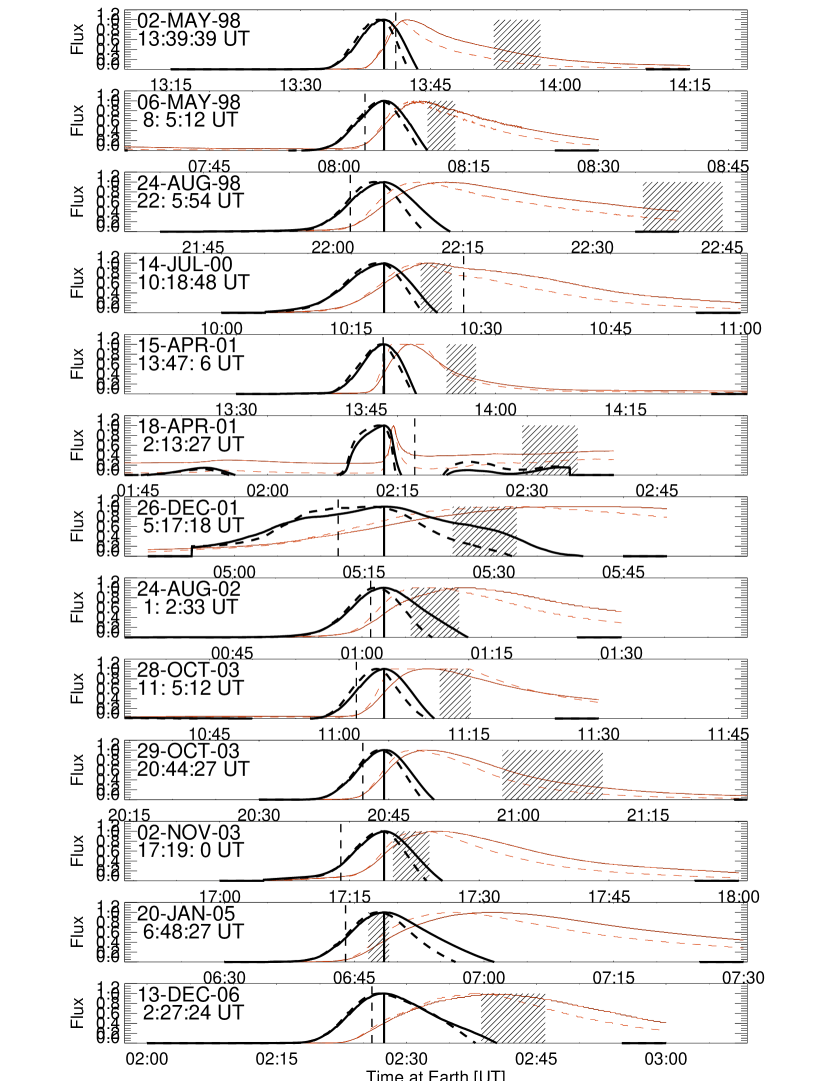
In Fig. 1 we display the time profiles of 13 events (out of the 16 GLE events occurring during 1994-2007) analyzed in Reames (2009a), for which the solar release time could be determined with the velocity dispersion method. The flare time profiles we show in Fig. 1 are the soft X-ray fluxes detected by GOES in the soft (1-8 Å) and hard (0.5-4 Å) channel (red solid and dashed curves), as well as their time derivatives (black solid and dashed curves), which are generally considered as a good proxi of the hard X-ray flux ,
according to the Neupert effect (Neupert 1968; Hudson 1991; Dennis and Zarro 1993; see also Section 13.5.5 in Aschwanden 2004 and references therein). Note that the time derivatives of both soft X-ray channels yield a near-simultaneous hard X-ray peak time ( min) within the accuracy needed here. The time profiles shown in Fig. 1 are all of the same length (1 hr) and centered at the hard X-ray peak time , which we consider as the reference time for acceleration of the most energetic electrons during a flare. The physical explanation for the Neupert effect is that the hard X-ray peak time coincides with the time of most intense precipitation of accelerated high-energy electrons down to the chromosphere (within a time-of-flight interval of ms), which represents the time interval of most intense heating of chromospheric plasma, giving rise to the steepest increase of the soft X-ray flux during a flare. These hard X-ray peak times are listed in Table 1, which typically occur about min after the soft X-ray onset times, but preceed the soft X-ray peak times by about 1-15 min. The start or peak of soft X-ray emission (as listed in GOES flare catalogs) should not be used as a reference time for particle acceleration, because they rather bracket the beginning and end of significant hard X-ray emission and the concomitant acceleration phase.
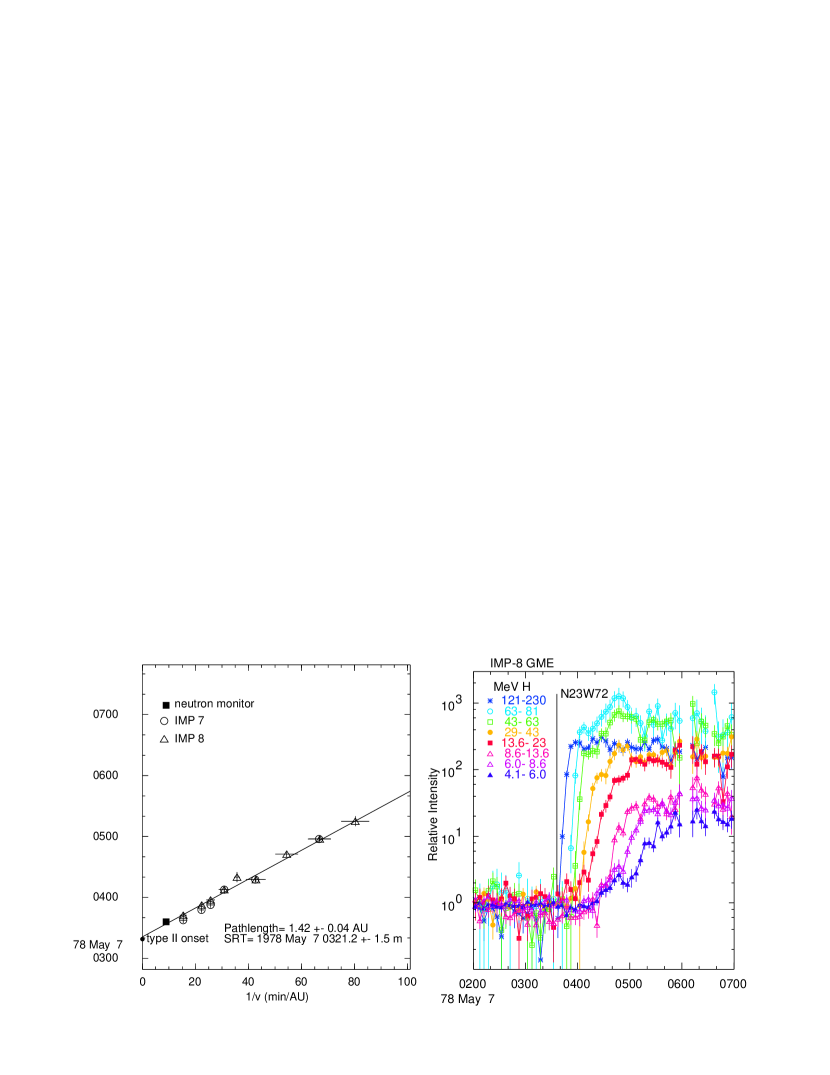
The solar particle release times on the other hand, were measured from the velocity dispersion of particles arriving at ground-based neutron monitors or at particle detectors in near-Earth satellites, such as with the Interplanetary Monitoring Platform 8 (IMP-8) and the WIND spacecraft (Reames 2009a,b). An example of such a measurement is shown in Fig. 2 for the GLE event of 1978 May 7. A plot of the arrival time versus the reciprocal velocity shows a nearly-linear relationship that can be fitted with a linear regression fit and yields the path length ( AU) as well as the so-called solar particle release time within an accuracy of typically min. We list these extrapolated solar particle release times determined by Reames (2009a) in Table 1 and mark their range of uncertainty with a hatched area in Fig. 1. Defining the time interval of the impulsive flare phase where the time derivative of the soft X-ray flux is positive (corresponding to the time interval of impulsive hard X-ray emission according to the Neupert effect), we find that 6 out of the 12 events (50%) have the earliest particle release times overlapping with the impulsive hard X-ray flare phase (ignoring the occulted event #61 on 2001-Apr-18), and thus are consistent with flare-associated acceleration, which is generally called the prompt GLE component. The remaining events have particle release times that start between 8 and 34 minutes later than the hard X-ray peak, which could be produced by acceleration in CMEs, based on the relative timing to hard X-rays. This results is not inconsistent with an earlier review by Cliver et al. (1982), where the most likely injection onset of GeV protons was found to conincide with the first significant microwave peak (which is produced by gyrosynchrotron emission and generally coincides with the production of nonthermal hard X-rays).
Another timing indicator is the onset time of metric type II bursts, which is also listed in Table I (from Gopalswamy et al. 2010). The onset of type II bursts indicate the formation of a CME-related shock front. These type II onset times are indicated with a dashed vertical bar in Fig. 1, which seem to occur mostly during the impulsive flare phase or rise time of soft X-ray emission. Apparently, shocks in these intense X-class flares originate promptly during the flare, about at the same time when the magnetic field becomes stretched out below the erupting filament, which triggers magnetic reconnection, particle acceleration, and chromospheric hard X-ray and soft X-ray emission subsequently. In half of the events, the solar particle release times coincide with both the impulsive hard X-ray flare phase as well as with the onset time of type II bursts (Fig. 1), and thus it is ambiguous whether the prompt component of GLE particles is accelerated in the flare region or in a near-simultaneous type II or CME-associated shock front.
One GLE event, for which the timing was most extensively determined is the second-latest event of 2005 Jan 20. The steepest increase of the soft X-ray flux occurs around 06:48 UT (Fig. 1). Hard X-ray time profiles from RHESSI show a peak of the 50-100 keV and 300-800 keV emission around 06:45-06:46 UT, while the gamma-ray emission at 2-6 MeV, 23-40 MeV, and MeV detected with SONG peak around 06:46-06:47 UT (Kuznetsov et al. 2006; Grechnev et al. 2008). The solar particle release time was determined at 06:39 UT at the Sun (Reames 2009a), corresponding to a photon arrival time of 06:47 UT at Earth, which coincides with the hard X-ray and gamma-ray peaks, and about 3 min after the type II start time at 06:44 UT. Based on the temporal and spectral properties it was concluded that the acceleration site leading to the SEP/GLE spike is likely to be located in the flare region rather than in CME shocks, at least for the leading SEP/GLE spike (Grechnev et al. 2008; Simnett and Roelof 2005a, 2005b; Simnett 2006, 2007; Kuznetsov et al. 2006; Wang and Wang 2006; Bombardieri et al. 2008; Chupp and Ryan 2009; Masson and Klein 2009), while a second component later on could be accelerated in a CME-associated shock at a distance of solar radii (McCracken et al. 2008; McCracken and Moraal 2008; Moraal et al. 2008).
2.2 Prompt Flare-Associated Acceleration of GLE Protons
Most GLE events exhibit a prompt component (PC) and a delayed component (DC), which were identified in nearly all events in a recent study of 35 large GLE events during the period of 1956-2006 (Vashenyuk et al. 2011). The prompt component prevails at the beginning of the event and is characterized by an impulsive profile, strong anisotropy, and by an exponential energy spectrum, i.e. with GeV (within a range of 0.3 GeV 1.8 GeV). The delayed component dominates during the maximum and decay phase of the events, has a gradual intensity profile, a moderate anisotropy, and a powerlaw energy spectrum (with a typical slope of ). In comparison, the study of Moraal and McCracken (2011) identifies a first (prompt) component in 14 events and a secondary (delayed) component in 6 (out of 16 GLE) events during Cycle 23. There is discrepancy in 3 events, where Vashenyuk et al. (2011) registered a delayed component, while Moraal and McCracken (2011) do not detect it.
Since CME-associated shocks last much later than the impulsive flare phase, shock-accelerated particles are likely to increase in number and are subject to a gradual release as long as the shock lasts, and thus are likely not to have an impulsive time profile, while flare-associated hard X-rays exhibit the same impulsive time profile of particle acceleration naturally. However, some theoretical models of CME-driven shocks that include the magnetic field gradient and the evolution of the shock-normal angle from quasi-perpendicular to quasi-parallel orientation predict impulsive time profiles also (e.g., Zank, Rice, and Wu 2000). Nevertheless, the fact that most GLE events (29 out of 35) analyzed in Vashenyuk et al. (2011) exhibit a prompt component, togehter with our finding that the GLE start times occur during the impulsive hard X-ray phase in 50%, is consistent with the interpretation of flare-associated acceleration for the prompt component.
2.3 Maximum Energies of Solar Gamma Rays
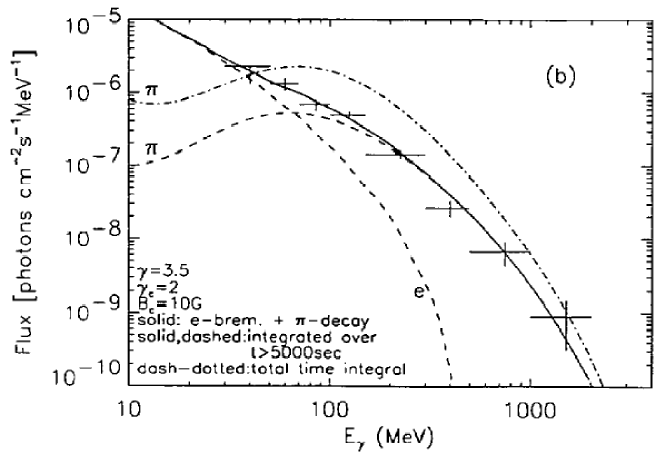
There is no known high-energy cutoff of the electron bremsstrahlung spectrum; the highest energies of observed bremsstrahlung are around several 100 MeV (Forrest et al. 1985; Akimov et al. 1991, 1994a,b,c, 1996; Reames et al. 1992; Dingus et al. 1994; Trottet 1994; Kurt et al. 1996; Rank et al. 2001), see also reviews by Ramaty & Mandzhavidze (1994) or Chupp and Ryan (2009). Gamma-rays were reported up to energies above 1 GeV with the Energetic Gamma-ray Experiment Telescope (EGRET) on CGRO during the GLE event #51 on 1991 Jun 11 (Kanbach et al. 1992). The spectrum of the flare (Fig. 3) could be fitted with a composite of a proton generated pion neutral spectrum and a primary electron bremsstrahlung component (Kanbach et al. 1992). The GLE event #69 on 2005 Jan 20 reported gamma rays, protons, and pion decay radiation up to energies MeV (Grechnev et al. 2008). In Table 2 we list the energy ranges of observed photons in hard X-rays and gamma rays and the required primary particle energies for the various high-energy processes operating in large solar flares (adapted from Ramaty and Mandzhavidze 1994). While we have observational information of maximum energies of electrons above 1 GeV, the maximum energies of protons and ions in this regime can only be estimated indirectly, e.g., by the energy equi-partition argument, or by numerical simulations of a theoretical acceleration model.
The prompt component of GLE proton spectra were found to extend to maximum energies in the range of 0.3 GeV 1.8 GeV (Vashenyuk et al. 2011). Ground-based neutron detectors detect GLE protons at energies GeV, which corresponds to a Lorentz factor of , a kinetic energy of MeV, and relativistic speed of .
| Process | Observed photon | Primary particle |
|---|---|---|
| energies | energies | |
| Bremsstrahlung continuum | 20 keV1 MeV | 20 keV1 MeV |
| 10 MeV | 10 MeV1 GeV | |
| Nuclear de-excitation lines | 0.4,…,6.1 MeV | 1-100 MeV/nucl. |
| Neutron capture line | 2.2 MeV | 1-100 MeV/nucl. |
| Positron annihilation radiation | 0.511 MeV | 1-100 MeV/nucl. |
| Pion decay radiation | 10 MeV-3 GeV | 0.2-5 GeV |
| Neutrons induced in atmospheric cascades | 0.1-10 GeV | 0.1-10 GeV |
| Neutron decay protons in space | 20-200 MeV | 20-400 MeV |
Do these highest observed energies constrain or rule out any acceleration mechanism? For DC electric field acceleration in sub-Dreicer fields, the maximum velocity to which electrons can be accelerated is limited by the value of the Dreicer field, which depends on the density and temperature of the plasma, (statvolts cm-1). Holman (1996) argues that electron energies up to MeV can be attained for high densities of cm-3 and low temperatures MK (yielding a Dreicer field of statvolt cm-1, i.e., 3 V m-1), if electrons are continuously accelerated over a current channel with a length of Mm. The requirement for such large-scale DC electric fields, however, conflicts with the observed time-of-flight delays of hard X-ray pulses (e.g., Aschwanden et al. 1996) and the short inductive switch on/off time scales required for the observed subsecond hard X-ray pulses. Alternatively, Litvinenko (1996) envisions super-Dreicer electric fields, which can generate arbitrarily high maximum electron energies within much smaller spatial scales, and thus can be consistent with the time-of-flight delays of the observed hard X-ray pulses. The maximum energy for relativistic electrons obtained over an acceleration time is approximately,
Litvinenko (2003) identifies plausible physical conditions with super-Dreicer fields of order V m-1 in reconnecting current sheets that lead to electron acceleration with gamma-ray energies of a few 10 MeV in electron-rich flares or to the generation of protons with energies up to several GeV in large gradual flares. A similar acceleration model was applied to the GLE event #59 on 2000 Jul 14 (Li et al. 2007). Also stochastic acceleration can generate 10 MeV electrons and 1 GeV protons (Miller et al. 1997), if a sufficiently high wave turbulence level is assumed (which, however, cannot easily be constrained by observations). Thus, the maximum observed gamma-ray energies imply only constraints for the acceleration mechanism of sub-Dreicer electric DC fields, but not for super-Dreicer DC electric field, stochastic, or shock acceleration mechanisms.
2.4 Height of Acceleration Region
Since we have a temporal coincidence of GLE particle acceleration with respect to flare hard X-ray emission in at least 50%, we turn now to the question of the spatial localization of acceleration sources.
One method to estimate the height of the acceleration region of GLE particles (Reames 2009a,b) is based on an assumed height of the start of radio type II bursts, corrected for the propagation delay of the CME shock front with speed during the time interval between the start of the radio type II burst and the solar particle release time ,
which is always higher than , because and . Reames (2009a,b) assumed a nominal average height of solar radii based on standard coronal density models and statistical start frequencies of type II bursts around MHz (Kundu 1965), which corresponds to an electron density of cm-3 in the case of fundamental plasma emission, i.e., . Taking the propagation delay of min and the CME speeds of km s-1 into account, Reames (2009a,b) arrived at estimated heights of solar radii, with a possible dependence on the heliographic longitude. This method implicitly assumes that particles are accelerated in CME shocks, whose location is entirely tied to the height and propagation speed of the type II and CME shock front.
Alternatively, since half of the GLE events exhibit a starting time during the impulsive phase of hard X-ray emission, we can estimate the height of their acceleration region from the hard and soft X-ray data. The mildly relativistic electrons accelerated in a flare exhibit a time-of-flight delay between their coronal acceleration site and the chromospheric target region where bright hard X-ray emission is observed, depending on their kinetic energy. From the velocity dispersion of these energy-dependent hard X-ray time delays, the propagation distance and height of the acceleration region can be calculated, with proper correction for the geometry of the trajectory and for the pitch angles of the particles.
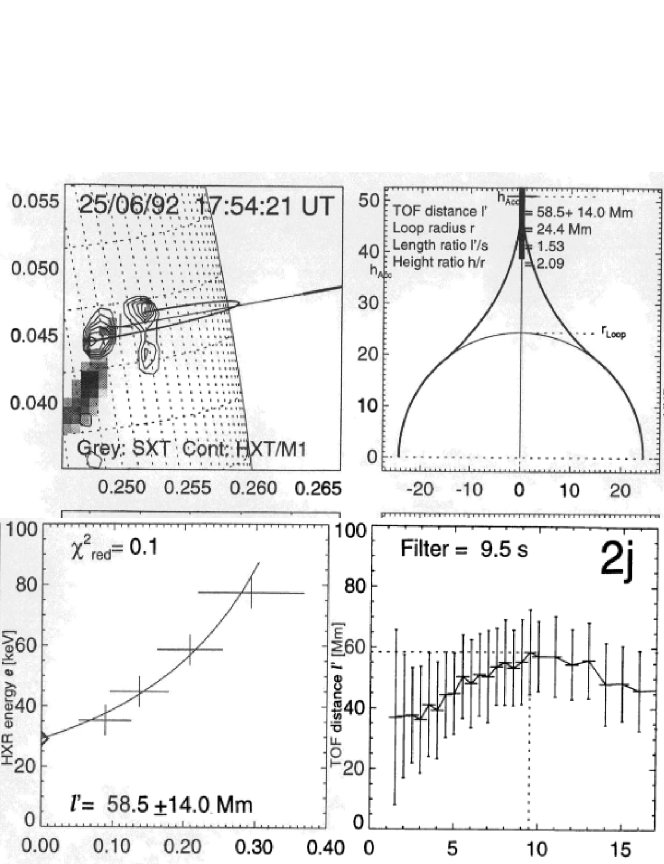
For a GLE precursor flare, which occurred on 1992 June 25, 17:32 UT (hard X-ray start time) at heliographic position N10/W75, such a time-of-flight measurement is available (Fig. 4), based on Yohkoh/HXT and SXT observations (Aschwanden et al. 1996). This flare is of the GOES M1.4-class and peaked in soft X-rays at 17:54 UT. Concomitant hard X-ray and radio emission is also studied in Wang et al. (1995), finding a spatial separation of 35 Mm between the simultaneous hard X-ray and microwave emission, which provides also an approximate scale for the horizontal and vertical extent of the flare region. This flare is a precursor to a GLE event 2 hrs later at the same location, which is listed as GLE event # 53 in Cliver (2006), peaking at 20:14 UT at position N10/W68, and is classified as X3 GOES-class flare. We can consider the two rapidly following events as homologous flares within the same active region that are likely to have a similar magnetic configuration. The time-of-flight distance for the precursor flare was evaluated from the time delay between electrons with relativistic speeds of and in the hard X-ray photon energy range of keV,
which after correction for electron pitch angle, helical twist of field lines, and projection effects of loop size yielded a value of Mm, corresponding to a height of Mm. This is a fairly typical height of the acceleration region for large flares, amounting to about the double height of the soft X-ray loops. From statistics of 42 flares, an average height ratio of was obtained (Aschwanden et al. 1996), for flare loop radii of Mm. Thus, the height range of acceleration regions in flares amounts to Mm, which corresponds to of a solar radius. In summary, since about 50% of the GLE events are consistent with a particle release time during the flare hard X-ray phase, they are expected to have acceleration heights of solar radii.
2.5 Magnetic Topology of Acceleration Regions
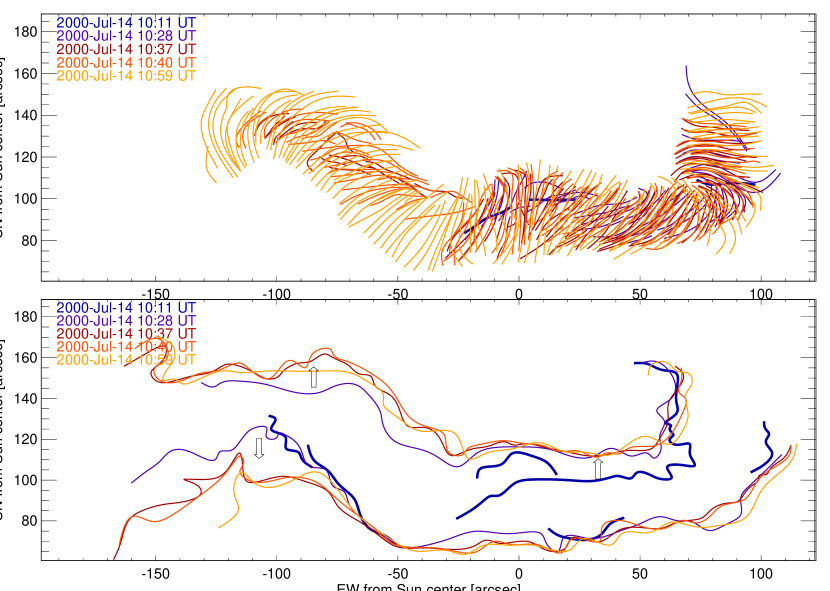
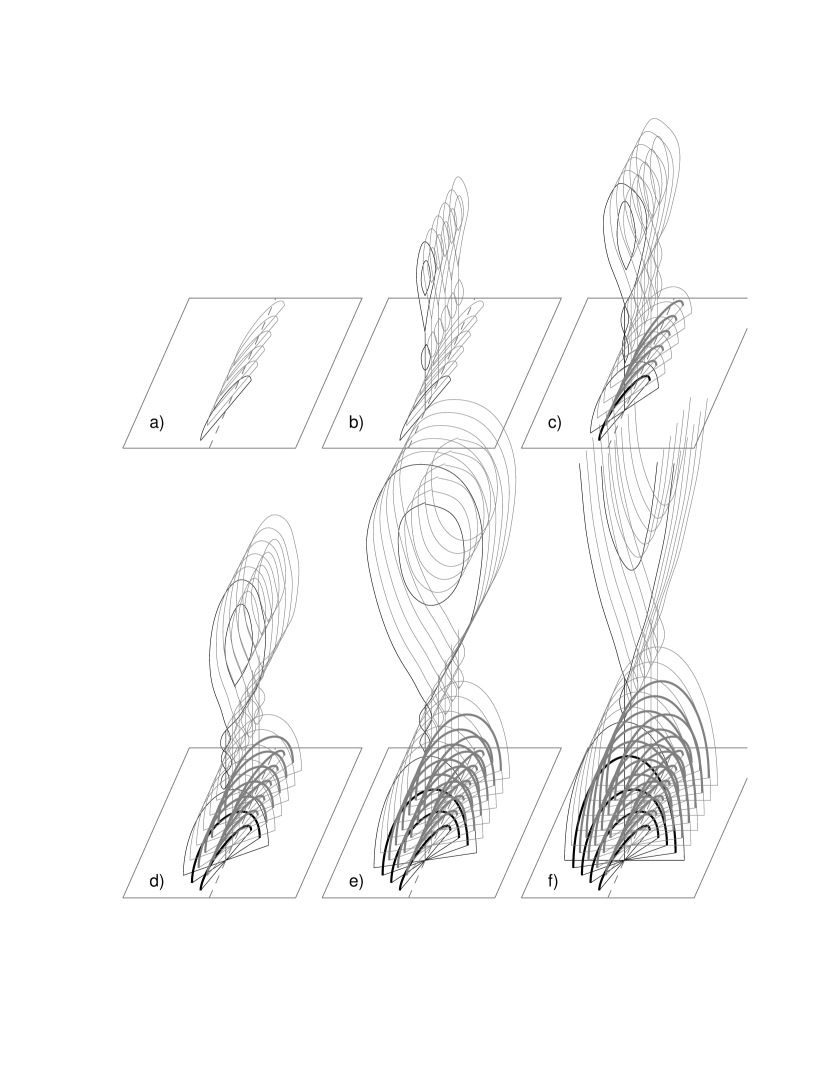
The geometry and magnetic topology of a solar flare region has been studied in most detail for the GLE event of 2000 July 14, 10:18 UT, an X5.7 GOES-class flare (e.g., Aulanier et al. 2000; Aschwanden and Alexander 2001; Aschwanden 2002; Yan and Huang 2003; Aschwanden and Aschwanden 2008). The solar energy release times of the particles responsible for the GLE spike during the Bastille-Day flare is well-synchronized with the rise phase of hard X-ray emission (Fig. 1, Table 1; Reames 2009b; Li et al. 2007; Wang 2009). The Bastille-Day flare was observed near disk center, which provided an excellent view on the projected flare area, which consists of a classical double-ribbon structure as it is typical for most large flares. The double-ribbon structure straddles along a neutral line from east to west, and spreads apart as a function of time (Fig. 5, bottom), as expected in the Carmichael- Sturrock- Hirayama- Kopp- Pneuman (CSHKP) standard flare model. While the CSHKP model essentially describes the vertical evolution in a 2-D cross-section of the flare arcade, the Bastille-Day flare in addition shows also the horizontal projection and the 3-D evolution in detail. From loop tracings at different times during the flare (Fig. 5, top) it is evident that low-lying, highly-sheared loops over the neutral line brighten first, triggering a sequence of flare loops that progresses to higher-lying and less-sheared field lines above the neutral line, until we see a final double-ribbon flare arcade at orthogonal angles to the neutral line, spanning over a width of Mm in NS direction and a length of Mm in EW direction. From this time evolution we can reconstruct the 3-D geometry of the magnetic field lines that are involved in the flare as shown in Fig. 6. Since the bright EUV postflare loops outline the relaxed field line configuration after magnetic reconnection, we can directly infer the size and height of the magnetic reconnection region, which, statistically, is located about a factor of 1.5 above the soft X-ray and EUV postflare loops (Aschwanden et al. 1996), estimated to be in an altitude of Mm with a length of Mm. This height range of the magnetic reconnection region confines the overall volume of the particle acceleration region, although a highly fragmentated structure with many magnetic islands is expected, caused by the tearing-mode instability and bursty reconnection (e.g., Sturrock 1966; Karpen et al. 1995, 1998; Kliem et al. 2000; Shibata and Tanuma 2001).
Some consequences of this magnetic topology for GLE events are: (1) The vertical X-type reconnection geometry allows particle acceleration in upward and downward direction in a quasi-symmetric fashion, so that particles of almost equal energies can be accelerated in both directions; (2) The magnetic field lines above the vertical current sheet of the main reconnection regions are likely to be open, which allows escape of accelerated particles into interplanetary space and along Earth-connected magnetic field lines; (3) The relatively low height in the solar corona ( Mm) provides a large reservoir of thermal particles that can be accelerated in sufficient numbers that are necessary for GLE detection. The escape conditions of accelerated particles into interplanetary space requires open magnetic field lines, which exist not only in coronal holes but also to a substantial fraction in active regions. Schrijver and DeRosa (2003) found from potential-field extrapolations of the global magnetic field over the entire solar surface that the interplanetary magnetic field (IMF) originates typically in a dozen disjoint regions, around the solar cycle maximum. While active regions are often ignored as a source for the interplanetary magnetic field, Schrijver and DeRosa (2003) found that the fraction of the IMF that connects directly to magnetic plages of active regions increases from at cycle minimum up to at cycle maximum, with even direct connections between sunspots and the heliosphere. Evidence for open-field escape routes was demonstrated with magnetic field modeling, for instance for GLE event #70, 2006 Dec 13, 02:27 UT (Li et al. 2009). In flaring regions that expel a CME, particles accelerated in the reconnection region behind the rising filament may be trapped inside the CME bubble and cannot directly escape into interplanetary space (Reames 2002), but may contribute to a seed population for secondary acceleration in CME-associated shocks (McCracken and Moraal 2008). The two populations of directly-escaping and trapped-plus-accelerated particles may be distinguishable as impulsive and gradual phases of SEP events.
2.6 Extended Particle Acceleration and Trapping
The solar particle release time as determined by Reames (2009b) occurs after the peak time of the hard X-ray production phase in 92% (12 out of 13 cases), or after the end time of impulsive hard X-rays in 50% (6 out of 12 non-occulted cases), for the GLE events listed in Table 1 and shown in Fig. 1. The question arises whether we can exclude an interpretation in terms of a flare acceleration site for such delays. If the flare site shows, besides the impulsive hard X-ray phase, also prolonged time intervals with hard X-ray and gamma-ray emission, either an extended (second-step) acceleration phase or extended trapping is possible (e.g., Vilmer et al. 1982), in which case the particles responsible for GLE signatures could possibly be accelerated at the coronal flare site rather than in heliospheric CME shocks. Extended acceleration can be diagnosed from impulsive bursts in hard X-ray, gamma-ray, and radio emission after the impulsive phase, while indicators of extended trapping are: (1) exponential decay of X-ray and gamma-ray light curves, (2) spectral hardening in hard X-rays (Kiplinger 1995; Grayson et al. 2009), or (3) type IV continuum emission in microwaves (produced by gyrosynchrotron emission from trapped high-relativistic electrons). Particle trapping times are limited by the collisional deflection time, which is for electrons
and a factor of longer for ions. Postflare loops usually expand slowly with height, so that the density drops continuously and collisional deflection times (and thus trapping times) become progressively longer. Particle densities in the upper corona drop below cm-3, which enables trapping times over several hours.
The second diagnostic of extended acceleration, the spectral hardening after the impulsive phase, has recently been demonstrated with RHESSI to be a reliable predictor of SEP events (Grayson et al. 2009). From a dataset of 37 magnetically well-connected flares, 12 out of 18 flares with spectral soft-hard-harder (SHH) evolution produced SEP events, and none of the 19 flares without SHH behavior produced SEPs. Three of the 37 analyzed SEP events are GLE events and show all SHH behavior. This demonstrates a statistically significant correlation between SHH and SEP (and GLE) observations. Since the spectral hardening happens in the hard X-rays sources at the solar flare site, as imaged by RHESSI, this link between SHH and SEP is unexplained in the standard scenario of SEP acceleration in CME-related shocks during interplanetary propagation.
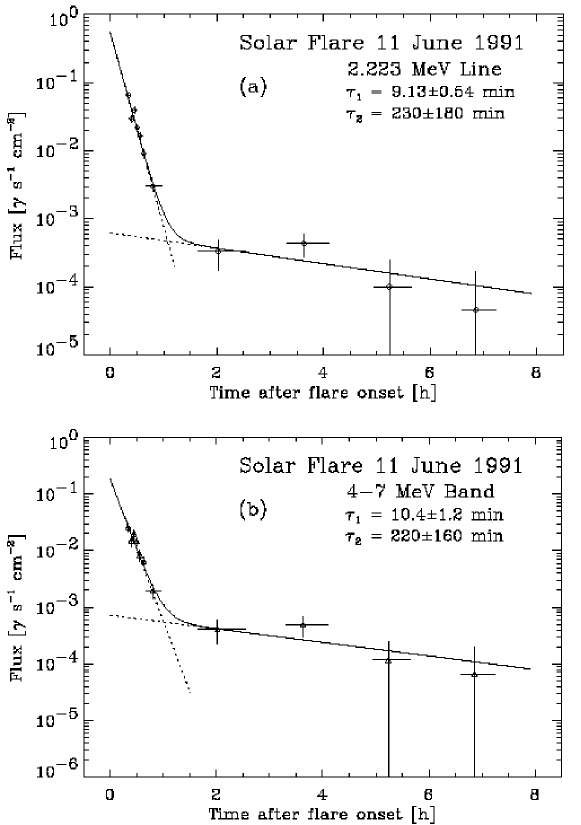
Extended gamma-ray emission with exponential decay times has indeed been observed up to 5-8 hours after the impulsive phase of the GLE event #51 on 1991 Jun 11 (Fig. 7) and GLE event #52 on 1991 Jun 15 (Kanbach et al. 1993; Rank et al. 1996, 2001). Evidence for prolonged acceleration of high-energy protons ( MeV) accelerated in flares and postflare loop systems, with associated spectral hardening late in the flare, was also discussed for GLE event #52, 1991 Jun 15, 08:17 UT (Chertok 1995), for GLE event #55, 1997 Nov 6, 11:55 UT (Klein and Trottet 2001; Murphy et al. 2001; Masuda 2002; Masuda and Sato 2003), for GLE event #59, 2000 Jul 14, 10:24 UT (Livshits and Belov 2004; Li et al. 2007; Wang 2009), and for GLE event #70, 2006 Dec 13, 02:27 UT (Li et al. 2009). Evidence for extended particle acceleration in the lower corona was also demonstrated from microwave gyrosynchrotron emission, requiring high magnetic fields near sunspots, e.g., for GLE event #69, 2005 Jan 20, 06:48 UT (Grechnev et al. 2008; Masson et al. 2009). The GLE event #65 on 2003 Oct 28, 11:05 UT, shows multiple phases of impulsive particle injections, ending with a gradual phase ( hr) of type III bursts that starts 25 min after the first type III bursts (Klassen et al. 2005; Miroshnichenko et al. 2005). While there is ample evidence for extended acceleration of electrons in flare sites and flare-associated radio burst sources, the situation is less clear for ions and protons; extended acceleration of ions and protons can occur concomitantly in the same flare site, or alternatively in propagating CME shocks (e.g., Cliver 1996).
Let us also review the four GLE events listed in Table 1 that exhibit the largest delays in solar particle release times . The GLE event #56 on 1998 May 02, 13:38 UT, has a delay of min, at a time when the impulsive flare phase is over, but the radio dynamic spectra from Artemis IV show type IV continuum emission at frequencies of MHz during 13:42-13:50 UT (see Fig. 8 in Pohjolainen et al. 2001), a clear sign of gyro-synchroton radiation from trapped high-relativistic electrons during the GLE particle release time.
The GLE event #58 on 1998 Aug 24, 22:05 UT, has the longest delay of min, but the USAF/ RSTN data (http://cdaw.gsfc.nasa.gov/meetings/lws-cdaw2009/data/White/) show a late increase of 15.4 GHz radio emission after 22:30 UT, which is an indicator of trapped high-relativistic electrons.
The GLE event #61 on 2001 Apr 18, 02:12 UT, has a delay of min, but this flare is occulted by behind the limb, which may explain the offset timing due to the missed hard X-ray and soft X-ray peak. In an occulted flare we do not see the prompt hard X-rays from the footpoints, but only the prompt soft X-rays in coronal heights visible above the limb. The coronal high-temperature plasma above the limb cools faster (by conductive cooling) than the bulk of occulted soft X-ray plasma that gradually fills the postflare loops by chromospheric evporation. Thus, the time profile of soft X-ray emission in occulted flares decays faster than in unocculted flares, and thus we underestimate the full duration of impulsive hard X-ray emission using the time derivative of soft X-rays.
The GLE event #66 on 2003 Oct 29, 20:44 UT, has a delay of min, but the USAF/RSTN data show very bursty radio spikes late in the flare during 20:50-20:56 UT at 610 MHz, a possible indication of a secondary acceleration phase producing electron beams in the lower corona. In summary, we observe in all cases with late GLE solar particle release times signs of extended particle acceleration or trapping, which does not exclude that the particles responsible for the GLE signatures have been accelerated and temporarily trapped (for min) at the solar flare site.
3 Conclusions
We explored here the question whether the largest SEP and GLE events that accelerate ions with energies of GeV could be accelerated in solar flare regions, in contrast to the generally accepted paradigm of acceleration in heliospheric CME shocks. We reviewed the pro and con aspects from the solar flare site that are relevant to answer this question, while the complementary aspects from CME-associated shocks are discussed in the companion article by Gang Li. The major arguments for a flare-driven acceleration of GeV particles are: (1a) the coincidence of the particle release time with the impulsive flare phase (in 50%), (2a) the similarity of the impulsive time profiles of the first GLE component with the impulsive flare phase in hard X-rays, (3a) observational evidence of maximum energies MeV in electron bremsstrahlung, and (4a) the relatively high magnetic field and free magnetic energy that is available in flare sites, compared to the locations of interplanetary CME shocks. In contrast, major arguments against this interpretation are: (1b) significant delays of the particle release time with respect to the impulsive flare phase (in 50%), and (2b) the lack of direct observational evidence and diagnostics for GeV protonts and ions in flare sites. The conclusions are based on observations of 70 GLE events over the last six decades, in particular on the 13 GLE events during the last solar cycle 23 (1998-2006) that provided excellent new imaging data in gamma rays and hard X-rays (RHESSI), in soft X-rays and EUV (TRACE, SOHO/EIT), and particle data from IMP, WIND, and ACE. Our conclusions are:
-
1.
Solar particle release times of GLE-producing particles overlap with the impulsive phase of gamma-ray and hard X-ray emission in solar flares in 6 out of 12 (non-occulted)cases, and thus the acceleration time of GLE particles is consistent with the flare site in 50% of the cases, taking the full duration of impulsive flare hard X-ray emission ( min) into account.
-
2.
In the remaining cases, 6 our of 12 occur delayed to the flare peak by min, but observational signatures of extended acceleration and/or particle trapping are evident in all strongly delayed cases, and thus all GLE events could potentially be accelerated in flare sites. The alternative explanation of delayed second-step acceleration in CME-associated shocks cannot be ruled out, however, possibly constituting a secondary gradual GLE component.
-
3.
The height of the acceleration region of 1 GeV electrons and ions depends on the interpretation, being solar radii for flare site acceleration (according to electron time-of-flight measurements), or solar radii for CME shock acceleration (according to type II source heights and GLE solar particle release delays).
-
4.
The magnetic topology at the particle acceleration site is not well-known from magnetic modeling or tracing of coronal structures, but there is statistical evidence for open-field regions in most active regions that provide escape routes for GLE particles.
-
5.
The recently discovered strong correlation between the spectral soft-hard-harder (SHH) evolution of solar hard X-rays and SEP events poses a new challenge. It is presently unclear how the SHH evolution can be explained in the context of the standard scenario in terms of SEP acceleration in CME-associated shocks.
-
6.
The maximum particle energies observed in solar flares reach up to several 100 MeV for electrons and above 1 GeV for ions. The required particle energies are GeV for the observed bremsstrahlung continuum at photon energies of MeV, and GeV for pion decay radiation observed at photon energies of 10 MeV 3 GeV, which is sufficient to explain GLE detections.
-
7.
Energies up to GeV can be achieved for DC electric field acceleration in super-Dreicer fields, for stochastic acceleration, and for shock acceleration. Only DC electric field acceleration in sub-Dreicer fields can be ruled out, based on the large distances of DC fields required and the inconsistency with measured electron time-of-flight delays.
What do we need to answer the question of the origin of GeV particles with more certainty? The velocity dispersion measurements with IMP, WIND, and ACE helped enormously to narrow down the start window of solar particle release times, which could be complemented with directivity measurements of the particle detector IMPACT on STEREO. The most sensitive hard X-ray and gamma-ray detectors existed on CGRO, but in near future we have only RHESSI available. However, RHESSI provides excellent imaging capabilities, which revealed intriguing information on displaced electron and ion acceleration sites in the solar corona (Hurford et al. 2003, 2006). In addition we expect also improved magnetic modeling of solar flare regions that can reveal open-field and closed-field geometries with more certainty, using nonlinear force-free field (NLFFF) codes (e.g., Bobra et al. 2008; DeRosa et al. 2009) with 3-D vector magnetograph data from the Solar Dynamics Observatory (SDO), possibly in conjuction with stereoscopic 3-D reconstruction of flaring active regions using STEREO/EUVI.
In conclusion, acceleration of GeV particles in flare sites is a possibility that cannot be firmly ruled out with the current localization capabilities of energetic particles. Certainly we have evidence for both acceleration in coronal flare sites and in heliospheric CME shocks, often appearing concomitantly, but with different (impulsive vs. gradual) time scales, relative timing, and charge state characteristics. While one-sided emphasis has been given to both, either flares (the “big flare syndrome”), or CMEs (the “flare myth”; Gosling 1993), there is a consensus now that both flare and CME phenomena are part of a common magnetic instability, and that both are being able to accelerate particles to high energies. The remaining questions are then mostly what the relative proportions of both components are and how we can discriminate between them. A preliminary answer is that the observations are mostly consistent with a flare-associated “prompt GLE component” and a CME-associated “delayed GLE component”.
Acknowledgements.
We thank the anonymous referee for pointing out a crucial timing correction, and Ludwig Klein for complementary comments. This work resulted from two Coordinated Data Analysis Workshops (CDAW) on Ground Level Enhancement Events (GLEs), held in January 2009 in Palo Alto, California, and in November 2009, Huntsville, Alabama, organized by Nariaki Nitta and Nat Gopalswamy.References
Akimov, V.V. and 33 co-authors 1991, in Proc. 22nd Internat. Cosmic Ray Conference, Internat. Union of Pure and Applied Physics (IUPAP), The Institute for Advanced Studies: Dublin, Vol. 3, p. 73.
Akimov, V.V., Belov, A.V., Chertok, I.M., Kurt, V.G., Leikov, N.G., Magun, A., and Melnikov, V.F. 1994a, Proc. Kofu Symposium, Kofu, Japan, p.371.
Akimov, V.V., Leikov, N.G., Belov, A.V., Chertok, I.M., Kurt, V.G., Magun, A., and Melnikov, V.F. 1994b, in High-energy solar phenomena - A new era of spacecraft measurements (eds. Ryan, J. and Vestrand, W.T.), American Institute of Physics: New York, p.106.
Akimov, V.V., Leikov, N.G., Kurt, V.G., and Chertok, I.M. 1994c, in High-energy solar phenomena - A new era of spacecraft measurements (eds. Ryan, J. and Vestrand, W.T.), American Institute of Physics: New York, p.130.
Akimov, V.V., Ambroz, P., Belov, A.V., Berlicki, A., Chertok, I.M., Karlicky, M., Kurt, V.G., Leikov, N.G., Litvinenko, Y.E., Magun, A., Minko-Wasiluk, A., Rompolt, B., and Somov, B.V. 1996, Solar Phys. 166, 107.
Aschwanden, M.J., Kosugi, T., Hudson, H.S., Wills, M.J., and Schwartz, R.A. 1996, ApJ 470, 1198.
Aschwanden, M.J. and Alexander, D. 2001, SP 204, 91.
Aschwanden, M.J. 2002, Space Science Reviews 101, 1.
Aschwanden, M.J. 2004 (1st Edition; 2005 paperback), Physics of the Solar Corona - An Introduction, Praxis Publishing Ltd., Chichester UK, and Springer, New York.
Aschwanden, M.J. and Aschwanden, P.D. 2008, ApJ 674, 530.
Aulanier, G., DeLuca, E.E., Antiochos, S.K., McMullen, R.A. and Golub, L. 2000, Astrophys. J.540, 1126.
Bieber, J.W., Clem,J., Evenson, P., Pyle, R., Ruffolo, D., Saiz, A., and Wechakama, M. 2008, in Proc. 30th Internat. Cosmic Ray Conf. (eds. Caballero et al.), Universidata Nacional Autonoma de Mexico, Mecico, p.229-232.
Bobra, M.G., VanGallegooijen, A.A., and DeLuca, E.E. 2008, Astrophys. J.672, 1209.
Bombardieri, D.J., Duldig, M.L., Humble, J.E., and Michael, K.J. 2008, ApJ 682, 1315.
Chertok, I.M. 1995, in 24th Internat. Cosmic Ray Conference, (eds. Iucci, N. and Lamanna,E.), Internat. Union of Pure and Applied Physics, Vol. 4, p.78.
Chertok, I.M., Formichev, V.V., Gnezdilov, A.A., Gorgutsa,R.V., Grechnev, V.V., Markeev, A.K., Nightingale, R.W., and Sobolev, D.E. 2001, Solar Phys.204, 141.
Chupp, E.L., and Ryan, J.M. 2009, Research in Astron. Astrophys. 9/1, 11.
Cliver, E.W. 1996, in High energy solar physics, AIP Conf. Proc. 374, 45.
Cliver, E.W., Kahler, S.W., Shea, M.A., and Smart, D.F. 1982, ApJ 260, 362.
Cliver, E.W., Kahler, S.W., Cane,H.V., Koomen, M.J., Michels, D.J., Howard, R.A., and Sheeley, N.R.Jr. 1983, Solar Phys.89, 181.
Cliver, E.W. 2006, ApJ 639, 1206.
Dennis, B.R. and Zarro, D.M. 1993, SP 146, 177.
DeRosa, M.L., Schrijver, C.J., Barnes, G., Leka, K.D., Lites, B.W., Aschwanden, M.J., Amari, T., Canou, A., McTiernan, J.M., Regnier, S., Thalmann, J., Valori, G., Wheatland, M.S., Wiegelmann, T., Cheung, M.C.M., Conlon, P.A., Fuhrmann, M., Inhester, B., and Tadesse, T. 2009, Astrophys. J.696, 1780.
Dingus, B.L., Sreekumar, P., Bertsch, D.L., Schneid, E.J., Brazier, K.T.S., Kanbach, G., von Montigny, C., Mayer-Hasselwander, H.A., Lin, Y.C., Michelson, P.F., Nolan, P.L., Kniffen, D.A., Mattox, J.R. 1994, in High-energy solar phenomena - A new era of spacecraft measurements (eds. Ryan, J. and Vestrand, W.T.), American Institute of Physics: New York, p.177.
Forbes, T.G. and Priest, E.R. 1995, ApJ 446, 377.
Forrest, D.J., Vestrand, W.T., Chupp, E.L., Rieger, E., Cooper, J.F., and Share, G.H. 1985, in 19th Intern. Cosmic Ray Conf., NASA Goddard Space Flight Center: Greenbelt, Maryland, Vol. 4., p.146.
Gopalswamy, N., Xie, Hl, Yashiro, S., and Usoskin, I. 2010, Indian J. Radio and Space Physics 39, 240-248.
Gosling, J.T. 1993, JGR 98, A11, p. 18937.
Grayson, J.A., Krucker, S., and Lin, R.P. 2009, Astrophys. J.707, 1588.
Grechnev, V,V, Kurt, V.G., Chertok, I.M., Uralov, A.M., Nakajima, H., Altyntsev, A.T., Belov, A.V., Yushkov, B.Yu., Kuznetsov, S.N., Kashapova, L.K., Meshalkina, N.S., and Prestage, N.P. 2008, Solar Phys. 252, 149.
Holman, G.D. 1996, in High Energy Solar Physics, (eds. Ramaty, R., Mandzhavidze, N., and Hua, X.-M.), American Institute of Physics: Woodbury, New York, Conf. Proc. 374, p.479.
Hudson, H.S. 1991, BAAS 23, 1064.
Hurford, G.J., Schwartz, R.A., Krucker, S., Lin, R.P., Smith, D.M., and Vilmer, N. 2003, Astrophys. J.595, L77.
Hurford, G.J., Krucker, S., Lin, R.P., Schwartz, R.A., Share, G.H., and Smith, D.M. 2006, Astrophys. J.644, L93.
Kanbach, G., Bertsch, D.L., Fichtel, C.E., Hartman, R.C., Hunter, S.D., Kniffen, D.A., Kwok, P.W., Lin, Y.C., Mattox, J.R., and Mayer-Hasselwander, H.A. 1992, in EGRET Mission and Data Analysis, Technical Report N94-19462 04-89, Max-Planck-Inst. für Physik und Astrophysik: Munich, p.5.
Kanbach, G, Bertsch, D.L., Fichtel, C.E., Hartman, R.C., Hunter, S.D., Kniffen, D.A., Kwok, P.W., Lin, Y.C., Mattox, J.R. and Mayer-Hasselwander, H.A. 1993, AASS 97, 349.
Karpen, J.T., Antiochos, S.K., and DeVore, C.R. 1995, ApJ 450, 422.
Karpen, J.T., Antiochos, S.K., DeVore, C.R.,a nd Golub, L. 1998, ApJ 495, 491.
Kiplinger, A.L. 1995, Astrophys. J.453, 973.
Klassen, A., Krucker, S., Kunow, H., Müller-Mellin, R., Wimmer-Schweingruber, R. 2005, JGR 110, A09S04.
Klein, K. and Trottet, G. 2001, American Geophysical Union, Meeting abstract #SH31C-09.
Kliem, B., Karlicky, M., and Benz, A.O. 2000, A&A 360, 715.
Kocharov, L., Klein, K.-L., Saloniemi, O., Kovaltsov, G., and Torsti, J. 2006, 36th COSPAR Scientific Assembly, Meeting abstract #2897.
Kundu, M.R. 1965, Solar Radio Astronomy, Wiley: New York.
Kurt, V.G., Akimov, V.V., and Leikov, N.G. 1996, in High Energy Solar Physics, (eds. Ramaty, R., Mandzhavidze, N., and Hua, X.-M.), American Institute of Physics: Woodbury, New York, Conf. Proc. 374, p.237.
Kuznetsov, S.N., Kurt, V.G., Yushkov, B.Y., Myagkova, I.N., Kudela, K., Kassovicova, J., and Slivka, M. 2006, Contrib. Astron. Obs. Skalnaté Pleso 36, 85.
Li, J., Tang, Y.H., Dai, Y., Zong, W.G., and Fang, C. 2007, A&A 461, 1115.
Li, J., Dai, Y., Vial, J.C., Owen, C.J., Matthews, S.A., Tang, Y.H., Fang, C., Fazakerley, A.N. 2009, A&A 503, 1013.
Litvinenko, Y.E. 1996, Astrophys. J.462, 997.
Litvinenko, Y.E. 2003, Solar Phys. 216, 189.
Livshits, M.A. and Belov, A.V. 2004, Astronomy Reports 48/8, 665.
Lopate, C. 2006, “Solar Eruptions and Energetic Particles”, (eds., Gopalswamy, N., Mewaldt,R., and Torsti, J.), Geophysical Monograph Series Vol. 165, p.283.
Mandzhavidze, N. and Ramaty, R. 1992, Astrophys. J.389, 739.
Martirosyan, H. and Chilingarian, A. 2005, Proc. 29th Internat. Cosmic Ray Conf. (eds. Acharya, B.S. et al.), Tata Institute of Fundamental Research: Mumbai, Vol.2, p.285.
Masson, S., Klein, K.-L., Bütikover, R., Flückiger, E.O., Kurth, V., Yushkov, B., and Krucker, S. 2009, Solar Phys. 257, 305.
Masuda, S. 2002, in Multi-wavelength observations of coronal structure and dynamics - Yohkoh 10th Anniversary Meeting, (eds. Martens, P.C.H. and Cauffman, D.), COSPAR Coll. Series, Elsevier, p.351.
Masuda, S., and Sato, J. 2003, Adv. Space Res. 32/12, 2455.
Matthiä, D., Heber, B., Reitz, G., Meier, M., Sihver, L., Berger, T., and Herbst K. 2009, J. Geophys. Res. 114/A8, CiteID A08104.
McCracken, K.G. and Moraal, H. 2008, in Proc. 30th Internat. Cosmic Ray Conf. (eds. Caballero et al.), Universidata Nacional Autonoma de Mexico, Mecico, p.269.
McCracken, K.G., Moraal, H., and Stoker, P.H. 2008, JGR 113, A12101.
Miller, J.A., Cargill, P.J., Emslie, A.G., Holman, G.D., Dennis, B.R., LaRosa, T.N., Winglee, R.M., Benka, S.G., and Tsuneta, S. 1997, JGR 102/A7, 14631.
Miroshnichenko, L.I., Klein, K.-L., Trottet, G., Lantos, P., Vashenyk, E.V., Balabin, Y.V., and Gvozdevsky, B.B. 2005, JGR 110/A11, CiteID A11s90.
Moraal, H., McCracken, K.G., and Stoker, P.H. 2008, in Proc. 30th Internat. Cosmic Ray Conf. (eds. Caballero et al.), Universidata Nacional Autonoma de Mexico, Mecico, p.265.
Moraal, H., and McCracken, K.G. 2008, Space Science Rev. (this issue), (in press).
Murphy, R.J., Share, G.H., Schwartz, R.A., Yoshimori, M., Suga, K., Nakayama, S., Takeda, H. 2001, American Geophysical Union, Meeting abstract #SP42A-10.
Neupert, W.M. 1968, ApJ 153, L59.
Pohjolainen, S., Maia, D., Pick, M., Vilmer, N., Khan, J.I., Otruba, W., Warmuth, A., Benz, A., Alissandrakis, C., and Thompson, B.J. 2001, Astrophys. J.556, 421.
Ramaty, R. and Mandzhavidze, N. 1994, in High-energy solar phenomena - A new era of spacecraft measurements (eds. Ryan, J. and Vestrand, W.T.), American Institute of Physics: New York, p.26.
Rank, G., Bennett, K., Bloemen, H., Debrunner, H., Lockwood, J., McConnell, M., Ryan, J., Schönfelder, V., and Suleiman, R. 1996, in High Energy Solar Physics, AIP Conf. Proc. 374, (eds. Ramaty, R., Mandzhavidze, N., and Hua, X.-M.), American Institute of Physics: New York, p.219.
Rank, G., Ryan, J., Debrunner, H., McConnell, M., and Schoenfelder, V. 2001, A&A 378, 1046.
Reames, D.V., Richardson, I.G., and Wenzel, K.P. 1992, Astrophys. J.387, 715.
Reames, D.V. 2002, ApJ 571, L63.
Reames, D.V. 2009a, ApJ 693, 812.
Reames, D.V. 2009b, ApJ 706, 844.
Schrijver, C.J. and DeRosa, M.L. 2003, Solar Phys.212, 165.
Shibata, K. and Tanuma, 2001, Earth, Planets and Space 53, 473.
Shumilov, O.I., Kasatkina, E.A., Turyansky, V.A., Kyro, E., Kivi, R. 2003, Adv. Space Res. 31/9, 2157.
Simnett, G.M. 2006, A&A 445, 715.
Simnett, G.M. 2007, (Erratum) A&A 472, 309.
Simnett, G.M. and Roelof, E.C. 2005a, 29th Internat Cosmic Ray Conf. 1, 233.
Simnett, G.M. and Roelof, E.C. 2005b, AGU Meeting abstract #SH23A-0319.
Sturrock, P.A. 1966, Nature 5050, 695.
Torsti, J., Riihonen, E., and Kocharov, E. 2004, ApJ 600, L83.
Trottet, G. 1994, in High-energy solar phenomena - A new era of spacecraft measurements (eds. Ryan, J. and Vestrand, W.T.), American Institute of Physics: New York, p.3.
Vashenyuk, E.V., Balabin, Y.V., and Gvozdevsky, B.G. 2003, 28th Internat. Cosmic Ray Conf., p.3401.
Vashenyuk, E.V., Balabin, Y.V., and Gvozdevsky, B.G. 2011, Astrophys. Space Sci. Transactions, in Proc. 22th Internat. Cosmic Ray Conf., Turku, Finland, (subm).
Vilmer, N., Kane, S.R., and Trottet, G. 1982, A&A 108, 306.
Wang, H., Gary, D.E., Zirin, H., Schwartz, R.A., Sakao, T., Kosugi, T., and Shibata, K., 1995, ApJ 453, 505.
Wang, R.G. and Wang, J.X. 2006, 36th COSPAR Scientific Assembly, Meeting abstract #1856.
Wang, R.G. 2009, Astroparticle Physics 31/2. 149.
Watanabe, K., Murphy, R.J., Share, G.H. et al. 2008, in Proc. 30th Internat. Cosmic Ray Conf. (eds. Caballero et al.), Universidata Nacional Autonoma de Mexico, Mecico, p.41.
Yan, Y. and Huang, G. 2003, Space Science Rev. 107, 111.
Zank, G.P., Rice, W.K.M., and Wu, C.C. 2000, JGR 105/A11, 25079.