VERITAS 2008 - 2009 monitoring of the variable gamma-ray source M 87
Abstract
M 87 is a nearby radio galaxy that is detected at energies ranging from radio to very-high-energy (VHE) gamma-rays. Its proximity and its jet, misaligned from our line-of-sight, enable detailed morphological studies and extensive modeling at radio, optical, and X-ray energies. Flaring activity was observed at all energies, and multi-wavelength correlations would help clarify the origin of the VHE emission. In this paper, we describe a detailed temporal and spectral analysis of the VERITAS VHE gamma-ray observations of M87 in 2008 and 2009. In the 2008 observing season, VERITAS detected an excess with a statistical significance of 7.2 standard deviations () from M 87 during a joint multi-wavelength monitoring campaign conducted by three major VHE experiments along with the Chandra X-ray Observatory. In February 2008, VERITAS observed a VHE flare from M 87 occurring over a 4-day timespan. The peak nightly flux above 250 GeV was , which corresponded to 7.7% of the Crab Nebula flux. M 87 was marginally detected before this 4-day flare period, and was not detected afterwards. Spectral analysis of the VERITAS observations showed no significant change in the photon index between the flare and pre-flare states. Shortly after the VHE flare seen by VERITAS, the Chandra X-ray Observatory detected the flux from the core of M 87 at a historical maximum, while the flux from the nearby knot HST-1 remained quiescent. Acciari et al. (2009) presented the 2008 contemporaneous VHE gamma-ray, Chandra X-ray, and VLBA radio observations which suggest the core as the most likely source of VHE emission, in contrast to the 2005 VHE flare that was simultaneous with an X-ray flare in the HST-1 knot. In 2009, VERITAS continued its monitoring of M 87 and marginally detected a 4.2 excess corresponding to a flux of % of the Crab Nebula. No VHE flaring activity was observed in 2009.
1 Introduction
M 87 is an FR I radio galaxy located at a distance of 16.7 Mpc, near the center of the Virgo cluster. It has been observed at all wavelengths ranging from radio to VHE gamma rays. Its core is an active galactic nucleus (AGN) powered by a supermassive black hole of mass (Gebhardt & Thomas, 2009) (see supporting material of Acciari et al. (2009) for mass corrected for our distance assumption), which is the source from which the first plasma jet emission was observed (Curtis, 1918). Most of the known extragalactic VHE sources are blazars (TeVCat, 2007), AGN with a jet aligned close to the line-of-sight; on the contrary, the jet of M 87 is misaligned. Apparent superluminal motion was observed in both the radio (Cheung et al., 2007) and optical (Biretta et al., 1999) bands for different features along the jet, constraining the jet orientation to less than from the line-of-sight at the location of the HST-1 knot, which is located 0.86” from the core (Harris et al., 2009).
VHE emission from M 87 was first reported by the HEGRA collaboration at a statistical significance of during their observations (Aharonian et al., 2003). This was confirmed by the H.E.S.S. collaboration (Aharonian et al., 2006), which additionally reported year-scale flux variability. The observed variability provides a size constraint on the VHE emission production region and disfavors large-scale gamma-ray production models, such as the dark matter annihilation model (Baltz et al., 2000) and the interacting cosmic-ray proton scenario (Pfrommer & Ensslin, 2003) which predict steady gamma-ray emission. However, the angular resolution of imaging atmospheric Cherenkov telescopes (IACTs) is insufficient to resolve any structure in M 87. Aharonian et al. (2006) also reported fast (2-day scale) variability during a high state of gamma-ray activity in 2005, which further constrains the VHE emission size and favors the immediate vicinity of the M 87 black hole as the VHE production site; on the other hand, Chandra X-ray observations at the time of the VHE flare indicated a different scenario. Strong flux variability from both the core and HST-1 in the energy range keV has been detected by Chandra M 87 monitoring since 2002 (Harris et al., 2003). At the same period of the flare observed by H.E.S.S. in 2005, Harris et al. (2008) reported an X-ray flux from HST-1 at more than 50 times the intensity observed in 2000, along with flaring activity observed in ultraviolet and radio wavelengths, suggesting the HST-1 knot as a more likely source of VHE emission than the core.
The All-Sky Monitor (ASM) on the Rossi X-ray Timing Explorer (RXTE) has provided daily monitoring of M 87 in the energy range keV since 1996. However, ASM cannot resolve the core and the HST-1 knot. A year-scale correlation between the annual ASM/RXTE X-ray flux and the VHE gamma-ray flux recorded over the past 10 years was reported by Acciari et al. (2008). The core was presented as the more favorable VHE production site over HST-1 based on this year-scale correlation, and the non-detection of the 2005 flare in the HST-1 knot by ASM. However, no year-scale correlation has been seen with Chandra data of the M 87 core or the HST-1 knot over the past 5 years in the keV range. The ASM/RXTE quick-look results do not show any correlated activity with VHE observations at shorter time scales, as a result of the limited sensitivity of ASM.
The proximity of M 87 and its misaligned jet enable high resolution studies of its jet structures in radio, optical, and X-rays (Marshall et al., 2002) (Perlman & Wilson, 2005). The jet morphology is similar in those wavebands, and leptonic synchrotron radiation is favored as the process for non-thermal emission within the jet (Wilson & Yang, 2002). Based on the multiwavelength correlated activities and variability studies, the favored candidate for VHE emission is the small-scale (sub-arcsecond) jet region. Reimer et al. (2004) propose a synchrotron-proton blazar model in which protons are accelerated to energies above EeV and emit gamma rays via muon/pion synchrotron or proton synchrotron radiation. However, this model requires a strong magnetic field to accelerate the protons to such high energies, and the predicted VHE spectrum is steeper than observed. Several leptonic models involving synchrotron and inverse Compton (IC) radiation have also been suggested, with the multi-component emission originating in the inner jet: there is the model by Georganopoulos et al. (2005) in which energetic electrons IC scatter off of synchrotron photons produced downstream in the decelerating jet; a scenario by Lenain et al. (2008) in which VHE emission is produced via the synchrotron self-Compton (SSC) process inside several similar homogenous compact components which contain more energetic electrons than the jet; and the model by Tavecchio & Ghisellini (2008), in which a fast-moving spine is surrounded by a slower-moving sheath, producing VHE emission via external-Compton scattering. Single-component SSC emission is recently modelled by Abdo et al. (2009) with VLBA radio, Chandra X-ray, and Fermi LAT 2009 data. However, comparing the model to archival non-flaring VHE data, it appears to underpredict the VHE emission.
The vicinity of the black hole (the core) has been suggested by Levinson (2000) and Neronov & Aharonian (2007) in the black hole magnetosphere model, in which gamma-ray photons are produced by electrons accelerated by the electromagnetic field of the black hole. The HST-1 knot, 0.86” away from the core, has also been demonstrated as a possible location for jet reconfinement where photons can be upscattered to TeV energies via IC process (Stawarz et al., 2006).
In 2008, the VHE gamma-ray experiments H.E.S.S., MAGIC, and VERITAS took part in a joint multi-wavelength monitoring campaign of M 87 along with Chandra (Beilicke et al., 2008). The VHE observations were closely coordinated in order to guarantee a reasonable coverage around the Chandra pointings and a well sampled VHE light curve during the first half of 2008. During this joint monitoring campaign, MAGIC reported flaring activities during a 13-day observation period between January 30 (MJD 54495) and February 11 (MJD 54507), with day-scale variability occurring throughout the duration of the flare (Albert et al., 2008). Subsequently, the VERITAS collaboration triggered intensified observations of M 87, and detected a 4-day flare from February 9 (MJD 54505) to February 13 (MJD 54509). The VHE and Chandra X-ray light curves of the joint campaign, along with a coincident VLBA radio light curve, are presented in Acciari et al. (2009), which also include a discussion on the radio/VHE gamma-ray correlation as evidence that the VHE emission originates from the core.
The VHE flux monitoring campaign continued in 2009 with MAGIC and VERITAS. In this paper, we present the results from two seasons () of VERITAS observations, along with a full analysis on the time scale of the flux variability, and a search for spectral variability in the 2008 data set when the VHE flaring activity was observed.
2 Observations and Analysis
VERITAS, the Very Energetic Radiation Imaging Telescope Array System, is an array of four 12 m diameter IACTs located at the Fred Lawrence Whipple Observatory on Mount Hopkins ( N, W) at an altitude of 1.3 km above sea level. Each telescope has a total area of 110 m2 and an f/D ratio of 1.0. Each telescope camera is equipped with 499 photomultiplier tubes, arranged in a hexagonal lattice covering a field of view (FOV) of . The array is sensitive from 100 GeV to more than 30 TeV, with an effective area of up to m2 and an angular resolution of at 1 TeV (68% containment). VERITAS can detect a source with 1% Crab Nebula flux in less than 50 hours, and a source with 5% Crab Nebula flux in 2.5 hours. For more technical details of VERITAS, see Holder et al. (2006).
M 87 was observed with VERITAS for over 43 hours between December 2007 and May 2008 and over 25 hours between January and May 2009, at a range of zenith angles from to . All of 2008 data and 81% of 2009 data used were taken with 4 telescopes, while 19% of 2009 data were taken with only a 3-telescope array. After eliminating observations in poor weather and those with an unstable trigger rate, 37 hours and 19 hours of good quality live time remain in 2008 and 2009, respectively.
Shower images from all working telescopes are first corrected in gain and timing using parameters obtained from the nightly laser calibration data (Hanna et al., 2007). The images are then passed through a two-step cleaning process that retains pixels with a signal that is several times higher than the night-sky background level. Each shower image is then parametrized (Hillas, 1985), and the shower direction is reconstructed using the stereoscopic technique (Hofmann et al., 1999). Events are then selected as gamma-ray-like if at least three camera images pass the standard cuts optimized for a Crab Nebula flux source (Colin et al., 2008). All the observations were performed in “wobble mode” where M 87 was tracked with a offset relative to the camera such that the camera’s FOV contain both the source region and regions for background estimation. The on-source region is defined by a radius circle centered on the M 87 core. All gamma-ray-like events within this region are summed (ON count) and the background estimated from seven identically sized regions reflected from the source region around the camera center is also summed (OFF count) (Berge et al., 2007). The ON and OFF counts are then used in Formula 17 of Li & Ma (1983) to calculate the significance of the excess. As a standard procedure in VERITAS, the results were confirmed by at least one independent analysis package (Daniel et al., 2007) which was presented in Acciari et al. (2009).
3 Results
3.1 2008
The VERITAS observations in 2008 resulted in 450 excess events, corresponding to a statistical significance of . The average flux above 250 GeV is , corresponding to of the Crab Nebula flux. The differential energy spectrum of M 87 measured by VERITAS in 2008 is consistent with a power-law distribution , with and . The for the power-law fit is 3.1/4.0. The measured photon index is consistent with reported measurements from Aharonian et al. (2006), Acciari et al. (2008), and Albert et al. (2008) ranging from to with statistical uncertainties between and . Table 1 lists the differential flux points measured by VERITAS in 2008.
| Energy | Differential Flux | Significance |
|---|---|---|
| [TeV] | [] | [] |
| 0.24 | 3.68 | |
| 0.42 | 3.07 | |
| 0.75 | 4.44 | |
| 1.33 | 1.79 | |
| 2.37 | 1.78 | |
| 4.22 | 1.52 |
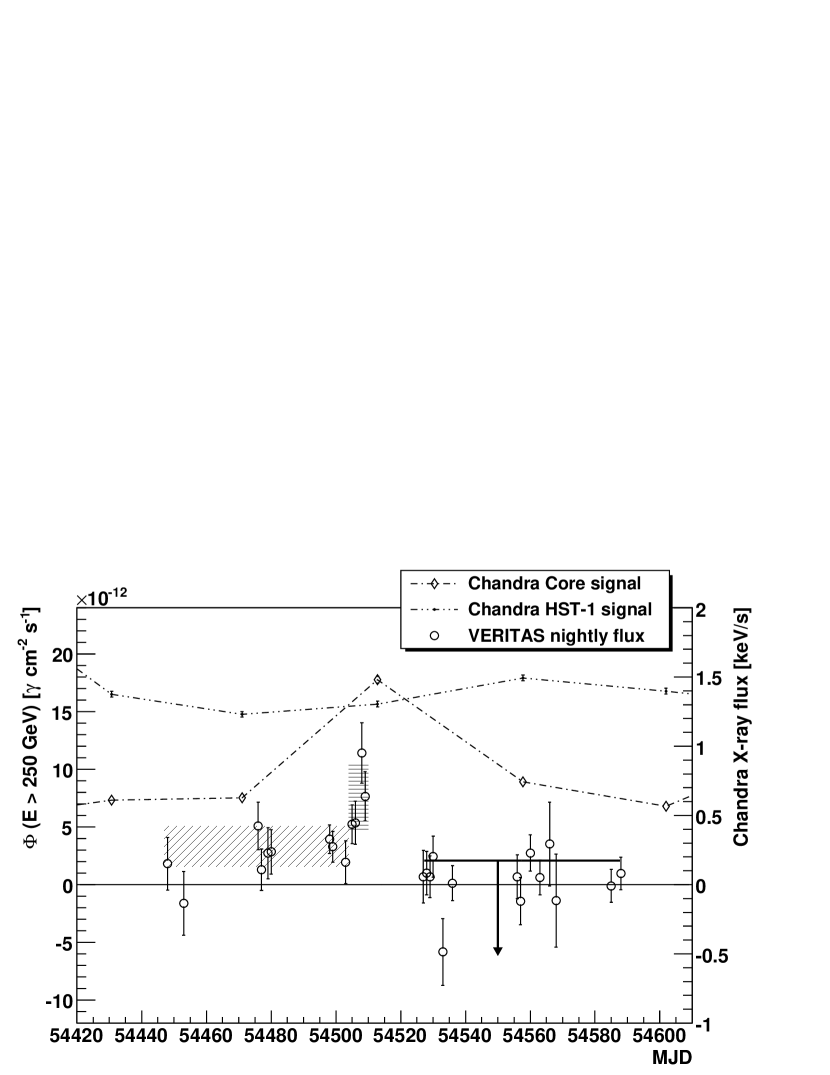
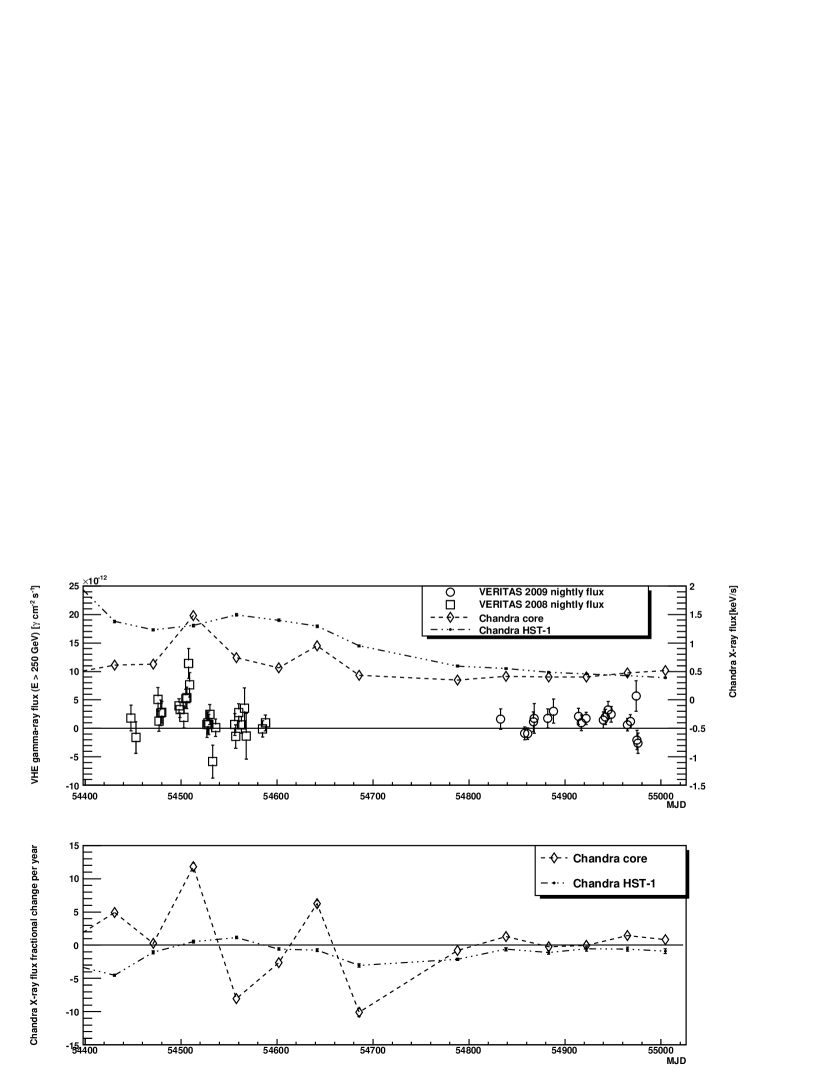
The 2008 VERITAS light curve is shown in Fig. 1 assuming the average fitted photon index of . The of a constant rate fit to the entire dataset is 52/26, rejecting the constant flux hypothesis at 99.9% confidence level. On Feb 9 (MJD ), M 87 was detected at over after 2 hours of observation and a trigger alert was sent out to other collaborations for intensified observations. The peak flux of the VERITAS dataset occured on the night of Feb 12 (MJD ) at above 250 GeV, equivalent to of the Crab Nebula flux. The flare period is defined by the nights removed from the whole dataset such that the constant rate fit to the rest of the lightcurve reaches a close to 1. The nights that meet the criteria for the flare period are Feb 9, 10, 12, and 13 (MJD ). The dataset is then further split into pre-flare and post-flare period.
During the flare period, M 87 was observed for 5.4 hours of live time and was detected at (pre-trials). The flux above 250 GeV during the flare period was , corresponding to of the Crab Nebula flux. The 99% confidence interval for the flux during the flare period (see horizontal-lined area between MJD 54505 and 54509 in Fig. 1) is between and .
Before the flare period (MJD ), which included two nights immediately after the major flare observed by MAGIC (Albert et al., 2008), M 87 was marginally detected with 13.8 hours of live time at a flux of above 250 GeV. The 99% confidence interval for the flux during the pre-flare period (see slant-lined area between MJD 54448 and 54503 in Fig. 1) is between and . M 87 was observed for an additional 17.2 hours of live time after the flare period and was not detected. An upper limit of at 99% confidence level (Helene, 1983) is established for the post-flare period, corresponding to of the Crab Nebula flux. Assuming a normal distribution for the flux measurement, the flare flux is higher than the pre-flare flux at 99.95% confidence level, and the pre-flare flux is higher than the post-flare flux at 99.8% confidence level. All of the above calculations were performed under the assumption of a constant photon index of .
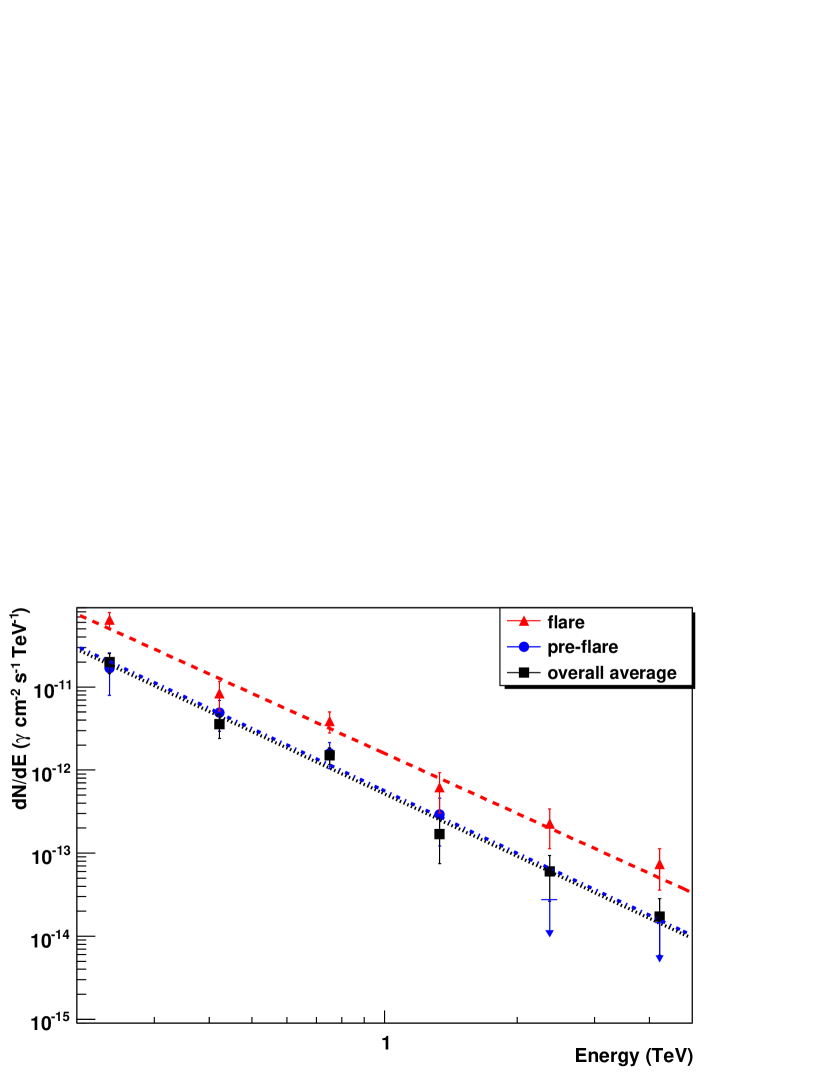
The spectra from different periods are plotted in Fig. 2 and there is no indication of a spectral cut-off. The power-law fit parameters from the overall, flare, and pre-flare spectra are displayed in Table 2. No significant difference in photon index and photon energy distribution is found between the flare and pre-flare states.
| Data Set | |||
|---|---|---|---|
| [] | |||
| 2008 overall | 5.2 0.9 | 2.5 0.2 | 3.1/4 |
| flare state | 15.9 2.9 | 2.4 0.2 | 3.9/4 |
| pre-flare state | 5.6 1.5 | 2.5 0.3 | 1.3/4 |
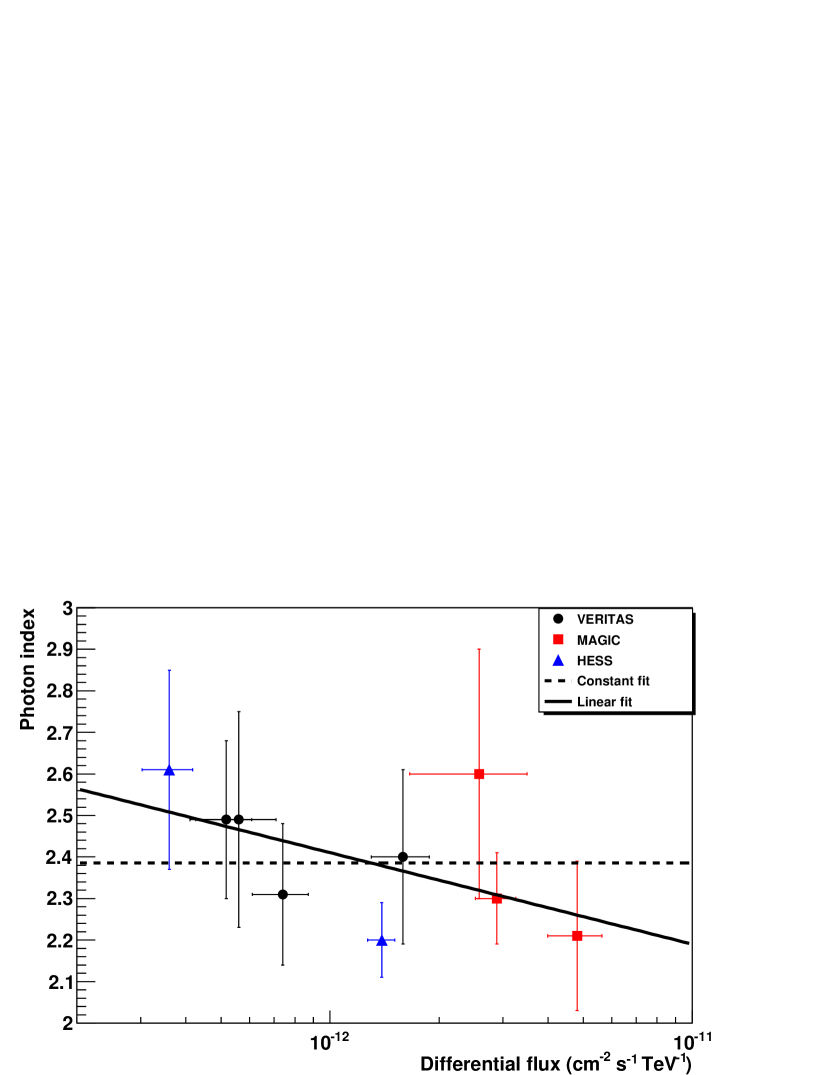
To test if there is any correlation between the spectral flux and photon index measured during different activity levels corresponding to the core, a linear test function of the form was fitted to past measurements by Aharonian et al. (2006) in 2004 and Acciari et al. (2008) in 2007, and the high/low states measured by Albert et al. (2008) and by VERITAS in 2008 (see Fig. 3). The measurement by HESS in 2005 is excluded in the fit due to possible contamination from the HST-1 flare. The of the linear fit is 1.7/4 and the corresponding probability of a correlation between photon index and flux is . The fit parameter is consistent with zero. Fitting a constant photon index gave a of 2.7/5 and a corresponding probability of . No significant correlation is found between the photon index and the flux.
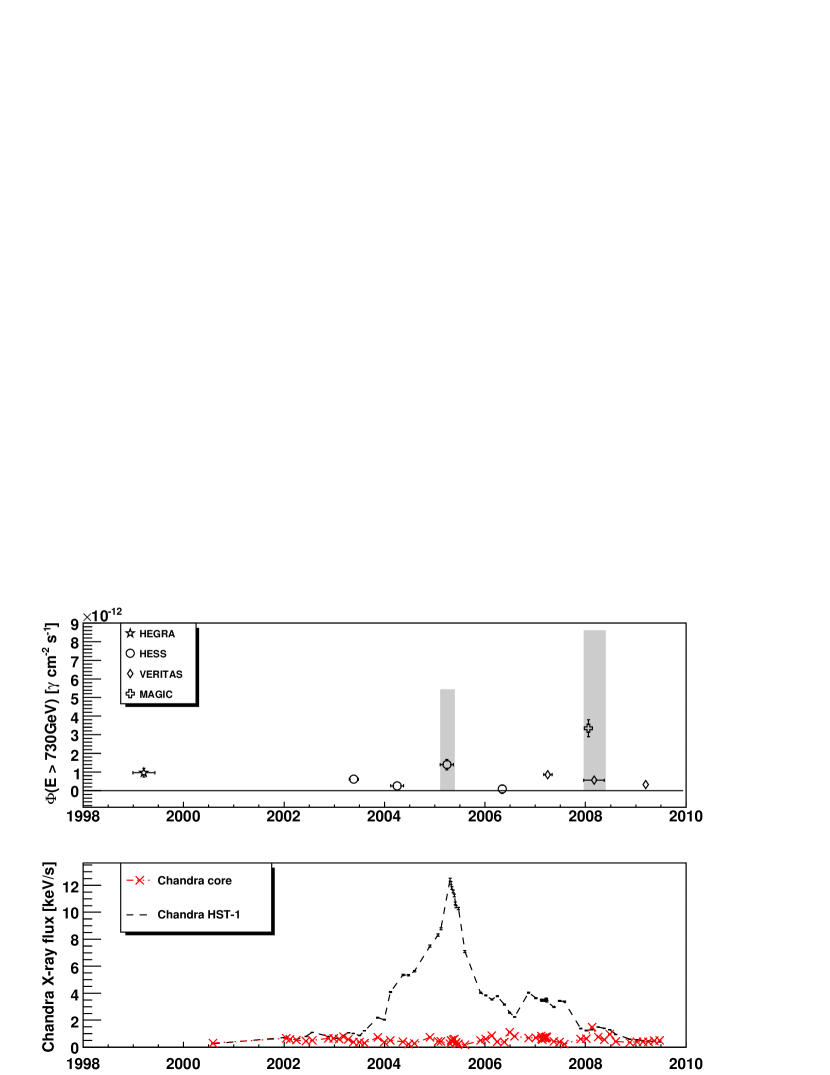
At the time of the flare detected by VERITAS, Chandra measured the core X-ray flux at a historical maximum, at above the mean core flux between 2000 and 2009, and exceeding the flux from the HST-1 knot (see Fig. 1 and 4) (Harris et al., 2009). The peak core X-ray flux measured by Chandra during the observation period of VERITAS was 2.3 times the average core X-ray flux, with the average calculated excluding this flare data point. While the HST-1 knot X-ray flux during this period fluctuated from the average and is relatively steady when compared to the core emission. Fig. 5 shows the fractional change per year (fpy) first presented in Harris et al. (2009). Around the 2008 VHE gamma-ray flare period, the Chandra core fpy is more variable than that of the Chandra HST-1 fpy measurement. The definition of fpy is repeated below (Harris et al., 2009).
| (1) |
| (2) |
where is the X-ray intensity measured by Chandra and is the time between the two intensity measurements in units of year. If the X-ray intensity is increasing (i.e. ), then ; if the X-ray intensity is decreasing (), then .
3.2 2009
The VERITAS observations in 2009 resulted in 134 excess events at a significance of . The of a constant rate fit to the entire dataset is 23/18 and no significant variability was observed in the 2009 data set. The average flux above 250 GeV is assuming a photon index of . This corresponds to of the Crab Nebula flux and is consistent with the reported Fermi-LAT spectrum (Abdo et al., 2009). The 2009 flux is below the 2008 pre-flare flux at the 98.5% confidence level, but above the 2008 post-flare flux at the 87.6% confidence level. Fig. 5 shows the light curves of both 2008 and 2009 observed by VERITAS and the X-ray flux measured by Chandra for the core and the knot HST-1, along with the fpy of Chandra X-ray flux.
During the 2009 observation period, Chandra took a flux measurement every days. The HST-1 flux measured by Chandra is steadily declining at a rate of when compared to the previous flux (). The core flux, however, is mostly increasing by as much as . The lack of VHE activity during this period suggests a possible association between VHE flares and significant changes in the X-ray flux such as the one seen in 2008 where the core fpy is more variable than in 2009 (see Fig. 5).
4 Discussion
The proximity of M 87 and its misaligned jet have enabled the study of its jet morphology in a broad range of energies. Flaring activities from individual jet features have been observed in radio, optical, and X-rays in parallel (Cheung et al., 2007). Modeling of the particle acceleration yields several possible VHE emission origins. Even though the VHE gamma-ray technique cannot resolve individual features of M 87, the rapid variability reported by Aharonian et al. (2006) and Albert et al. (2008) has constrained the size of the VHE emission region to where is the relativistic Doppler factor and Rs the Schwarzschild radius of the M 87 black hole (Rcm). During the 2008 joint monitoring campaign of M87, VERITAS observed a gamma-ray flare in February 2008 which spanned 4 days, constraining the emission region size to R cm. Radio observations have shown evidence that charged particles are accelerated in the immediate vicinity of the black hole closer than (Acciari et al., 2009). Combining these radio observations with the size constraint from the VERITAS 2008 data, we can constrain the relativistic Doppler factor with the flaring activity measured by VERITAS.
The VHE emission size constraint narrows down the most probable VHE emission location to either the unresolved core region or the HST-1 knot. X-ray time scale analysis presented by Harris et al. (2009) suggests the X-ray emission size of the core to be smaller than that of HST-1. However the upper limits on the X-ray emission region size from the time scale analysis are still larger than the VHE emission size inferred from the VHE variability time scales reported previously. Therefore, both HST-1 and the core region remain as the possible origins of VHE emission.
In 2009 VERITAS detected M87 similar to the 2008 pre-flare level. The X-ray time scale analysis is repeated for the 2009 Chandra data and the fractional change per year (fpy) for the core in 2009 is smaller than in 2008 during the VHE gamma-ray flare. The fpy of the knot HST-1 appeared to be negative throughout 2008 and 2009, and at a smaller amplitude than the core. This may be an indication of correlation between large X-ray flux changes and flaring activities in VHE gamma rays. It should be noted however, that large fpy in the core was observed by Chandra as well in 2007 with no corresponding VHE gamma-ray flare. A similar analysis is not performed for the 2005 HESS flare due to contamination from the knot HST-1 in Chandra data.
The compactness of the particle accelerators operating in the vicinity of the supermassive black hole and the absence of a significant cut-off in the spectrum imply that the particle acceleration mechanism is highly efficient. Levinson (2000), Neronov & Aharonian (2007), and others have argued that acceleration mechanisms similar to those in pulsar magnetosphere models can also operate in the black hole magnetosphere. The black hole magnetosphere model and the two-zone leptonic models (Georganopoulos et al., 2005) (Lenain et al., 2008) (Tavecchio & Ghisellini, 2008) can reproduce the VHE spectrum and the flux variability well. While no constraints can be placed on the VHE range of these models, since VERITAS and other VHE gamma-ray instruments did not observe a cut-off in the spectrum of M 87, the Fermi gamma-ray telescope, sensitive from MeV to GeV energies, can potentially provide constraints on the magnetic field strength and a measure of low-energy gamma-ray photon flux from the synchrotron/curvature radiation. Abdo et al. (2009) presented the first year of Fermi-LAT observations of M87 in 2009 during its quiescent state. Continual monitoring in all wavelength is essential for the modelling of the spectral energy distribution of M87. Future instruments such as CTA/AGIS, with their improved sensitivity, can potentially detect shorter time scale variability and further constrain the size of the VHE emission region.
Begelman (2009) provided a concise commentary on the M 87 2008 multi-wavelength results and the importance of multi-wavelength observations to understanding particle acceleration mechanisms near black holes. The high-resolution imaging of radio telescopes, combined with VHE gamma-ray observations from ground-based instruments, have shown the first association between a VHE gamma-ray flare and an increase in radio flux coming from a region very close to the black hole (Acciari et al., 2009). This coincident multi-wavelength coverage led to several modeling discussions of the joint VHE and radio light curves (see supplement of Acciari et al. (2009)). Even with M 87 day-scale VHE flux variability and additional constraints from radio and X-ray observations, there remains several plausible models, which explain how particles are accelerated to very high energies near the black hole and how the consequent radiation is able to reach us. Multi-wavelength monitoring work is being continued, and is essential to address these questions.
References
- Abdo et al. (2009) Abdo, A. A., et al. 2009, ApJ, 707, 55
- Acciari et al. (2009) Acciari, V. A., et al. 2009, Science, 325, 444
- Acciari et al. (2008) Acciari, V. A., et al. 2008, ApJ, 679, 397
- Aharonian et al. (2003) Aharonian, F., et al. 2003, A&A, 403, L1
- Aharonian et al. (2006) Aharonian, F., et al. 2006, Science, 314, 1424
- Albert et al. (2008) Albert, J., et al. 2008, ApJ, 685, L23
- Baltz et al. (2000) Baltz, E. A., Briot, C., Salati, P., Taillet, R., & Silk, J. 2000, Phys. Rev. D, 61, 023514
- Begelman (2009) Begelman, M. 2009, Science, 325, 399
- Beilicke et al. (2008) Beilicke, M., et al. 2008, in AIP Conf. Proc. 1085, 4th International Meeting on High Energy Gamma-ray Astronomy, 553
- Berge et al. (2007) Berge, D., Funk, S., & Hinton, J. 2007, A&A, 466, 1219
- Biretta et al. (1999) Biretta, J. A., Sparks, W. B., & Macchetto, F. 1999, ApJ, 520, 621
- Cheung et al. (2007) Cheung, C. C., Harris, D. E., Stawarz, L. 2007, ApJ, 663, L65
- Colin et al. (2008) Colin, P., et al. 2008, in 30th ICRC Proc., 3, 997
- Curtis (1918) Curtis, H. D. 1918, Publ. Lick Obs., 13, 9
- Daniel et al. (2007) Daniel, M. K., et al. 2007, in 30th ICRC Proc., 3, 1325
- Georganopoulos et al. (2005) Georganopoulos, M., Perlman, E. S., & Kazanas, D. 2005, ApJ, 634, L33
- Gebhardt & Thomas (2009) Gebhardt, K., & Thomas, J. 2009, ApJ, 700, 1690
- Hanna et al. (2007) Hanna, D., et al. 2007, in 30th ICRC Proc., 3, 1417
- Harris et al. (2009) Harris, D. E., Cheung, C. C., Stawartz, L., Biretta, J. A., & Perlman, E. S. 2009, ApJ, 699, 305
- Harris et al. (2008) Harris, D. E., Cheung, C. C., Stawarz, L., Biretta, J. A., Sparks, W., Perlman, E. S., & Wilson, A. S. 2008, in ASP Conf. Ser. 386, Extragalactic Jets, 80
- Harris et al. (2003) Harris, D. E., Biretta, J. A., Junor, W., Perlman, E. S., Sparks, W. B., & Wilson, A. S. 2003, ApJ, 586, L41
- Helene (1983) Helene, O. 1983, Nuclear Instruments & Methods, 212, 319
- Hillas (1985) Hillas, A. M. 1985, in 19th ICRC Proc., 3, 445
- Hofmann et al. (1999) Hofmann, W., et al. 1999, Astropart. Phys., 12, 135
- Holder et al. (2006) Holder, J., et al. 2006, Astropart. Phys., 25, 391
- Lenain et al. (2008) Lenain, J.-P., Boisson, C., Sol, H., & Katarzynski, K. 2008, A&A, 478, 111
- Levinson (2000) Levinson, A. 2000, Phys. Rev. Lett., 85, 5
- Li & Ma (1983) Li, T. P., & Ma, Y. Q. 1983, ApJ, 272, 317
- Marshall et al. (2002) Marshall, H. L., et al. 2002, ApJ, 564, 683
- Neronov & Aharonian (2007) Neronov, A., & Aharonian, F. A. 2007, ApJ, 671, 85
- Perlman & Wilson (2005) Perlman, E. S., & Wilson, A. S. 2005, ApJ, 627, 140
- Pfrommer & Ensslin (2003) Pfrommer, C., & Ensslin, T. A. 2003, A&A, 407, L73
- Reimer et al. (2004) Reimer, A., Protheroe, R. J., & Donea, A.-C., 2004, A&A, 419, 89
- Stawarz et al. (2006) Stawarz, L., Aharonian, F., Kataoka, J., Ostrowski, M., Siemiginowska, A., & Sikora, M. 2006, MNRAS, 370, 981
- Tavecchio & Ghisellini (2008) Tavecchio, F., & Ghisellini, G. 2008, MNRAS, 385, L98
- TeVCat (2007) TeVCat, Online Gamma-Ray Catalog, http://tevcat.uchicago.edu
- Wilson & Yang (2002) Wilson A. S., & Yang Y. 2002, ApJ, 568, 133