Control of gradient-driven instabilities using shear Alfvén beat waves
Abstract
A new technique for manipulation and control of gradient-driven instabilities through nonlinear interaction with Alfvén waves in a laboratory plasma is presented. A narrow, field-aligned density depletion is created in the Large Plasma Device (LAPD), resulting in coherent, unstable fluctuations on the periphery of the depletion. Two independent shear Alfvén waves are launched along the depletion at separate frequencies, creating a nonlinear beat-wave response at or near the frequency of the original instability. When the beat-wave has sufficient amplitude, the original unstable mode is suppressed, leaving only the beat-wave response, generally at lower amplitude.
pacs:
52.35.Bj, 52.35.Mw, 52.35.QzIn magnetized plasmas in the laboratory, the loss of heat, particles, and momentum across the confining magnetic field is predominantly caused by turbulent transport associated with pressure-gradient-driven instabilities Horton:1999p40 ; Tynan:2009p1232 . Controlling these instabilities to mitigate the transport they produce is therefore highly desirable for magnetic confinement fusion devices such as tokamaks. Direct control of gradient-driven instabilities has been achieved using arrays of electrodes or external saddle coils to induce fluctuating parallel currents in a cylindrical plasma device Schroder:2001p17 ; Schroder:2004p666 . In these experiments, when the excited electric fields matched the frequency and wavenumber of a drift-wave mode in the device the observed turbulent spectrum collapsed onto the single coherent driven mode (synchronization) and turbulent transport is reduced Brandt:2009p1425 . Extending the transport control enabled through mode-synchronization to high-temperature fusion devices is highly desirable but it would not be possible using material electrodes. It is also not clear whether saddle coils would be effective at driving currents for synchronization in a high-performance device.
Turbulence control with core plasma access might be achieved using externally-launched radiofrequency (RF) waves. High-power RF is expected to be an important tool for heating and current drive on next-step fusion experiments such as ITER Shimada:2007p1419 and could be available for application to turbulence and transport control. Creation of flow shear for turbulence suppression Terry:2000p1409 using RF waves has been theorized Myra:2002p1414 and recently demonstrated in the Alcator C-Mod tokamak InceCushman:2009p1418 ; Lin:2009p1408 . Direct modification of gradient-driven instabilities is also possible through interaction with an RF field. Control of drift-wave fluctuations was demonstrated in Q-machine experiments using lower hybrid waves to affect plasma properties and the drift-wave dispersion to suppress growth Wolf:1980p462 ; Wong:1978p515 ; Gore:1978p532 ; Liu:1980p361 . The modification of other transport related instabilities, such as the ion temperature gradient (ITG) instability, in the presence of RF driven fast magnetosonic waves has also been suggested and investigated theoretically Chiu:1989p340 .
This Letter reports on novel laboratory experiments using RF waves, in particular shear Alfvén waves (SAWs), to modify gradient-driven instabilities. Two co-propagating SAWs with slightly differing frequency are launched along a narrow field-aligned density depletion on which coherent (dominant single-frequency) unstable fluctuations are observed. Modification and control of the instability is seen when the nonlinear beat response exceeds an amplitude threshold and the frequency of the beat wave is near the frequency of the gradient-driven instability. In this case, the original unstable mode is reduced in amplitude or suppressed completely, leaving only the beat-driven response, generally at lower amplitude. A reduction in broadband fluctuations is also observed accompanying the suppression of the primary mode. This control is observed for a finite range of beat wave frequencies around the unstable mode frequency; this range widens with increased beat wave amplitude.
This research was carried out on the upgraded Large Plasma Device (LAPD) at the Basic Plasma Science Facility (BAPSF) at UCLA Gekelman:2010 . The LAPD creates a 17.5m long, 0.6m diameter cylindrical magnetized plasma. The plasma is created at 1 Hz using an indirectly-heated barium oxide coated cathode discharge (discharge length is typically 10-20ms). Bulk parameters for the helium plasmas used in these experiments are: cm-3, eV, and G. Ion temperature in LAPD is typically eV Palmer:2005p1420 , although it was not measured directly in these experiments. Under these conditions, the electron thermal speed is greater than the Alfvén wave speed (the Kinetic Alfvén Wave regime Morales:1997p11 ).
In these experiments, temperature, density and floating potential are determined using a triple Langmuir probe. The temperature and density measurements have been quantitatively verified using microwave interferometry and swept Langmuir probe measurements. Magnetic field fluctuations were measured using magnetic pickup coils, differentially wound to eliminate electrostatic pickup. The probes are mounted on motorized, computer controlled probe drives. Two-dimensional average profiles are acquired over many repeatable discharges by moving a single probe shot-to-shot. Two-dimensional cross-correlation functions are achieved using a second, stationary reference probe separated axially (along the background field) from the moving probe.
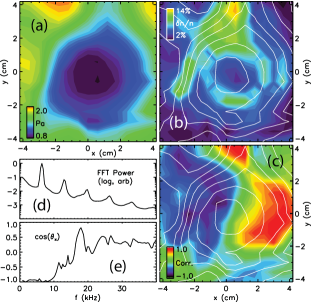
Conditions are established for the instability formation through creation of a field-aligned axial density depletion embedded in the center of the LAPD plasma column. This type of condition has been extensively investigated in the LAPD, and the presence of gradient-driven drift-Alfvén-wave instabilities in such conditions is well documented Maggs:1997p2 ; Penano:2000p22 . The depletion is formed by inserting a small metal blocking disk between the anode and cathode, selectively blocking the high energy primary electrons that ionize the neutral gas and leaving a lower temperature and density striation along the central axis of the machine. As shown in Figure 1(a) the pressure drops by about 50% in the depletion, which is 6 cm wide. The measurements shown are of ion saturation current () and pressure , with calculated from and . Figure 1(b) shows measured fluctuations, which are localized to the density gradient associated with the depletion. Figure 1(d) shows the spatially-averaged fast Fourier transform (FFT) power spectrum of , indicating a narrow-band spectrum with power at kHz and harmonics. Cross-correlation measurements shown in Figure 1(c) of the spontaneous fluctuations indicate a azimuthal mode number for the dominant mode, with propagation in the electron diamagnetic direction. Many of the measured properties of the unstable modes (frequency, direction and speed of propagation) agree with predictions for drift waves. However, Figure 1(e) shows that the measured phase between density fluctuations and potential fluctuations () is approximately , which is inconsistent with the predictions and observations of saturated, single mode drift waves Hendel:1968p1481 .
It is important to note that in these experimental conditions there are two sources of free energy, the pressure gradient and an imposed potential gradient from the blocking disk, resulting in two separate flows from the drift and the drift. Thus there are two possible instabilities, the drift-wave instability, resulting in drift-waves with axial mode number , and the Kelvin-Helmholtz instability, resulting in “flute-like” modes with . Numerical eigenmode solutions to the linearized Braginskii two-fluid equations Popovich:2010p1427 were performed, using experimentally measured density, temperature, and potential profiles. These solutions indicate that both types of modes are linearly unstable and have real frequency approximately equal to the measured frequency, leaving open the possibility that the saturated single unstable mode observed might be of either type of instability or a hybrid mode driven by both sources of free energy.
A two-strap “picture-frame” style antenna Zhang:2008p1423 ; Carter:2007p297 is inserted into the plasma at the far end of the depletion, 13 m from the plasma source. The antenna is centered on the depletion and aligned to launch SAWs along the depletion. Each strap of the antenna is driven and controlled independently, giving rise to two perpendicularly polarized, co-propagating SAWs. The frequencies of the two waves are offset by a few kHz, and with each frequency near half of the ion cyclotron frequency ( kHz at 800G). The peak wave magnetic field for SAWs used in this study ranges from 0.1G to 1G (). In the absence of the density depletion, the two SAWs interact nonlinearly, driving a nonresonant quasimode at their beat frequency Carter:2006p300 .
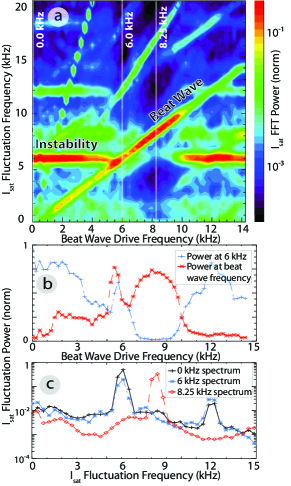
To investigate the interaction between the beating SAWs and the instability driven by the density depletion, a series of experiments were performed in which the beat frequency was set near the instability frequency and varied shot-to-shot. Fig. 2(a) shows the measured power spectrum near the depletion gradient maximum (at approximately x=2 cm, y=-1 cm (see Fig. 1 axes) 6 m from the antenna and 7 meters from cathode) as the beat frequency is varied over kHz.
The beat-driven response is observed to be strongest when the beat frequency is close to the instability frequency (6 kHz), with peaks centered at 5.5 kHz and 8.25 kHz as shown in Fig. 2(b). In this particular dataset, the peak RMS amplitude of the beat-response is . The measured beat-wave response is significantly stronger than that observed in the absence of the depletion, where for the same launched SAW parameters, a beat-wave amplitude of 5% is observed.
The most striking feature of Fig. 2 is the effect that the SAW beat wave has on the unstable mode at kHz. As the beat-wave frequency approaches 6 kHz from below, the spontaneous mode begins to decrease in power and is observed to downshift in frequency, meeting the beat wave where it appears to resonate near 5.5 kHz. As the beat wave is driven to higher frequency, the spontaneous mode appears completely absent, as if the growth of the mode is suppressed in the presence of the driven response. Fig. 2(b) illustrates the shift of fluctuation power from the instability to the driven fluctuations by showing the power at the unstable mode frequency ( kHz) and power in the beat frequency band ( kHz) as a function of driven beat frequency, essentially a horizontal and diagonal line cut of the data in Fig. 2(a). Also of note is the apparent reduction in broadband fluctuations while the unstable mode is suppressed. This is made clearer in Fig. 2(c), showing the measured power spectrum in the absence of the SAW beat wave (both antennas set to the same frequency, black line), and the spectrum in the presence of a 6 kHz (blue line) and an 8.25 kHz (red line) driven beat wave. As the beat frequency is increased further, eventually the instability returns as the beat-driven response appears to diminish.
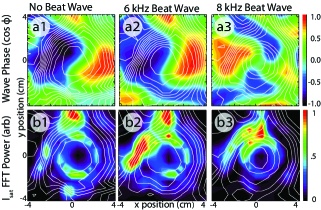
The peaks in Fig. 2(b) suggest that the SAW beat wave is resonantly driving a linear mode at kHz and kHz and this conjecture is supported by the spatial structure of the beat-wave response found using cross-correlation measurements. Figure 3 shows the two-dimensional cross-phase (row a) and spatial distribution of fluctuation power (row b) for three cases: the spontaneous mode in the absence of SAWs (column 1), the beat-wave response when driven at 6 kHz (column 2), and the beat wave response when driven at 8 kHz (column 3). Note that for the two beat-wave cases, the power in the beat-wave response is concentrated on the density gradient (Figs. 3(b2) and (b3)), similar to the spontaneous mode (Fig. 3(b1)). In contrast to this observation, in the absence of the depletion, the beat-wave has a much broader spatial distribution consistent with the pattern of the launched SAWs (not shown here). The correlation function of the beat driven response at 6 kHz (Fig. 3(a2)) is nearly identical to the spontaneous mode (Fig. 3(a1)) and indicates an mode structure. The beat driven response at 6kHz also rotates in the electron diamagnetic drift direction. The peak in the beat response at 8kHz corresponds to an mode, as shown in Fig. 3(a3).
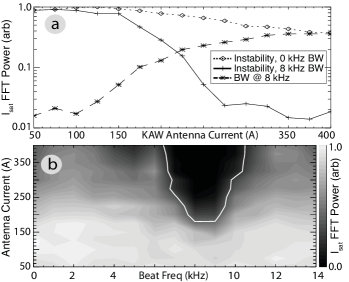
The appearance of the control of the instability shown in Fig. 2 depends strongly on the strength of the beat-wave drive, a parameter controlled by increasing the amplitude of the launched SAWs. Fig. 4(a) shows the variation in the beat-wave and the instability amplitudes as the SAW antenna current is increased (for fixed 8kHz beat frequency). A threshold is clear for affecting the instability, requiring the beat-wave amplitude to be on the order of 10% of the amplitude of the original unstable mode. It is also interesting to note that the beat-wave response saturates as the instability is completely suppressed. Also shown is the instability power as a function of antenna current in the case of zero beat frequency. A reduction of the instability power at high SAW amplitude is observed which can be attributed to profile modification due to electron heating by the launched SAWs Carter:2007p297 . This effect contributes to modification of the instability in the presence of SAWs, but is less significant than the reduction observed with non-zero beat frequency.
The width in beat frequency over which control of the instability is observed also varies with amplitude of the driven beat wave response. Fig. 4(b) shows the FFT power at the unstable mode frequency as a function of beat wave frequency and antenna current (which controls the amplitude of the interacting Alfvén waves). At higher currents, the instability () begins to be suppressed in favor of the higher frequency mode driven by the beat-wave (). The white contour in Fig. 4(b) indicates where the instability power is at 50% of the ‘background’ power with the antennas driving a zero beat frequency Alfvén wave. The broadening of the range over which the instability is controlled as the beat-wave power is increased is indicated by this contour. Similar observations are made in VINETA Brandt:2010p1445 , where the effect was compared to “Arnold Tongues” seen in nonlinearly driven unstable oscillators Schuster:2005p1484 ; Koepke:1991p1410 .
The exact mechanism by which the beating SAWs couple nonlinearly to and control the unstable mode is still under investigation. Experiments have established that the parallel wavelength of the beat wave is essential. Beat waves generated by co-propagating SAWs have very long parallel wavelength, as long or longer than the length of LAPD at low frequency Carter:2006p300 , similar to expectations for the parallel wave number of instabilities in the depletion. Experiments were performed in which counter-propagating SAWs interacted along the depletion, driving beat waves with much shorter parallel wavelength. In this case, much smaller response at the beat frequency is observed and the control behavior shown in Fig. 4 is not achieved.
An important question is whether or not transport is affected through this beat-wave control process. The unmodified instability has density-potential crossphase (Figure 1 (e)) that is inconsistent with fluctuation-driven particle transport. Past experiments on filamentary pressure striations with dominant coherent modes in LAPD have revealed classical transport levels Burke:1998p1416 . In the presence of the beat-wave in the experiments reported here, the density-potential crossphase is unaltered. Future ex- periments will investigate the interaction between SAW beat waves and broadband turbulence in LAPD, to see whether or not transport control can be affected, as has been seen in mode synchronization experiments on the VINETA device Brandt:2009p1425 .
In summary, a novel approach to control of gradient- driven instabilities in magnetized laboratory plasmas has been presented. Beating SAWs have been observed to nonlinearly interact with and control unstable fluctuations on a filamentary density depletion in LAPD. These results provide motivation for studying the interaction between RF and instabilities in other magnetized plasmas, including fusion plasmas, e.g. ICRF beat-wave interaction with microturbulence. ICRF beat waves have been successfully used to produce measurable plasma response at the beat frequency and to excite Alfvén eigenmodes in JET and ASDEX Upgrade Fasoli:1996p630 ; Sassenberg:2010p1485 , motivating future experiments in which the beat wave frequency is lowered into the range of drift-wave turbulence.
References
- (1) W. Horton, Rev. Mod. Phys. 71, 735 (1999).
- (2) G. Tynan et al., Plasma Phys. Contr. Fusion 51, 113001 (2009).
- (3) C. Schröder et al., Phys. Rev. Lett. 86, 5711 (2001).
- (4) C. Schröder et al., Phys. Plasmas 11, 4249 (2004).
- (5) C. Brandt et al., J. Nucl. Mater., 2009.
- (6) M. Shimada et al., Nucl. Fusion 47, S1 (2007).
- (7) P. Terry, Rev. Mod. Phys. 72, 109 (2000).
- (8) J. Myra and D. D’Ippolito, Phys. Plasmas 9, 3867 (2002).
- (9) A. Ince-Cushman et al., Phys. Rev. Lett. 102, 035002 (2009).
- (10) Y. Lin et al., Phys. Plasmas 16, 056102 (2009).
- (11) N. Wolf et al., Phys. Rev. Lett. 45, 799 (1980).
- (12) K. Wong and P. Bellan, Phys. Fluids 21, 841 (1978).
- (13) R. Gore et al., Phys. Rev. Lett. 40, 1140 (1978).
- (14) C. Liu and V. Tripathi, Phys. Fluids 23, 345 (1980).
- (15) S. Chiu et al., Plasma Phys. Contr. Fusion 31, 1095 (1989).
- (16) W. Gekelman et al., Rev. Sci. Inst. 62, 2875 (1991).
- (17) G. J. Morales and J.E. Maggs, Phys. Plasmas 4, 4118 (1997).
- (18) N. Palmer et al., Phys. Plasmas 12, 072102 (2005).
- (19) J. Maggs et al., Phys. Plasmas 4, 1881 (1997).
- (20) J. Penano et al., Phys. Plasmas 7, 144 (2000).
- (21) H. W. Hendel et al., Phys. Fluids 11, 2426 (1968).
- (22) P. Popovich et al., arXiv:1004.4674v1 [physics.plasm-ph].
- (23) Y. Zhang et al., Phys. Plasmas 15, 012103 (2008).
- (24) T.A. Carter et al., AIP Conf. Proceedings 932, 38 (2007).
- (25) T.A. Carter et al., Phys. Rev. Lett. 96, 155001 (2006).
- (26) C. Brandt et al., Phys. Plasmas 17, 032304 (2010).
- (27) M. E. Koepke and D. M. Hartley, Phys. Rev. A 44, 6877 (1991).
- (28) H. G. Schuster, Deterministic Chaos (VCH, Weinheim, 1989), p. 158
- (29) A. Burke et al., Phys. Rev. Lett. 81, 3659 (1998).
- (30) A. Fasoli et al., Nucl. Fusion 36, 258 (1996).
- (31) K Sassenberg et al., Nucl. Fusion 50, 052003 (2010)