Evidence for direct violation in the measurement of the CKM angle with decays
P. del Amo Sanchez
J. P. Lees
V. Poireau
E. Prencipe
V. Tisserand
Laboratoire d’Annecy-le-Vieux de Physique des Particules (LAPP), Université de Savoie, CNRS/IN2P3, F-74941 Annecy-Le-Vieux, France
J. Garra Tico
E. Grauges
Universitat de Barcelona, Facultat de Fisica, Departament ECM, E-08028 Barcelona, Spain
M. MartinelliabA. PalanoabM. PappagalloabINFN Sezione di Baria; Dipartimento di Fisica, Università di Barib, I-70126 Bari, Italy
G. Eigen
B. Stugu
L. Sun
University of Bergen, Institute of Physics, N-5007 Bergen, Norway
M. Battaglia
D. N. Brown
B. Hooberman
L. T. Kerth
Yu. G. Kolomensky
G. Lynch
I. L. Osipenkov
T. Tanabe
Lawrence Berkeley National Laboratory and University of California, Berkeley, California 94720, USA
C. M. Hawkes
A. T. Watson
University of Birmingham, Birmingham, B15 2TT, United Kingdom
H. Koch
T. Schroeder
Ruhr Universität Bochum, Institut für Experimentalphysik 1, D-44780 Bochum, Germany
D. J. Asgeirsson
C. Hearty
T. S. Mattison
J. A. McKenna
University of British Columbia, Vancouver, British Columbia, Canada V6T 1Z1
A. Khan
A. Randle-Conde
Brunel University, Uxbridge, Middlesex UB8 3PH, United Kingdom
V. E. Blinov
A. R. Buzykaev
V. P. Druzhinin
V. B. Golubev
A. P. Onuchin
S. I. Serednyakov
Yu. I. Skovpen
E. P. Solodov
K. Yu. Todyshev
A. N. Yushkov
Budker Institute of Nuclear Physics, Novosibirsk 630090, Russia
M. Bondioli
S. Curry
D. Kirkby
A. J. Lankford
M. Mandelkern
E. C. Martin
D. P. Stoker
University of California at Irvine, Irvine, California 92697, USA
H. Atmacan
J. W. Gary
F. Liu
O. Long
G. M. Vitug
University of California at Riverside, Riverside, California 92521, USA
C. Campagnari
T. M. Hong
D. Kovalskyi
J. D. Richman
University of California at Santa Barbara, Santa Barbara, California 93106, USA
A. M. Eisner
C. A. Heusch
J. Kroseberg
W. S. Lockman
A. J. Martinez
T. Schalk
B. A. Schumm
A. Seiden
L. O. Winstrom
University of California at Santa Cruz, Institute for Particle Physics, Santa Cruz, California 95064, USA
C. H. Cheng
D. A. Doll
B. Echenard
D. G. Hitlin
P. Ongmongkolkul
F. C. Porter
A. Y. Rakitin
California Institute of Technology, Pasadena, California 91125, USA
R. Andreassen
M. S. Dubrovin
G. Mancinelli
B. T. Meadows
M. D. Sokoloff
University of Cincinnati, Cincinnati, Ohio 45221, USA
P. C. Bloom
W. T. Ford
A. Gaz
J. F. Hirschauer
M. Nagel
U. Nauenberg
J. G. Smith
S. R. Wagner
University of Colorado, Boulder, Colorado 80309, USA
R. Ayad
Now at Temple University, Philadelphia, Pennsylvania 19122, USA
W. H. Toki
Colorado State University, Fort Collins, Colorado 80523, USA
T. M. Karbach
J. Merkel
A. Petzold
B. Spaan
K. Wacker
Technische Universität Dortmund, Fakultät Physik, D-44221 Dortmund, Germany
M. J. Kobel
K. R. Schubert
R. Schwierz
Technische Universität Dresden, Institut für Kern- und Teilchenphysik, D-01062 Dresden, Germany
D. Bernard
M. Verderi
Laboratoire Leprince-Ringuet, CNRS/IN2P3, Ecole Polytechnique, F-91128 Palaiseau, France
P. J. Clark
S. Playfer
J. E. Watson
University of Edinburgh, Edinburgh EH9 3JZ, United Kingdom
M. AndreottiabD. BettoniaC. BozziaR. CalabreseabA. CecchiabG. CibinettoabE. FioravantiabP. FranchiniabE. LuppiabM. MuneratoabM. NegriniabA. PetrellaabL. PiemonteseaINFN Sezione di Ferraraa; Dipartimento di Fisica, Università di Ferrarab, I-44100 Ferrara, Italy
R. Baldini-Ferroli
A. Calcaterra
R. de Sangro
G. Finocchiaro
M. Nicolaci
S. Pacetti
P. Patteri
I. M. Peruzzi
Also with Università di Perugia, Dipartimento di Fisica, Perugia, Italy
M. Piccolo
M. Rama
A. Zallo
INFN Laboratori Nazionali di Frascati, I-00044 Frascati, Italy
R. ContriabE. GuidoabM. Lo VetereabM. R. MongeabS. PassaggioaC. PatrignaniabE. RobuttiaS. TosiabINFN Sezione di Genovaa; Dipartimento di Fisica, Università di Genovab, I-16146 Genova, Italy
B. Bhuyan
Indian Institute of Technology Guwahati, Guwahati, Assam, 781 039, India
M. Morii
Harvard University, Cambridge, Massachusetts 02138, USA
A. Adametz
J. Marks
S. Schenk
U. Uwer
Universität Heidelberg, Physikalisches Institut, Philosophenweg 12, D-69120 Heidelberg, Germany
F. U. Bernlochner
H. M. Lacker
T. Lueck
A. Volk
Humboldt-Universität zu Berlin, Institut für Physik, Newtonstr. 15, D-12489 Berlin, Germany
P. D. Dauncey
M. Tibbetts
Imperial College London, London, SW7 2AZ, United Kingdom
P. K. Behera
U. Mallik
University of Iowa, Iowa City, Iowa 52242, USA
C. Chen
J. Cochran
H. B. Crawley
L. Dong
W. T. Meyer
S. Prell
E. I. Rosenberg
A. E. Rubin
Iowa State University, Ames, Iowa 50011-3160, USA
Y. Y. Gao
A. V. Gritsan
Z. J. Guo
Johns Hopkins University, Baltimore, Maryland 21218, USA
N. Arnaud
M. Davier
D. Derkach
J. Firmino da Costa
G. Grosdidier
F. Le Diberder
A. M. Lutz
B. Malaescu
A. Perez
P. Roudeau
M. H. Schune
J. Serrano
V. Sordini
Also with Università di Roma La Sapienza, I-00185 Roma, Italy
A. Stocchi
L. Wang
G. Wormser
Laboratoire de l’Accélérateur Linéaire, IN2P3/CNRS et Université Paris-Sud 11, Centre Scientifique d’Orsay, B. P. 34, F-91898 Orsay Cedex, France
D. J. Lange
D. M. Wright
Lawrence Livermore National Laboratory, Livermore, California 94550, USA
I. Bingham
J. P. Burke
C. A. Chavez
J. P. Coleman
J. R. Fry
E. Gabathuler
R. Gamet
D. E. Hutchcroft
D. J. Payne
C. Touramanis
University of Liverpool, Liverpool L69 7ZE, United Kingdom
A. J. Bevan
F. Di Lodovico
R. Sacco
M. Sigamani
Queen Mary, University of London, London, E1 4NS, United Kingdom
G. Cowan
S. Paramesvaran
A. C. Wren
University of London, Royal Holloway and Bedford New College, Egham, Surrey TW20 0EX, United Kingdom
D. N. Brown
C. L. Davis
University of Louisville, Louisville, Kentucky 40292, USA
A. G. Denig
M. Fritsch
W. Gradl
A. Hafner
Johannes Gutenberg-Universität Mainz, Institut für Kernphysik, D-55099 Mainz, Germany
K. E. Alwyn
D. Bailey
R. J. Barlow
G. Jackson
G. D. Lafferty
T. J. West
University of Manchester, Manchester M13 9PL, United Kingdom
J. Anderson
R. Cenci
A. Jawahery
D. A. Roberts
G. Simi
J. M. Tuggle
University of Maryland, College Park, Maryland 20742, USA
C. Dallapiccola
E. Salvati
University of Massachusetts, Amherst, Massachusetts 01003, USA
R. Cowan
D. Dujmic
P. H. Fisher
G. Sciolla
M. Zhao
Massachusetts Institute of Technology, Laboratory for Nuclear Science, Cambridge, Massachusetts 02139, USA
D. Lindemann
P. M. Patel
S. H. Robertson
M. Schram
McGill University, Montréal, Québec, Canada H3A 2T8
P. BiassoniabA. LazzaroabV. LombardoaF. PalomboabS. StrackaabINFN Sezione di Milanoa; Dipartimento di Fisica, Università di Milanob, I-20133 Milano, Italy
L. Cremaldi
R. Godang
Now at University of South Alabama, Mobile, Alabama 36688, USA
R. Kroeger
P. Sonnek
D. J. Summers
H. W. Zhao
University of Mississippi, University, Mississippi 38677, USA
X. Nguyen
M. Simard
P. Taras
Université de Montréal, Physique des Particules, Montréal, Québec, Canada H3C 3J7
G. De NardoabD. MonorchioabG. OnoratoabC. SciaccaabINFN Sezione di Napolia; Dipartimento di Scienze Fisiche, Università di Napoli Federico IIb, I-80126 Napoli, Italy
G. Raven
H. L. Snoek
NIKHEF, National Institute for Nuclear Physics and High Energy Physics, NL-1009 DB Amsterdam, The Netherlands
C. P. Jessop
K. J. Knoepfel
J. M. LoSecco
W. F. Wang
University of Notre Dame, Notre Dame, Indiana 46556, USA
L. A. Corwin
K. Honscheid
R. Kass
J. P. Morris
A. M. Rahimi
Ohio State University, Columbus, Ohio 43210, USA
N. L. Blount
J. Brau
R. Frey
O. Igonkina
J. A. Kolb
R. Rahmat
N. B. Sinev
D. Strom
J. Strube
E. Torrence
University of Oregon, Eugene, Oregon 97403, USA
G. CastelliabE. FeltresiabN. GagliardiabM. MargoniabM. MorandinaM. PosoccoaM. RotondoaF. SimonettoabR. StroiliabINFN Sezione di Padovaa; Dipartimento di Fisica, Università di Padovab, I-35131 Padova, Italy
E. Ben-Haim
G. R. Bonneaud
H. Briand
G. Calderini
J. Chauveau
O. Hamon
Ph. Leruste
G. Marchiori
J. Ocariz
J. Prendki
S. Sitt
Laboratoire de Physique Nucléaire et de Hautes Energies, IN2P3/CNRS, Université Pierre et Marie Curie-Paris6, Université Denis Diderot-Paris7, F-75252 Paris, France
M. BiasiniabE. ManoniabINFN Sezione di Perugiaa; Dipartimento di Fisica, Università di Perugiab, I-06100 Perugia, Italy
C. AngeliniabG. BatignaniabS. BettariniabM. CarpinelliabAlso with Università di Sassari, Sassari, Italy
G. CasarosaabA. CervelliabF. FortiabM. A. GiorgiabA. LusianiacN. NeriabE. PaoloniabG. RizzoabJ. J. WalshaINFN Sezione di Pisaa; Dipartimento di Fisica, Università di Pisab; Scuola Normale Superiore di Pisac, I-56127 Pisa, Italy
D. Lopes Pegna
C. Lu
J. Olsen
A. J. S. Smith
A. V. Telnov
Princeton University, Princeton, New Jersey 08544, USA
F. AnulliaE. BaracchiniabG. CavotoaR. FacciniabF. FerrarottoaF. FerroniabM. GasperoabL. Li GioiaM. A. MazzoniaG. PireddaaF. RengaabINFN Sezione di Romaa; Dipartimento di Fisica, Università di Roma La Sapienzab, I-00185 Roma, Italy
M. Ebert
T. Hartmann
T. Leddig
H. Schröder
R. Waldi
Universität Rostock, D-18051 Rostock, Germany
T. Adye
B. Franek
E. O. Olaiya
F. F. Wilson
Rutherford Appleton Laboratory, Chilton, Didcot, Oxon, OX11 0QX, United Kingdom
S. Emery
G. Hamel de Monchenault
G. Vasseur
Ch. Yèche
M. Zito
CEA, Irfu, SPP, Centre de Saclay, F-91191 Gif-sur-Yvette, France
I. J. R. Aitchison
Also with University of Oxford, Theoretical Physics Department, Oxford, OX1 3NP, United Kingdom
M. T. Allen
D. Aston
D. J. Bard
R. Bartoldus
J. F. Benitez
C. Cartaro
M. R. Convery
J. Dorfan
G. P. Dubois-Felsmann
W. Dunwoodie
R. C. Field
M. Franco Sevilla
B. G. Fulsom
A. M. Gabareen
M. T. Graham
P. Grenier
C. Hast
W. R. Innes
M. H. Kelsey
H. Kim
P. Kim
M. L. Kocian
D. W. G. S. Leith
S. Li
B. Lindquist
S. Luitz
V. Luth
H. L. Lynch
D. B. MacFarlane
H. Marsiske
D. R. Muller
H. Neal
S. Nelson
C. P. O’Grady
I. Ofte
M. Perl
T. Pulliam
B. N. Ratcliff
A. Roodman
A. A. Salnikov
V. Santoro
R. H. Schindler
J. Schwiening
A. Snyder
D. Su
M. K. Sullivan
S. Sun
K. Suzuki
J. M. Thompson
J. Va’vra
A. P. Wagner
M. Weaver
C. A. West
W. J. Wisniewski
M. Wittgen
D. H. Wright
H. W. Wulsin
A. K. Yarritu
C. C. Young
V. Ziegler
SLAC National Accelerator Laboratory, Stanford, California 94309 USA
X. R. Chen
W. Park
M. V. Purohit
R. M. White
J. R. Wilson
University of South Carolina, Columbia, South Carolina 29208, USA
S. J. Sekula
Southern Methodist University, Dallas, Texas 75275, USA
M. Bellis
P. R. Burchat
A. J. Edwards
T. S. Miyashita
Stanford University, Stanford, California 94305-4060, USA
S. Ahmed
M. S. Alam
J. A. Ernst
B. Pan
M. A. Saeed
S. B. Zain
State University of New York, Albany, New York 12222, USA
N. Guttman
A. Soffer
Tel Aviv University, School of Physics and Astronomy, Tel Aviv, 69978, Israel
P. Lund
S. M. Spanier
University of Tennessee, Knoxville, Tennessee 37996, USA
R. Eckmann
J. L. Ritchie
A. M. Ruland
C. J. Schilling
R. F. Schwitters
B. C. Wray
University of Texas at Austin, Austin, Texas 78712, USA
J. M. Izen
X. C. Lou
University of Texas at Dallas, Richardson, Texas 75083, USA
F. BianchiabD. GambaabM. PelliccioniabINFN Sezione di Torinoa; Dipartimento di Fisica Sperimentale, Università di Torinob, I-10125 Torino, Italy
M. BombenabL. LanceriabL. VitaleabINFN Sezione di Triestea; Dipartimento di Fisica, Università di Triesteb, I-34127 Trieste, Italy
N. Lopez-March
F. Martinez-Vidal
D. A. Milanes
A. Oyanguren
IFIC, Universitat de Valencia-CSIC, E-46071 Valencia, Spain
J. Albert
Sw. Banerjee
H. H. F. Choi
K. Hamano
G. J. King
R. Kowalewski
M. J. Lewczuk
I. M. Nugent
J. M. Roney
R. J. Sobie
University of Victoria, Victoria, British Columbia, Canada V8W 3P6
T. J. Gershon
P. F. Harrison
J. Ilic
T. E. Latham
E. M. T. Puccio
Department of Physics, University of Warwick, Coventry CV4 7AL, United Kingdom
H. R. Band
X. Chen
S. Dasu
K. T. Flood
Y. Pan
R. Prepost
C. O. Vuosalo
S. L. Wu
University of Wisconsin, Madison, Wisconsin 53706, USA
Abstract
We report the measurement of the Cabibbo-Kobayashi-Maskawa -violating angle through a Dalitz plot analysis
of neutral meson decays to and produced in the processes ,
with , and with ,
using
468 million pairs collected by the BABAR detector at the
PEP-II asymmetric-energy collider at SLAC.
We measure
(modulo ),
where the first error is statistical, the second is the experimental
systematic uncertainty and the third reflects the uncertainty in
the description of the neutral decay amplitudes.
This result is inconsistent with (no direct violation)
with a significance of standard deviations.
pacs:
13.25.Hw, 11.30.Er, 12.15.Hh, 13.25.Ft
The breaking of the symmetry
in the quark sector of the electroweak interactions arises
in the standard model
(SM) from a single irreducible phase in the Cabibbo-Kobayashi-Maskawa (CKM) quark-mixing matrix ref:CKM .
This phase can be
measured
using a variety of methods involving -meson decays mediated by either only tree-level or both tree- and loop-level amplitudes.
The comparison of these two classes of measurements tests the CKM mechanism,
thus offering a strategy to search for new physics ref:globalCKMfits .
The angle of the unitarity triangle, defined as ,
where are elements of the CKM matrix,
is particularly relevant
since it is the
only -violating
parameter that can be cleanly determined using
solely
tree-level -meson decays. Its precise determination constitutes an important goal
of present and future
experiments in flavor physics.
In
decays ref:carter-sanda-bigi ; ref:DDstar
the color-favored () and the color-suppressed ()
transitions ref:chargeconj interfere when the and decay to a common final state ref:gronau-soni-ggsz_ads .
The two interfering amplitudes differ by a factor , where is the magnitude of the ratio of the amplitudes
and , and is their relative strong phase.
An amplitude analysis of the Dalitz plot (DP) of and mesons decaying into the and self-conjugate
final states
from
decays
offers a unique way to access the complex amplitude ratios and thus the weak and strong phases, and .
The experimental sensitivity to arises mostly from regions in the DP where
Cabibbo-favored (CF) and doubly-Cabibbo-suppressed (DCS) amplitudes interfere, and from regions
populated by eigenstates,
thus the uncertainty on depends on ().
In this Letter we study the interference between color-favored and color-suppressed transitions
as a function of the position in the DP of squared invariant masses , , where
represents or , for three related decays,
, , and ref:DDstar ; ref:KstarDstar ,
and report the most precise single measurement of the complex amplitude ratios
and evidence for direct violation.
We use the complete data sample of 425 of integrated luminosity at the ,
corresponding to pairs, and 45 at a center-of-mass (c.m.) energy 40 below the ,
recorded by the BABAR experiment ref:detector at the PEP-II asymmetric-energy collider at SLAC
from 1999 to 2008.
This measurement updates our previous results based on a partial sample of pairs,
from which we reported a significance of direct violation () of standard deviations,
while most of the analysis details remain unchanged ref:babar_dalitzpub2008 .
The Belle Collaboration using , alone ref:belle_dalitzpub
has also reported with a significance of standard deviations.
We reconstruct a total of eight signal samples,
and ,
with , ,
with selection criteria nearly identical to our previous analysis.
The final state, for , has been considered for the first time.
For candidates, we further require the decay length
(defined by the production and decay vertices) projected along the momentum
to be greater than 10 times its
error.
This additional
requirement
helps to reduce to a negligible level background events
from decays, and from misreconstructed as .
After all the selection criteria the background is completely dominated by random combinations of tracks arising from
continuum events, ().
Background contributions from decays are found to be negligible.
The candidates are characterized
using the beam-energy substituted mass ,
the difference between the reconstructed energy of the candidate and the beam energy in the c.m. frame ,
and a Fisher discriminant that combines four topological variables
optimized to separate continuum events ref:babar_dalitzpub2008 .
We retain candidates
with the loose requirements
, , and ,
which provide signal and sideband regions while removing poorly reconstructed candidates ref:epaps .
The reconstruction efficiencies
in a signal region with and are , , , and , for the ,
,
,
and final states, respectively,
for (and slightly lower for ).
These values
are about 30%, 40%, 30%, and 20% larger than in our previous analysis,
with similar
background levels,
reflecting improvements in tracking and particle identification.
The , , , and distributions for events in the signal region can be found in ref:epaps .
The decay amplitudes are determined using the same data sample
through
DP analyses of mesons from decays produced
in events ref:babar_dalitzpub2008 ; ref:dmixing-kshh .
The charge of the low momentum from
the decay identifies
the flavor of the meson.
The signal purities of the samples are and ,
with about and candidates, for and , respectively.
The dynamical properties of the P- and D-wave amplitudes
are parameterized through intermediate resonances with mass-dependent relativistic Breit-Wigner (BW) or
Gounaris-Sakurai
propagators,
Blatt-Weisskopf centrifugal barrier factors, and
Zemach tensors for the angular distributions ref:RevDalitzPlotFormalism .
The S-wave dynamics is described
through a K-matrix formalism with the P-vector approximation and 5 poles ref:AS ; ref:babar_dalitzpub2008 .
For the S-wave we include a BW for the state with a coherent
non-resonant contribution
parameterized
by a scattering length and effective range similar to those used to describe scattering data ref:LASS .
For the S-wave, a coupled-channel BW is used for the with single BWs for and states.
Overall, the amplitude models reproduce well the DP distributions ref:dmixing-kshh .
MC studies show that a significant contribution to the
discrepancies arise from
imperfections modeling the efficiency variations at the boundaries of the DP and the invariant mass resolution.
We account for these and other imperfections in the modeling of the decay amplitudes through our model
systematic uncertainties.
We perform a simultaneous, unbinned, and extended maximum-likelihood fit (referred to as fit)
to the and
decay rates and
as a function of , , , and ref:babar_dalitzpub2008 ; ref:epaps .
We extract the signal and background yields,
along with the
-violating parameters
and ,
defined as the complex amplitude ratios and
,
respectively.
Here, and are the corresponding magnitude ratios
between the and amplitudes for decays,
and the relative strong phases, and an effective hadronic parameter
that accounts for the interference between and other decays,
as a consequence of the natural width ref:gronau2003 ; ref:BR-BtoDKst ; ref:babar_dalitzpub2008 .
Assuming no violation and neglecting mixing in
decays ref:dmixing-kshh ; ref:dmixing-kspipi-belle ; ref:mixingeffects ,
the relation
holds,
where is the decay amplitude.
The
(and similarly for replacing and by and , respectively)
signal decay rates
are then
with , and except
for where ref:bondar_gershon .
We apply corrections for efficiency variations and neglect the invariant mass resolution across the DP ref:babar_dalitzpub2008 .
For each signal sample,
the following
background components are considered:
continuum events, decays where the pion is misidentified as a kaon
(only for samples), and
(other than ) decays.
The reference fit requires events to satisfy ,
but alternative fits are performed varying the requirements on the , , and variables
(e.g. or ) to study the stability of the results.
The probability density functions (PDFs) introduced to describe
the signal, continuum, and misidentification components,
along with the misidentification yields,
are determined using events
from signal and control
samples.
The PDFs for background events are obtained from
large Monte Carlo (MC) samples with full detector simulations ref:babar_dalitzpub2008 .
The fit yields (), (), (), and () signal
, , , and events, respectively, for the () final state.
The results for the -violating parameters
and are summarized in Table 1.
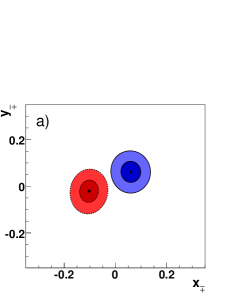
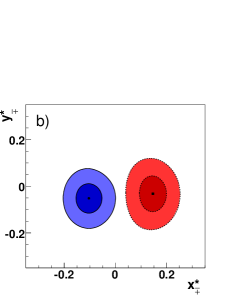
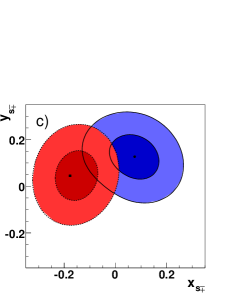
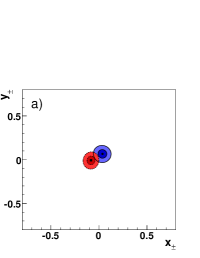
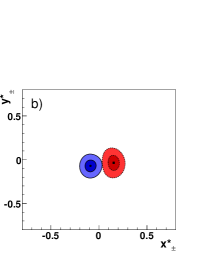
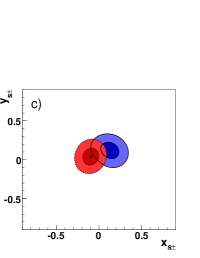
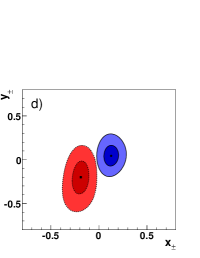
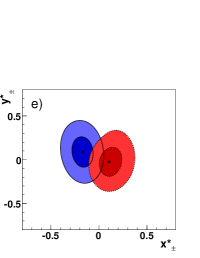
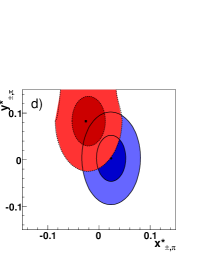
Figure 1
shows
the and 2-dimensional confidence-level (CL) contours
in the , , and planes, corresponding to one- and two-standard deviation regions,
including statistical errors only.
The distance between the and central values (and similarly for and )
is equal to , and
the angle defined by the lines connecting
the central values
with the origin is ,
and thus is a measurement of direct violation.
Fitting separately the data for and final states we find consistent results
for all the -violating parameters ref:epaps .
Table 1:
-violating complex parameters
and
as obtained from the fit.
The first error is statistical, the second is the experimental systematic uncertainty and the third is
the systematic uncertainty associated with the decay amplitude models.
Real part (%)
Imaginary part (%)
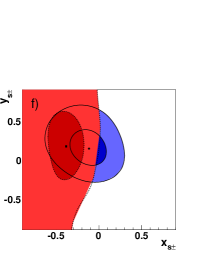
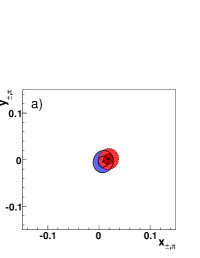
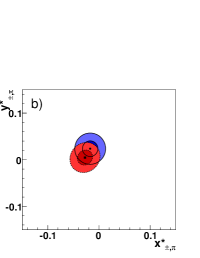
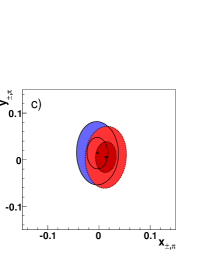
Figure 1: (color online). Contours at (dark) and (light) 2-dimensional CL in the (a) ,
(b) , and (c) planes, corresponding to one- and two-standard deviation regions (statistical only),
for (solid lines) and (dotted lines) decays.
Experimental systematic errors ref:babar_dalitzpub2008 ; ref:epaps originate from uncertainties in the description of the efficiency variations across the DP,
the modeling of the DP distributions for background events containing misreconstructed mesons,
the fractions of continuum and background events containing a real meson with
either a negatively- or positively-charged kaon (or ),
and from residual direct violation in the and background components.
We also account for
statistical and systematic uncertainties
in the , , and PDF shapes for signal and background components, and the misidentification yields.
These uncertainties account for effects that arise from the dependence of the and PDF shapes on the chosen signal region,
the differences in background for real and misreconstructed mesons,
and our limited knowledge of the endpoint, the peaking contributions to the small background, and the c.m. frame.
Smaller
systematic uncertainties originate from the
DP resolution,
wrongly reconstructed
signal events with a real and a kaon (or ) from the other meson decay,
the selection of candidates sharing tracks with other candidates,
and numerical precision in the evaluation of the PDF integrals.
We also account for residual cross-feed of events into the
sample
(about 5%),
and the estimated uncertainty on the hadronic parameter in the
sample ref:babar_dalitzpub2008 ; ref:glwadsDzKstarm .
Assumptions in the decay amplitude models are also a source of systematic uncertainty ref:babar_dalitzpub2008 ; ref:epaps ; ref:dmixing-kshh .
We use alternative models where the BW parameters
are varied according to their uncertainties or
within the ranges allowed by measurements from other experiments,
the reference K-matrix solution ref:babar_dalitzpub2008 is replaced by other solutions ref:AS ,
and the standard parameterizations are substituted
by
other related choices.
These include replacing the
Gounaris-Sakurai
and S-wave parameterizations by BW lineshapes,
removing the mass dependence in the P-vector ref:Kmatrix-Pvector ,
changes in form factors such as changes in the Blatt-Weisskopf radius,
and adopting a helicity formalism ref:RevDalitzPlotFormalism to describe the angular dependence.
Other models are built
by removing or adding resonances with small or negligible fractions.
We find that the overall amplitude model uncertainty on the parameters
are dominated by alternative models built to account for experimental systematic
effects in the determination of using tagged mesons ref:dmixing-kshh .
The statistical errors and variations in the model
parameters with and without - mixing are also propagated to and .
Experimental and amplitude model systematic uncertainties ref:epaps have been reduced with respect to our
previous measurement ref:babar_dalitzpub2008 as consequence of the use of larger data and Monte Carlo samples,
and the smaller experimental systematic contributions to the model uncertainty resulting from the improvements in the
analysis of tagged mesons ref:dmixing-kshh .
A frequentist construction of 1-dimensional confidence intervals of the physically relevant parameters
based on the vector of measurements
and their
correlations ref:epaps
has been adopted ref:babar_dalitzpub2008 .
The
procedure takes into account unphysical regions
which may arise since we allow and events to have different , in the measurements.
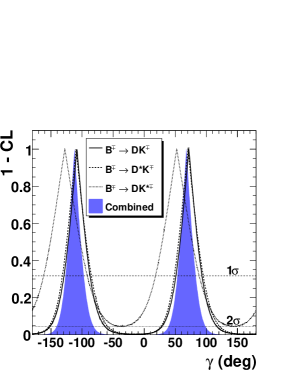
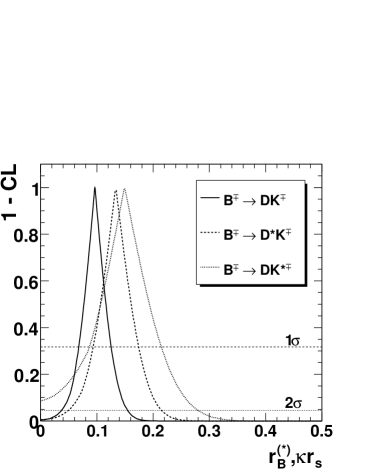
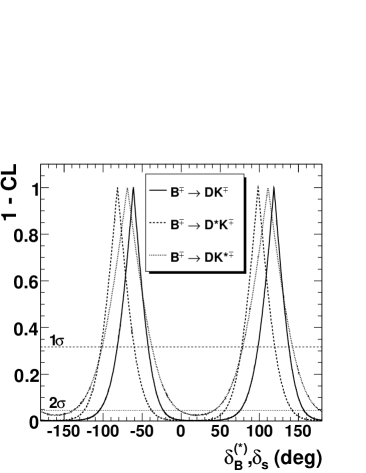
Figure 2 shows
as a function of for each of the three decay channels separately and their combination.
Similar scans for , , , and can be found in ref:epaps .
The method has a
single
ambiguity in the weak and strong phases.
The results for all the parameters are listed in Table 2.
The significances of direct violation ()
are CL=, , , and ,
which correspond to , , , and standard deviations,
for , , , and their combination, respectively.
Figure 2: (color online). as a
function of for , , and
decays separately, and their combination, including statistical and
systematic uncertainties. The dashed (upper) and dotted (lower) horizontal lines correspond to the one- and two-standard
deviation intervals, respectively.
Table 2: The and 1-dimensional CL regions,
equivalent to one- and two-standard deviation intervals,
for , , , , and ,
including all sources of uncertainty.
The values inside brackets indicate the symmetric error contributions to the total error coming from
experimental and amplitude model systematic uncertainties.
Parameter
CL
CL
We have presented a measurement of the
to complex amplitude ratios
in the processes and ,
using a combined DP analysis of and decays.
The results have improved precision and are consistent with our previous measured values ref:babar_dalitzpub2008
and with those reported by the Belle Collaboration with
alone ref:belle_dalitzpub ,
and with determinations based on other meson final states ref:glwadsDzDstarzKm ; ref:glwadsDzKstarm ; ref:otherexp_glwads .
From
our measurement
we determine (modulo ),
exclude the no direct -violation hypothesis (i.e., ) with a CL
equivalent to standard deviations, and derive the most precise single
determinations of the magnitude ratios and .
We are grateful for the excellent luminosity and machine conditions
provided by our PEP-II colleagues,
and for the substantial dedicated effort from
the computing organizations that support BABAR.
The collaborating institutions wish to thank
SLAC for its support and kind hospitality.
This work is supported by
DOE
and NSF (USA),
NSERC (Canada),
CEA and
CNRS-IN2P3
(France),
BMBF and DFG
(Germany),
INFN (Italy),
FOM (The Netherlands),
NFR (Norway),
MES (Russia),
MICIIN (Spain),
STFC (United Kingdom).
Individuals have received support from the
Marie Curie EIF (European Union),
the A. P. Sloan Foundation (USA)
and the Binational Science Foundation (USA-Israel).
References
(1) N. Cabibbo, Phys. Rev. Lett. 10, 531 (1963); M. Kobayashi and T. Maskawa, Prog. Theor. Phys. 49, 652 (1973).
(2) Y. Grossman, M. P. Worah, Phys. Lett. B 395, 241 (1997);
J. Charles et al., Eur. Phys. Jour. C 41, 1 (2005) and updates at http://ckmfitter.in2p3.fr/;
F. J. Botella, G. C. Branco, M. Nebot, Nucl. Phys. B 768, 1 (2007);
M. Bona et al., JHEP 803, 049 (2008) and updates at http://www.utfit.org/.
(3) A. B. Carter and A. I. Sanda, Phys. Rev. Lett. 45, 952 (1980); I. I. Bigi and A. I. Sanda, Phys. Lett. B 211, 213 (1988).
(4) The symbol () indicates either a () or a () meson.
(5) Reference to the charge-conjugate state is implied here and throughout the text unless otherwise specified.
(6) M. Gronau and D. London, Phys. Lett. B 253, 483 (1991);
M. Gronau and D. Wyler, Phys. Lett. B 265, 172 (1991);
D. Atwood, I. Dunietz and A. Soni, Phys. Rev. Lett. 78, 3257 (1997); Phys. Rev. D 63, 036005 (2001);
A. Giri, Y. Grossman, A. Soffer and J. Zupan, Phys. Rev. D 68, 054018 (2003).
(7) , , and refer to , , and mesons, respectively.
(8) B. Aubert et al. (BABAR Collaboration), Nucl. Instrum. Methods Phys. Res., Sect. A 479, 1 (2002).
(9) B. Aubert et al. (BABAR Collaboration), Phys. Rev. D 78, 034023 (2008); Phys. Rev. Lett. 95, 121802 (2005).
(10) A. Poluektov et al. (Belle Collaboration), Phys. Rev. D 81, 112002 (2010); Phys. Rev. D 73, 112009 (2006).
(11) See supplementary material for additional plots and tables.
(12) P. del Amo Sanchez et al. (BABAR Collaboration),
Phys. Rev. Lett. 105, 081803 (2010).
(13) See review on Dalitz plot Analysis Formalism in C. Amsler et al., Phys. Lett. B 667, 1 (2008).
(14) V. V. Anisovich and A. V. Sarantsev, Eur. Phys. Jour. A16, 229 (2003).
(15) D. Aston et al. (LASS Collaboration), Nucl. Phys. B 296, 493 (1988); W. Dunwoodie, private communication.
(16) M. Gronau, Phys. Lett. B 557, 198 (2003).
(17) B. Aubert et al. (BABAR Collaboration), Phys. Rev. D 73, 111104(R) (2006).
(18) L. M. Zhang et al. (Belle Collaboration), Phys. Rev. Lett. 99, 131803 (2007).
(19) Y. Grossman, A. Soffer, J. Zupan, Phys. Rev. D 72, 031501 (2005).
(20) A. Bondar and T. Gershon, Phys. Rev. D 70, 091503 (2004).
(21) B. Aubert et al. (BABAR Collaboration),
Phys. Rev. D 80, 092001 (2009).
(22) I. J. R. Aitchison, Nucl. Phys. A 189, 417 (1972).
(23) P. del Amo Sanchez (BABAR Collaboration),
arXiv:1007.0504, to appear in Phys. Rev. D ; arXiv:1006.4241, to appear in Phys. Rev. D ; B. Aubert et al. (BABAR Collaboration),
Phys. Rev. D 78, 092002 (2008).
(24) K. Abe et al. (Belle Collaboration), Phys. Rev. D 73, 051106(R) (2006);
Y. Horii et al. (Belle Collaboration), Phys. Rev. D 78, 071901(R) (2008);
T. Aaltonen et al. (CDF Collaboration), Phys. Rev. D 81, 031105(R) (2010).
Evidence for direct violation in the measurement of the CKM angle with decays
The BABAR Collaboration
The following includes supplementary material for the Electronic
Physics Auxiliary Publication Service.
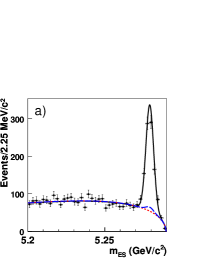
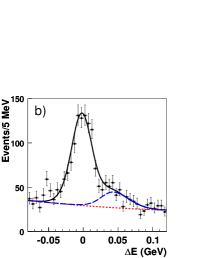
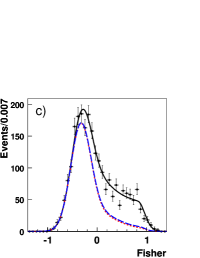
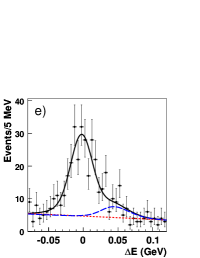
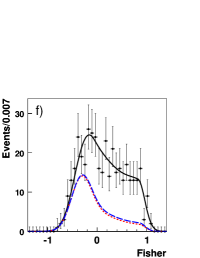
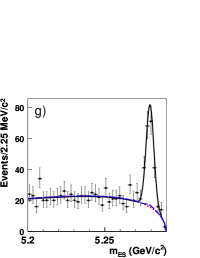
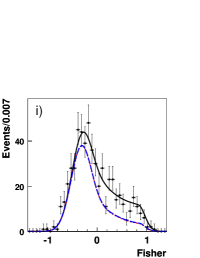
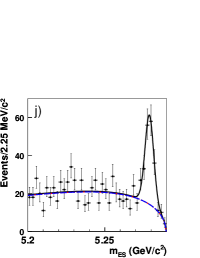
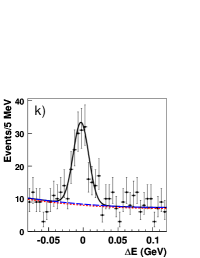
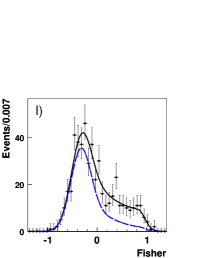
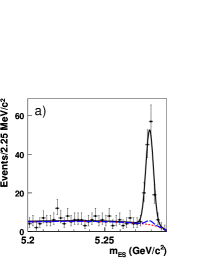
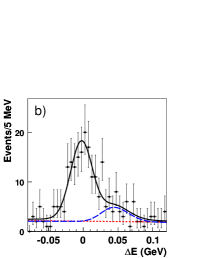
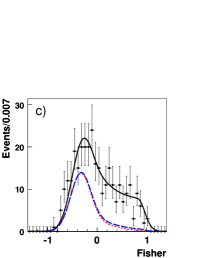
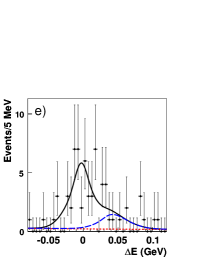
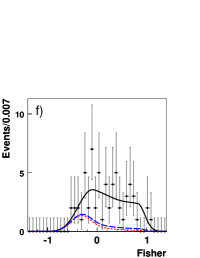
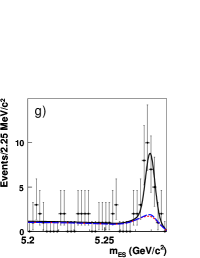
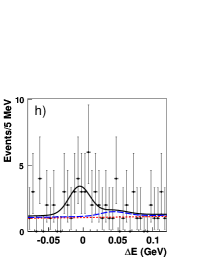
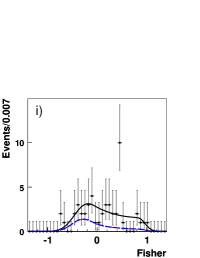
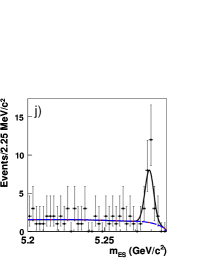
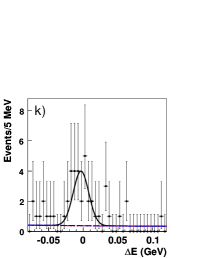
Figure 1: (color online).
The (first column), (second column), and (third column) distributions for
(a)-(c) ,
(d)-(f) ,
(g)-(i) , and
(j)-(l) decays, with .
The distributions are for events in the signal region defined through the requirements
, , and , except the one on the plotted variable,
after all the selection criteria are applied.
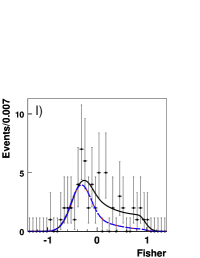
The curves superimposed represent the projections of the fit:
signal plus background (solid black lines), the continuum plus background contributions (dotted red lines),
and the sum of the continuum, , and misidentification background components (dashed blue lines).
The reconstruction efficiencies (purities) in the signal region, based on simulation studies, are
(), (), (), and (), respectively.
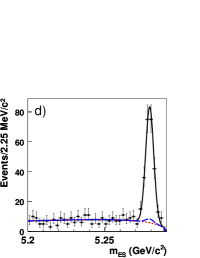
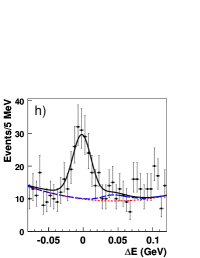
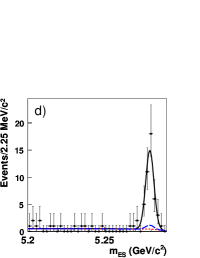
Figure 2: (color online).
Same as in Fig. 1 but for
(a)-(c) ,
(d)-(f) ,
(g)-(i) , and
(j)-(l) decays, with .
The reconstruction efficiencies (purities) in the signal region, based on simulation studies, are in this case
(), (), (), and (), respectively.
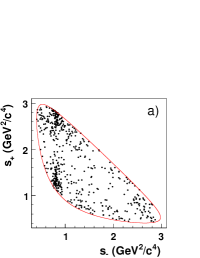
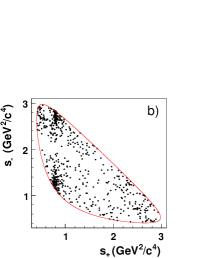
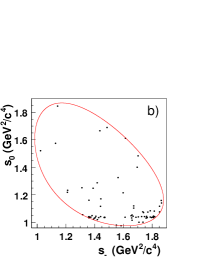
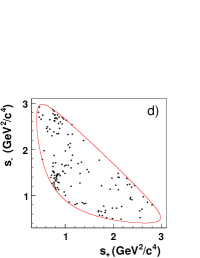
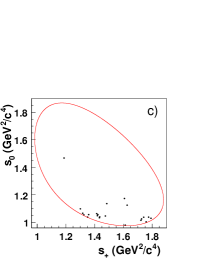
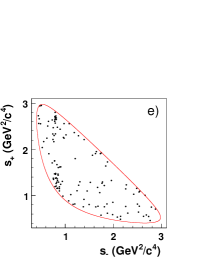
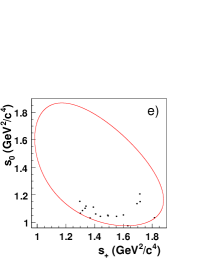
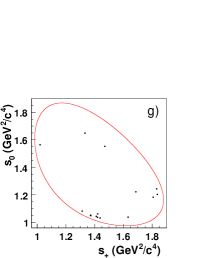
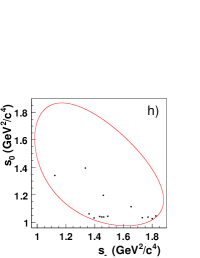
Figure 3: (color online).
The DP distributions for
(a)(b) ,
(c)(d) ,
(e)(f) , and
(g)(h) decays, with (left panel) and (right panel).
The distributions are for events in the signal region defined through the requirements
, , and ,
after all the selection criteria are applied,
and are shown separately for (first and third columns) and (second and last column) decays.
For and decays the variables and are interchanged.
The contours (solid red lines) represent the kinematical limits of the decay.
Table 1:
Summary of the main contributions to the experimental systematic error on the parameters.
All contributions have been evaluated using the same procedure as in our previous analysis ref:babar_dalitzpub2008 .
The statistical contribution to the total error has been decreased, as consequence of the use of larger data and Monte Carlo (with full detector simulation) samples.
For example, larger simulated continuum samples help to significantly reduce the uncertainty arising from the modeling of the DP distributions for
background events containing misreconstructed mesons.
Source
, , shapes
0.001
0.001
0.001
0.001
0.004
0.006
0.008
0.004
0.006
0.003
0.004
0.002
Real fractions
0.002
0.001
0.001
0.001
0.003
0.003
0.002
0.002
0.004
0.001
0.001
0.001
Charge-flavor correlation
0.003
0.003
0.002
0.001
0.005
0.005
0.008
0.002
0.001
0.001
0.003
0.001
Efficiency in the DP
0.003
0.001
0.003
0.001
0.001
0.001
0.001
0.001
0.003
0.001
0.002
0.001
Background DP distributions
0.005
0.002
0.005
0.003
0.003
0.002
0.004
0.004
0.010
0.004
0.007
0.002
cross-feed
–
–
–
–
0.002
0.003
0.009
0.002
–
–
–
–
violation in and
0.002
0.001
0.001
0.001
0.017
0.001
0.008
0.004
0.017
0.002
0.011
0.001
Non- decays
–
–
–
–
–
–
–
–
0.020
0.026
0.025
0.036
Total experimental
0.007
0.004
0.006
0.004
0.019
0.009
0.017
0.008
0.029
0.027
0.029
0.036
Table 2:
Summary of the main contributions to the decay amplitude model systematic uncertainty on the parameters.
We evaluate the different contributions using a similar, but not identical, procedure to that adopted in our previous analysis ref:babar_dalitzpub2008 .
The reference decay amplitude models and parameters are used to generate 10 data-sized signal samples
of pseudo-experiments of and events, and 10 and signal samples 100 times larger than each measured signal yield in data, with .
The parameters are generated with values in the range found in data.
We then compare experiment-by-experiment the values of and obtained from the fits using the reference amplitude models and a set of
alternative models obtained by repeating the amplitude analyses on the pseudo-experiments with alternative assumptions ref:dmixing-kshh .
This technique, although it requires large computing resources, helps to reduce statistical contributions to the amplitude model uncertainties arising from changes in
sensitivity between alternative models (e.g. alternative K-matrix solutions and P-vector mass dependence in the S-wave parameterization).
A variety of studies using data have been performed to test the consistency of the results using this procedure
with those obtained in our previous analysis, where the alternative models were obtained by repeating the amplitude analyses on data.
Nevertheless, the largest decrease in the amplitude model uncertainty compared to our previous result is a consequence of the improvements in the experimental
analysis of tagged mesons ref:dmixing-kshh , which is reflected in smaller experimental systematic uncertainties on the decay amplitudes
(variations of the reconstruction efficiency across the DP, modeling of the DP distributions for background events containing misreconstructed mesons, mistag rates, etc.),
and thus smaller amplitude model uncertainties on the parameters.
Source
Mass and width of Breit-Wigner’s
0.001
0.001
0.001
0.002
0.001
0.002
0.001
0.002
0.001
0.002
0.001
0.002
S-wave parameterization
0.001
0.001
0.001
0.001
0.001
0.001
0.001
0.002
0.001
0.001
0.001
0.002
S-wave parameterization
0.001
0.004
0.003
0.008
0.001
0.006
0.002
0.004
0.003
0.002
0.003
0.007
Angular dependence
0.001
0.001
0.002
0.001
0.001
0.001
0.001
0.002
0.002
0.001
0.002
0.001
Blatt-Weisskopf radius
0.001
0.001
0.001
0.001
0.001
0.001
0.001
0.001
0.001
0.001
0.002
0.001
Add/remove resonances
0.001
0.001
0.001
0.001
0.001
0.002
0.001
0.001
0.001
0.001
0.001
0.002
DP efficiency
0.003
0.002
0.003
0.001
0.001
0.001
0.001
0.001
0.004
0.002
0.003
0.001
Background DP shape
0.001
0.001
0.001
0.001
0.001
0.001
0.001
0.001
0.001
0.001
0.001
0.001
Mistag rate
0.003
0.003
0.002
0.001
0.001
0.001
0.001
0.001
0.003
0.003
0.001
0.001
Effect of mixing
0.003
0.001
0.003
0.001
0.001
0.001
0.001
0.001
0.003
0.001
0.003
0.001
DP complex amplitudes
0.001
0.001
0.001
0.002
0.001
0.001
0.001
0.002
0.002
0.001
0.001
0.002
Total decay amplitude model
0.006
0.006
0.007
0.009
0.002
0.007
0.003
0.006
0.007
0.006
0.006
0.008
Table 3:
-violating complex parameters
and
as obtained from the fit to and final states separately.
The first error is statistical, the second is the experimental systematic uncertainty and the third is
the systematic uncertainty associated with the decay amplitude models.
These results yield for the weak phase
and
,
respectively.
Real part (%)
Imaginary part (%)
Real part (%)
Imaginary part (%)
Table 4:
Statistical correlation coefficients for the vector of measurements,
(in order) , , , , , , , , , , , ,
as obtained from the fit to and final states (upper panel),
and to (bottom left panel) and (bottom right panel) separately.
Only lower off-diagonal terms are written, in %.
Table 5:
Experimental systematic correlation coefficients for the vector of measurements,
(in order) , , , , , , , , , , , ,
defined as
, where
, with
the vector of best measurements,
for and final states (upper panel),
and (bottom left panel) and (bottom right panel) separately.
Only lower off-diagonal terms are written, in %.
Table 6:
Amplitude model systematic correlation coefficients for the vector of measurements,
(in order) , , , , , , , , , , , ,
defined as previously,
for and final states (upper panel),
and (bottom left panel) and (bottom right panel) separately.
Only lower off-diagonal terms are written, in %.
Figure 4: as a function of (left panel) , , and ,
and (right panel) , , and , for
, , and decays, including statistical and
systematic uncertainties. The dashed (upper) and dotted (lower) horizontal lines
correspond to the one- and two-standard deviation intervals, respectively.
Figure 5: (color online).
Contours at (dark) and (light) 2-dimensional CL in the
(a)(d) , (b)(e) , and (c)(f) planes, corresponding to one- and two-standard deviation regions (statistical only),
for (solid lines) and (dotted lines) decays, from the fit to the signal samples performed separately for
(a)-(c) and (d)-(f) decays. The results from the two subsets are statistically consistent.
Figure 6: (color online).
Contours at (dark) and (light) 2-dimensional CL in the
(a)(c) and (b)(d) planes, corresponding to one- and two-standard deviation regions (statistical only),
for (solid lines) and (dotted lines) decays, from the fit to the control samples
performed separately for (a)(b) and (c)(d) decays.
In this case we expect the and contours close to the origin up to , since and
the experimental resolutions are of the same order.
Deviations from this pattern could be an indication that the DP distributions are not well described by the amplitude models ref:babar_dalitzpub2008 .
The results from all the subsets are consistent with the expectations.
Note the differences in scale when comparing to Fig. 5.