Mid-Infrared Spectral Indicators of Star-Formation and AGN Activity in Normal Galaxies
Abstract
We investigate the use of mid-infrared PAH bands, continuum and emission lines as probes of star-formation and AGN activity in a sample of 100 ‘normal’ and local () galaxies. The MIR spectra were obtained with the Spitzer IRS as part of the Spitzer-SDSS-GALEX Spectroscopic Survey (SSGSS) which includes multi-wavelength photometry from the UV to the FIR and optical spectroscopy. The spectra were decomposed using PAHFIT (Smith et al. 2007), which we find to yield PAH equivalent widths (EW) up to times larger than the commonly used spline methods. Based on correlations between PAH, continuum and emission line properties and optically derived physical properties (gas phase metallicity, radiation field hardness), we revisit the diagnostic diagram relating PAH EWs and [Ne ii]12.8m/[O iv]25.9m and find it more efficient as distinguishing weak AGNs from star-forming galaxies than when spline decompositions are used. The luminosity of individual MIR component (PAH, continuum, Ne and H2 lines) are found to be tightly correlated to the total IR luminosity and can be used to estimate dust attenuation in the UV and in H lines based on energy balance arguments.
California Institute of Technology, MC 278-17, 1200 E. California Boulevard, Pasadena, CA 91125, USA
Institute of Astronomy, University of Cambridge, Madingley Road, Cambridge CB3 0HA, UK
Astronomy Department, Columbia University, 550 W. 120 St., New York, NY 10027,USA
1 Goals
We aim at determining the main source of ionizing radiation and star-formation rate of normal galaxies from MIR spectroscopy.
2 The SSGSS Sample
The Spitzer-SDSS-GALEX Spectroscopic Survey is an IRS survey of 100 local galaxies in the Lockman Hole. The data include GALEX FUV photometry, SDSS optical imaging and spectroscopy, Spitzer IRAC and MIPS photometry. The sample has a surface brightness limit of 0.75 MJy sr-1 at 5.8m and a flux limit of 1.5mJy at 24m. It was selected to cover the range of physical properties of ‘normal’ galaxies (e.g. , , ). The redshifts span with a mean of 0.1 similar to that of the full SDSS spectroscopic sample. Galaxies are classified as star-forming (black dots), composite (pink stars) or AGN (red triangles) according to the boundaries of Kewley et al. (2001) and Kauffmann et al. (2003) on the [N ii]/H versus [O iii]/H “BPT” diagram (Baldwin et al. 1981). First results were reported by O’Dowd et al. (2009).
3 Spectral Decomposition
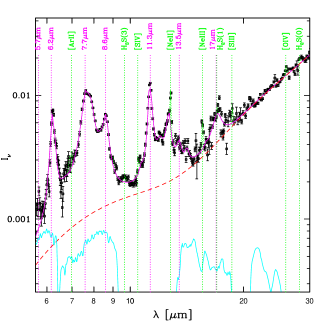
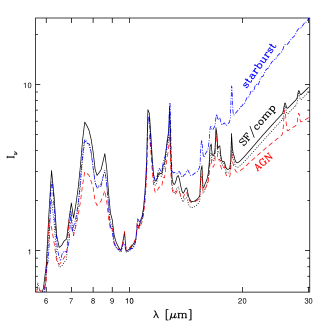
We used PAHFIT (Smith et al. 2007) to decompose the spectra into a sum of dust attenuated thermal dust continuum, PAH features and emission lines. The left panel of Fig. 1 shows an example decomposition for a typical SF galaxy. The right panel shows the mean spectra of SF galaxies, composite galaxies and AGNs along with the average starburst spectrum of Brandl et al. (2006). The transition from starburst to SF galaxy to AGN is marked by a declining continuum slope, decreased [Ne ii]12.8m and [S iii]18.7m emission and enhanced [O iv]25.9m emission. The AGN spectrum, and to a lesser extent the starburst spectrum, show weaker PAH emission at low wavelength than the SF spectrum, an effect attributed to the destruction of PAHs in intense far-UV radiation fields.
4 Conclusions
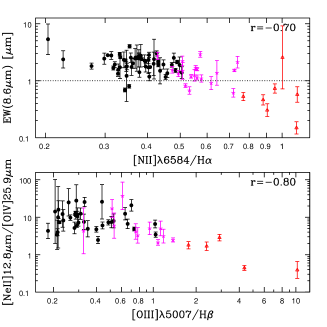
We find systematic trends between MIR spectral properties and optically derived physical properties, in particular
between short wavelength PAH EWs and [N ii]/H (gas phase metallicity), and between [Ne ii]12.8m/[O iv]25.9m versus [O iii]/H (radiation field hardness) (Fig. 2, left panel);
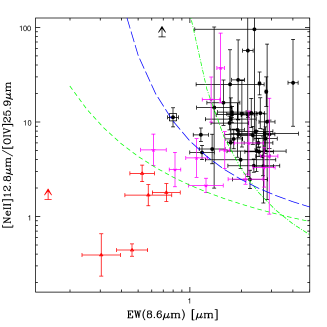
The Genzel et al. (1998) diagram has better resolution using PAHFIT than spline decompositions. It is very similar
to the optical “BPT” diagram (Fig. 2, right panel). The mixed SF/composite region may be revealing obscured AGNs
in a large fraction of optically defined “pure” SF galaxies.
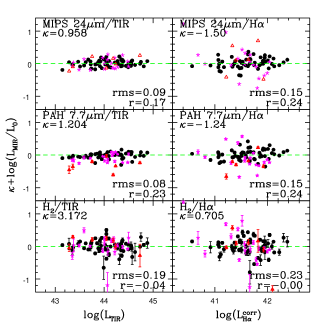
The PAH, continuum, Ne and H2 luminosities are tightly and nearly linearly correlated to the total IR luminosity, less so
to the dust corrected H luminosity (SFR) (Fig. 3, left panel);
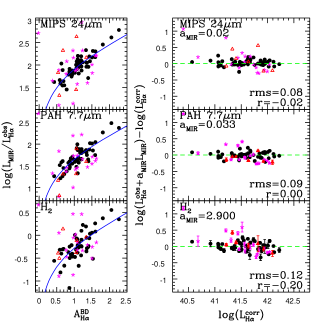
Following Kennicutt et al. (2009), the MIR components can be used to estimate dust attenuation in H and UV based on
energy balance arguments (Fig. 3, right panel).
References
- Baldwin et al. (1981) Baldwin, J. A., Phillips, M. M., & Terlevich, R. 1981, PASP, 93, 5
- Brandl et al. (2006) Brandl, B. R., Bernard-Salas, J., Spoon, H. W. W., Devost, D., Sloan, G. C., Guilles, S., Wu, Y., Houck, J. R., Weedman, D. W., Armus, L., Appleton, P. N., Soifer, B. T., Charmandaris, V., Hao, L., Higdon, J. A. M. S. J., & Herter, T. L. 2006, ApJ, 653, 1129
- Genzel et al. (1998) Genzel, R., Lutz, D., Sturm, E., Egami, E., Kunze, D., Moorwood, A. F. M., Rigopoulou, D., Spoon, H. W. W., Sternberg, A., Tacconi-Garman, L. E., Tacconi, L., & Thatte, N. 1998, ApJ, 498, 579
- Kauffmann et al. (2003) Kauffmann, G., Heckman, T. M., Tremonti, C., Brinchmann, J., Charlot, S., White, S. D. M., Ridgway, S. E., Brinkmann, J., Fukugita, M., Hall, P. B., Ivezić, Ž., Richards, G. T., & Schneider, D. P. 2003, MNRAS, 346, 1055
- Kennicutt et al. (2009) Kennicutt, R. C., Hao, C., Calzetti, D., Moustakas, J., Dale, D. A., Bendo, G., Engelbracht, C. W., Johnson, B. D., & Lee, J. C. 2009, ApJ, 703, 1672
- Kewley et al. (2001) Kewley, L. J., Dopita, M. A., Sutherland, R. S., Heisler, C. A., & Trevena, J. 2001, ApJ, 556, 121
- O’Dowd et al. (2009) O’Dowd, M. J., Schiminovich, D., Johnson, B. D., Treyer, M. A., Martin, C. D., Wyder, T. K., Charlot, S., Heckman, T. M., Martins, L. P., Seibert, M., & van der Hulst, J. M. 2009, ApJ, 705, 885
- Smith et al. (2007) Smith, J. D. T., Draine, B. T., Dale, D. A., Moustakas, J., Kennicutt, Jr., R. C., Helou, G., Armus, L., Roussel, H., Sheth, K., Bendo, G. J., Buckalew, B. A., Calzetti, D., Engelbracht, C. W., Gordon, K. D., Hollenbach, D. J., Li, A., Malhotra, S., Murphy, E. J., & Walter, F. 2007, ApJ, 656, 770