The physical properties of the dust in the RCW 120 H ii region as seen by ††thanks: Herschel is an ESA space observatory with science instruments provided by European-led Principal Investigator consortia and with important participation from NASA.
Abstract
Context. RCW 120 is a well-studied, nearby Galactic H ii region with ongoing star formation in its surroundings. Previous work has shown that it displays a bubble morphology at mid-infrared wavelengths, and has a massive layer of collected neutral material seen at sub-mm wavelengths. Given the well-defined photo-dissociation region (PDR) boundary and collected layer, it is an excellent laboratory to study the “collect and collapse” process of triggered star formation. Using Space Observatory data at 100, 160, 250, 350, and 500 m, in combination with and APEX-LABOCA data, we can for the first time map the entire spectral energy distribution of an H ii region at high angular resolution.
Aims. We seek a better understanding of RCW 120 and its local environment by analysing its dust temperature distribution. Additionally, we wish to understand how the dust emissivity index, , is related to the dust temperature.
Methods. We determine dust temperatures in selected regions of the RCW 120 field by fitting their spectral energy distribution (SED), derived using aperture photometry. Additionally, we fit the SED extracted from a grid of positions to create a temperature map.
Results. We find a gradient in dust temperature, ranging from K in the interior of RCW 120, to K for the material collected in the PDR, to K toward local infrared dark clouds and cold filaments. There is an additional, hotter ( K) component to the dust emission that we do not investigate here. Our results suggest that RCW 120 is in the process of destroying the PDR delineating its bubble morphology. The leaked radiation from its interior may influence the creation of the next generation of stars. We find support for an anti-correlation between the fitted temperature and , in rough agreement with what has been found previously. The extended wavelength coverage of the data greatly increases the reliability of this result.
Key Words.:
stars: formation - ISM: dust - ISM: Hii Regions - ISM: individual (RCW120) - ISM: photon-dominated region (PDR) - Infrared: ISM1 Introduction
RCW 120 (Rodgers et al. 1960) is a Galactic H ii region that displays a ring morphology at mid-infrared and sub-mm wavelengths, and is presumably a bubble viewed in projection. It has recently been studied by Zavagno et al. (2007, hereafter ZA07) and Deharveng et al. (2009, hereafter DE09) in the context of triggered star formation. It is only 1.3 kpc from the Sun (see ZA07, and references therein), and is thus one of the closest Galactic H ii regions.
ZA07 analysed the 1.2 mm emission of RCW 120 and found a fragmented layer of neutral material adjacent to the photo-dissociation region (PDR). They identified eight millimeter condensations, five of which lie in the collected layer of material, but found no massive young stellar objects (YSOs) within the condensations. They did, however, locate numerous YSOs surrounding RCW 120, indicating that star formation is active in the region. Using APEX-LABOCA observations at 870 m, and Spitzer-MIPS observations at 24 m, DE09 extended this work and calculated column densities and masses for the sub-mm condensations (plus an additional condensation, #9). They found additional YSOs in the field, including a chain of 11 evenly-spaced YSOs inside the most massive condensation and a very dense core harboring a (possibly class 0) YSO. This work highlights the impact RCW 120 is having on star formation far from the ionizing source. An analysis of the YSOs in the RCW 120 field using the Herschel data presented here is given in a companion paper (Zavagno et al. 2010).
The ring morphology shown by RCW 120 is a common feature of Galactic H ii regions; Churchwell et al. (2006, 2007) identified almost 600 such objects in the Spitzer-GLIMPSE data (Benjamin et al. 2003). Deharveng et al. (2010) have shown that over 85% of infrared (IR) bubbles enclose H ii regions. Because of their morphology, it is easy to locate the PDRs of such bubbles and one can more easily identify the swept-up material that is necessary for the collect and collapse process (Elmegreen & Lada 1977). These objects present an opportunity to assess the efficiency of triggered star formation throughout the entire Galaxy. Data from the Herschel telescope (Pilbratt 2010) allow us for the first time to map the dust temperature variations over an entire H ii region at high resolution. We can thus better determine the effect H ii regions have on the creation of the next generation of stars.
2 Data
RCW 120 was observed by the Herschel telescope on 9 October 2009 with the PACS (Poglitsch 2010) and SPIRE (Griffin 2010) as part of, respectively, the HOBYS (Motte 2010) and “Evolution of Interstellar Dust” (Abergel 2010) guaranteed time key programs. Data were taken in five wavelength bands: 100 and 160 m for PACS (at resolutions of and and a final map size of ), and 250, 350, and 500 m for SPIRE (at resolutions of , , and and a final map size of ). We reduced these data using HIPE version 2.0. The SPIRE images used here are level 2 products, produced by the SPIRE photometer pipeline. We reduced the PACS data using a script provided by M. Sauvage. Recent calibration changes for the PACS and SPIRE data were taken into account (Swinyard et al. 2010); throughout we use calibration uncertainties of 10% and 20% respectively for the PACS 100 m and 160 m bands, and 15% for all three SPIRE bands (Swinyard et al. 2010).
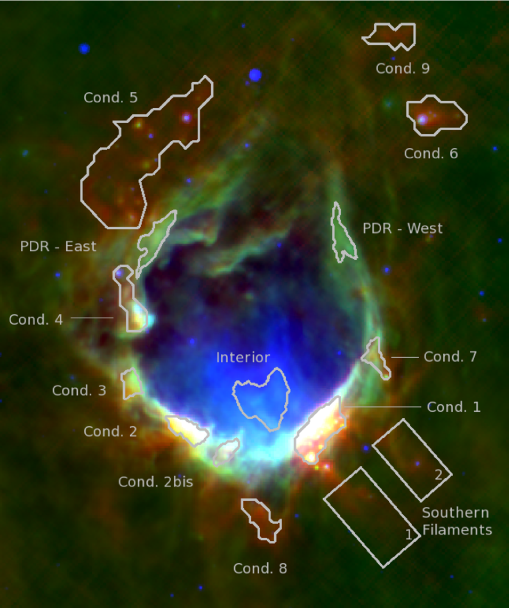
We also utilize Spitzer-MIPSGAL data (Carey et al. 2009) at 24 m and 70 m (at resolutions of and ), and APEX-LABOCA data at 870 m from D09 (at a resolution of ). The MIPSGAL 70 m maps have strong striping that we mediate with median filtering of the scan-legs (see Gordon et al. 2007). In Fig. 1 we show a three-color image with SPIRE 250 m (red), PACS 100 m (green), and MIPSGAL 24 m data (blue). Regions of interest are superimposed on the data; the condensation numbers are from ZA07 and DE09.
3 Dust properties
We assume the dust emission in RCW 120 can be modeled by an optically thin grey-body, and that the emissivity of the dust grains can be fitted with a power law (Hildebrand 1983):
| (1) |
where is the measured flux density at frequency , is the observing beam solid angle, is the Planck function for temperature at frequency , is the dust opacity, is the dust emissivity index, and is the dust column density. Each line of sight has variations in the dust temperature and emissivity; the derived temperatures and emissivities therefore represent average values, weighted by the strongest emitting components.
There has been much discussion about the value of the dust emissivity index, , and whether its value is anti-correlated with the dust temperature, . Generally, is thought to range from 1 to 2, but may also vary with wavelength (Meny et al. 2007). Dupac et al. (2003) found that and are inversely related. Désert et al. (2008) found a similar inverse-relation to exclude a constant value of at the 99.9% confidence level. Shetty et al. (2009a, b), however, suggested that this relationship arises due to the influence of noise in a least-squares fit of Eq. 1, and from the combination of multiple emission components along the line of sight. A correlation between and may indicate a change in dust properties at high density (Stepnik et al. 2003).
3.1 Aperture photometry
To determine the dust temperature structure of RCW 120, we performed aperture photometry measurements on selected areas in the RCW 120 field. We resampled all images to the resolution of the MIPSGAL 24 m data to avoid pixel edge effects. There are three different areas of interest in the field of RCW 120: the interior of the bubble, the PDR (including condensations), and local infrared dark clouds (IRDCs) that appear in emission at the PACS and SPIRE wavelengths. The apertures we used are shown in Fig. 1. For each aperture, we selected a nearby background aperture that best characterizes the local background emission.
For all apertures, we fit a single temperature to the coldest emission component of the spectral energy distribution (SED) using a non-linear least squares routine in two trials: once with , and once with allowed to vary. For all apertures, the 24 m emission is significantly greater than what would be predicted by a single, cold temperature. This hotter component, likely caused in part by transiently heated small grains, is not well-constrained by the available data and therefore we ignore it in the present work. We also exclude the 70 m data point (and sometimes the 100 m data point) if it is inconsistent with the emission from a single, cold temperature component. We leave the column density as a free parameter.
| Name | (K) | (K) | |
|---|---|---|---|
| free | |||
| Interior | |||
| PDR - West | |||
| PDR - East | |||
| Cond. 1 | |||
| Cond. 2 | |||
| Cond. 3 | |||
| Cond. 4 | |||
| Cond. 5 (IRDC) | |||
| Cond. 6 (IRDC) | |||
| Cond. 7 | |||
| Cond. 8 | |||
| Cond. 9 (IRDC) | |||
| Cond. 10 | |||
| Southern Filaments 1 | |||
| Southern Filaments 2 | |||
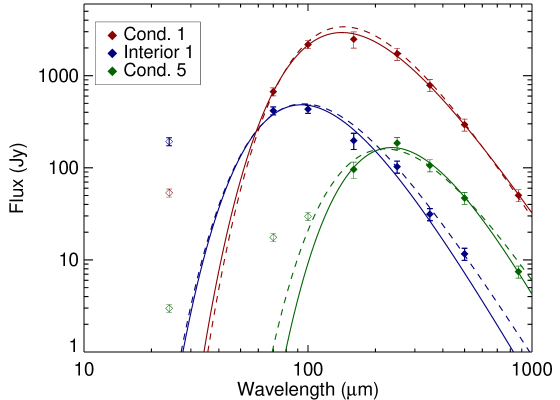
The results of our aperture photometry are shown in Table 1, and examples of the SED fits are shown in Fig. 2. Uncertainties listed in Table 1 are the formal values, taking into account uncertainties in the photometry measurements and calibration uncertainties. The direction of the interior of RCW 120 has dust temperatures of . This result is rather uncertain, however, because of the lack of emission above the background level in the interior of RCW 120 at wavelengths m. The lack of emission at long wavelengths is evidence for a flattened, two dimensional ring instead of a bubble, as suggested by Beaumont & Williams (2010). The condensations and PDR have characteristic temperatures of K and the IRDCs have temperatures of K, on the low end of the temperature distribution for IRDCs found by Peretto (2010). The temperatures change little in the two trials. Uncertainties in temperature are small (often ), and errors in are generally 10%.
The and values, together with the empirically derived curves of Dupac et al. (2003) and Désert et al. (2008), are shown in Fig. 3. Figure 3 clearly shows two - groups, one for the PDR (and the condensations along the PDR) at , and one for dark clouds and cold filaments at . We find an anti-correlation between and the dust temperature. Fitting a regression line of the same functional form as that of Désert et al. (2008) reveals:
| (2) |
The functional form of the relationship given in Dupac et al. (2003) does not fit our data. While these data do support the relationship, this result should be interpreted with caution because the calibration for the Herschel instruments is not yet finalized. Also, the fits to many of the cold filaments are consistent with a value of two. For example, the fit for Condensation #5 is also acceptable as it falls roughly within the formal errors (see Fig. 2).

3.2 Temperature map
While aperture photometry is well-suited for investigating the average dust properties of small areas in the field of RCW 120, a higher resolution map of dust temperature is useful for determining the small-scale variations in dust properties. To construct such a temperature map, we fit the SED extracted at each pixel with a single-temperature grey-body model (Eq. 1), again leaving the column density as a free parameter. Schnee et al. (2007) showed that when attempting to simultaneously constrain and , uncertainties in the derived parameters can be very large due to the effect of noise in the data. We find that this is indeed the case and therefore in the following we fix to a value of two, which is valid for most areas of the map (see Table 1).
Fitting the SED of each pixel requires matching the resolution and pixel locations of all wavelengths to those of the lowest resolution image. The SPIRE 500 m data point has little impact on the derived fit parameters because we have higher-resolution data at 870 m; we exclude the 500 m data point so we can rebin to the higher resolution of the SPIRE 350 m data instead. We smooth all images with a two-dimensional Gaussian representing the SPIRE beam at 350 m, and rebin to the 350 m resolution using Montage111http://montage.ipac.caltech.edu/. We subtract an average background value from the data at all wavelengths, estimated from a field nearly devoid of emission. For all but the coldest dust, the Spitzer 70 m data point is dominated by emission from the cold component; we use this data point in the SED fits here. The inclusion of these data, however, causes the fitted temperature to be overestimated in very cold regions (see fits in Fig. 2).
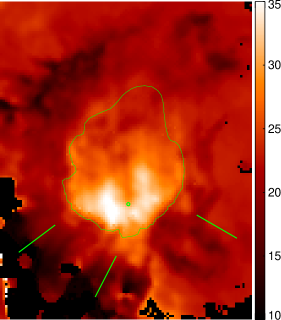
The temperature map is shown in Fig. 4, for the same area shown in Fig. 1. We find the same results found with the aperture photometry method: the interior of RCW 120 is K the PDR is K, and the dark clouds are K. The highest temperatures (up to K) are found toward the southern edge of the bubble, surrounding the location of the main ionizing star. Errors in the derived temperatures for individual pixels are generally . The exact location of the ionizing source is devoid of hot dust, an effect that may be caused by the action of stellar winds. We note, however, that the ionizing star of RCW120 has been found to have relatively weak winds (Martins et al. 2010).
The action of the ionized material appears to be creating openings in the PDR in several locations, shown with green lines in Fig. 4. These openings can also be seen in Fig. 1. There appears to be dust that is hotter by K outside the PDR at these locations, heated by radiation leaking through the holes in the PDR. This higher temperature dust may lead to the collapse of future generations of stars as it interacts with local molecular material outside the PDR. For the opening due south, this effect may have aided the creation of the sources inside Condensation #8 seen in Fig. 1; the directions of the other openings show no indication of increased star-formation activity.
There are a number of cold filaments in the field of RCW 120 that have dust temperatures of K. All such cold filaments appear bright at wavelengths m and therefore appear red in Fig. 1. These filaments are associated with IRDCs seen in Spitzer 8.0 m data. The most obvious cold patches in the field are from the IRDCs to the north, but there are numerous, thin filaments throughout the field. A number of cold filaments are oriented radially away from RCW 120, the coldest of which are towards the south-west. We suggest that these southern filaments are shaped by radiation from RCW 120 leaving the ionized region. We suggest that the boundary of RCW 120 does not entrap all the emission; where the radiation leaks out, the filaments are compressed into the radial segments we see. In the direction of large condensations, the radiation is confined to the bubble area.
4 Conclusions
We have analysed the dust properties of the nearby bubble H ii region RCW 120 using aperture photometry and temperature maps of Herschel, Spitzer, and APEX-LABOCA data. We have found a gradient of dust temperature, from K for local infrared dark clouds, to K for the PDR (including sub-mm) condensations, to for the interior of the bubble.
Our results show support for a power-law form of the anti-correlation between the dust temperature and the dust emissivity index , in good agreement with Désert et al. (2008). Because of the range of temperatures found in a small spatial area, presumably all at the same distance only 1.3 kpc from the Sun, RCW 120 is an ideal location to test for the relationship. With the wavelength coverage of Herschel, we are able to simultaneously constrain and for regions of cold dust.
The temperature map of the RCW 120 field reveals numerous locations in the PDR where radiation appears to be leaking into the surrounding interstellar medium. This implies that RCW 120 is in the process of fragmenting its nearly complete PDR layer. As the radiation leaves the confined environment, the radiation pressure shapes local cold filaments and may aid in collapsing local condensations outside the ionization front.
Acknowledgements.
Part of this work was supported by the ANR (Agence Nationale pour la Recherche) project “PROBeS”, number ANR-08-BLAN-0241. PACS has been developed by a consortium of institutes led by MPE (Germany) and including UVIE (Austria); KUL, CSL, IMEC (Belgium); CEA, LAM (France); MPIA (Germany); IFSI, OAP/AOT, OAA/CAISMI, LENS, SISSA (Italy); IAC (Spain). This development has been supported by the funding agencies BMVIT (Austria), ESA-PRODEX (Belgium), CEA/CNES (France), DLR (Germany), ASI (Italy), and CICT/MCT (Spain). SPIRE has been developed by a consortium of institutes led by Cardiff Univ. (UK) and including Univ. Lethbridge (Canada); NAOC (China); CEA, LAM (France); IFSI, Univ. Padua (Italy); IAC (Spain); Stockholm Observatory (Sweden); Imperial College London, RAL, UCL-MSSL, UKATC, Univ. Sussex (UK); Caltech, JPL, NHSC, Univ. Colorado (USA). This development has been supported by national funding agencies: CSA (Canada); NAOC (China); CEA, CNES, CNRS (France); ASI (Italy); MCINN (Spain); SNSB (Sweden); STFC (UK); and NASA (USA).References
- Abergel (2010) Abergel, A. 2010, this Volume
- Beaumont & Williams (2010) Beaumont, C. N. & Williams, J. P. 2010, ApJ, 709, 791
- Benjamin et al. (2003) Benjamin, R. A., Churchwell, E., Babler, B. L., et al. 2003, PASP, 115, 953
- Carey et al. (2009) Carey, S. J., Noriega-Crespo, A., Mizuno, D. R., et al. 2009, PASP, 121, 76
- Churchwell et al. (2006) Churchwell, E., Povich, M. S., Allen, D., et al. 2006, ApJ, 649, 759
- Churchwell et al. (2007) Churchwell, E., Watson, D. F., Povich, M. S., et al. 2007, ApJ, 670, 428
- Deharveng et al. (2010) Deharveng, L., Schuller, F., Anderson, L., et al. 2010, A&A, submitted
- Deharveng et al. (2009) Deharveng, L., Zavagno, A., Schuller, F., et al. 2009, A&A, 496, 177
- Désert et al. (2008) Désert, F., Macías-Pérez, J. F., Mayet, F., et al. 2008, A&A, 481, 411
- Dupac et al. (2003) Dupac, X., Bernard, J., Boudet, N., et al. 2003, A&A, 404, L11
- Elmegreen & Lada (1977) Elmegreen, B. G. & Lada, C. J. 1977, ApJ, 214, 725
- Gordon et al. (2007) Gordon, K. D., Engelbracht, C. W., Fadda, D., et al. 2007, PASP, 119, 1019
- Griffin (2010) Griffin. 2010, this Volume
- Hildebrand (1983) Hildebrand, R. H. 1983, QJRAS, 24, 267
- Martins et al. (2010) Martins, F., Pomarès, M., Deharveng, L., Zavagno, A., & Bouret, J. C. 2010, A&A, 510, A32+
- Meny et al. (2007) Meny, C., Gromov, V., Boudet, N., et al. 2007, A&A, 468, 171
- Motte (2010) Motte, F. 2010, this Volume
- Peretto (2010) Peretto, N. 2010, this Volume
- Pilbratt (2010) Pilbratt. 2010, this Volume
- Poglitsch (2010) Poglitsch. 2010, this Volume
- Rodgers et al. (1960) Rodgers, A. W., Campbell, C. T., & Whiteoak, J. B. 1960, MNRAS, 121, 103
- Schnee et al. (2007) Schnee, S., Kauffmann, J., Goodman, A., & Bertoldi, F. 2007, ApJ, 657, 838
- Shetty et al. (2009a) Shetty, R., Kauffmann, J., Schnee, S., & Goodman, A. A. 2009a, ApJ, 696, 676
- Shetty et al. (2009b) Shetty, R., Kauffmann, J., Schnee, S., Goodman, A. A., & Ercolano, B. 2009b, ApJ, 696, 2234
- Stepnik et al. (2003) Stepnik, B., Abergel, A., Bernard, J., et al. 2003, A&A, 398, 551
- Swinyard et al. (2010) Swinyard, Ade, & Baluteau. 2010, this Volume
- Zavagno et al. (2007) Zavagno, A., Pomarès, M., Deharveng, L., et al. 2007, A&A, 472, 835
- Zavagno et al. (2010) Zavagno, A., Russeil, D., & Motte, F. 2010, this Volume