deep far-infrared counts through Abell 2218 cluster-lens
Gravitational lensing by massive galaxy clusters allows study of the population of intrinsically faint infrared galaxies that lie below the sensitivity and confusion limits of current infrared and submillimeter telescopes. We present ultra-deep PACS 100 and 160 m observations toward the cluster lens Abell 2218 to penetrate the confusion limit. We derive source counts down to a flux density of 1 mJy at 100 m and 2 mJy at 160 m, aided by strong gravitational lensing. At these levels, source densities are 20 and 10 beams/source in the two bands, approaching source density confusion at 160 m. The slope of the counts below the turnover of the Euclidean-normalized differential curve is constrained in both bands and is consistent with most of the recent backwards evolutionary models. By integrating number counts over the flux range accessed by Abell 2218 lensing ( mJy at 100 m and mJy at 160 m), we retrieve a cosmic infrared background surface brightness of 8.0 and 9.9 nW m-2 sr-1, in the respective bands. These values correspond to % and % of DIRBE direct measurements. Combining Abell 2218 results with wider/shallower fields, these figures increase to % and % CIB total fractions, resolved at 100 and 160 m, disregarding the high uncertainties of DIRBE absolute values.
Key Words.:
Surveys – Infrared: galaxies – Galaxies: evolution – Galaxies: high-redshift – clusters: general – Gravitational lensing: strong1 Introduction
The discovery of the cosmic infrared background (CIB) (Puget et al. 1996; Fixsen et al. 1996; Lagache et al. 1999) has opened new perspectives on galaxy formation and evolution. A large number of the sources contributing to this far-infrared (FIR) CIB have been resolved in the mid-infrared (mid-IR) at 15 m with the ISOCAM instrument on ISO (Genzel & Cesarsky 2000; Elbaz et al. 2002), and later at 24m with MIPS on Spitzer (Papovich et al. 2004; Dole et al. 2004; Frayer et al. 2006). A striking result concerns the evolution of the infrared and submillimeter (sub-mm) galaxy population: the infrared source counts are higher than no-evolution or moderate-evolution models and provide strong constraints on the evolution of the bolometric energy output from distant galaxy populations.
However, at FIR and sub-mm wavelengths, a much lower fraction has been resolved so far, because of the small aperture of telescopes, the prohibitive confusion limits, and the low sensitivity of available instruments. Nevertheless, stacking results (Dole et al. 2006) show that most or all of the FIR background is due to known high-z IR galaxies.
The Herschel Space Observatorys (Pilbratt et al. 2010) compact point-spread-function (PSF) enables probes of the FIR emission of large samples of galaxies near their spectral energy distribution (SED) peak, over a wide z range. The sensitive Photometer Array Camera & Spectrometer (PACS) (Poglitsch et al. 2010) achieves imaging surveys of unrivalled depth at 70, 100, and 160 m in the PEP (PACS Extragalactic Probe) Key Program (PI D. Lutz).
As pioneered by Smail et al. (1997) in the sub-mm, and later in the mid-IR (Altieri et al. 1999; Metcalfe et al. 2003), we are conducting a survey toward massive clusters as part of PEP, to resolve the FIR beyond the field-survey limit and penetrate the confusion limit with powerful gravitational lenses. This letter reports initial observations on the cluster Abell 2218.
2 Observations
The rich and massive lensing cluster Abell 2218 was targeted in the PEP science demonstration phase. This field has been intensively studied, including deep archival Hubble Space Telescope (HST)/ACS and Spitzer (IRAC & MIPS) observations, which allow simple and direct identification of the sources detected with /PACS.
Our 13 hours of observations, centered on the cD galaxy at RA=16h35m51.84s, Dec=62d14m19.2s (J2000), used scan mapping (20′′/s scan speed; 4′ scan leg length; 20′′ cross-scan steps) over an area of about 6′x6′, with coverage strongly peaked toward the center. Though affected by relatively high overheads (reduced later in the mission), they are the deepest observations so far at 100 and 160 m.
3 Data analysis
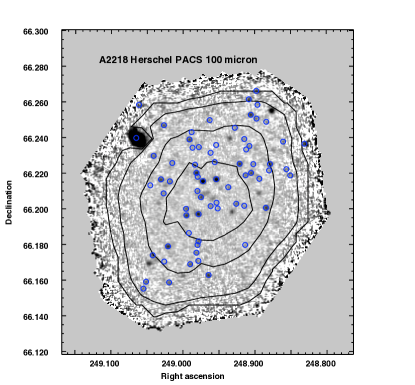
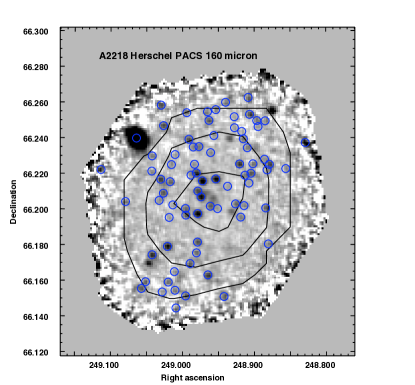
The data were reduced using HIPE (Ott et al. 2010) v2.0. build 1328. The 10 Hz data cubes were processed with the standard PACS pipeline, along with custom procedures: 1) to remove interference patterns, transients from calibration blocks and tracking anomalies, 2) to perform re-centering of positional offsets. Moreover, to remove detector drifts and noise, a sliding high-pass filter was run on the pixel timelines with an iterative masking of the brighter sources. For more information, refer to Berta et al. (2010). Final maps are displayed in Figure 1.
Source extraction was performed with the StarFinder PSF-fitting code (Diolaiti et al. 2000), down to the 3 level. The total number of sources is reported in Table 1. Based on random extractions from the residual images, the averaged 1 noise levels in the maps are 0.92 mJy at 100 m and 1.61 mJy at 160 m.
| 100 m | 160 m | |
| PSF FHWM (arcsec) | 7.5 | 11.0 |
| average sensitivity (mJy) | 0.92 | 1.61 |
| central sensitivity (mJy) | 0.6 | 1.2 |
| number of detected sources () | 98 | 94 |
| number of lensed sources () | 70 | 78 |
| lensed sources with spectroscopic redshift | 9 | 13 |
| lensed sources with photometric redshift | 20 | 17 |
We inspected all sources in the maps by eye. The source catalog was cross-correlated with various redshift surveys for Abell 2218 (LeBorgne et al. 1992; Ziegler et al. 2001; Ebbels et al. 1998; Metcalfe et al. 2003; Kneib, priv. comm.) and with photometric redshifts of the Abell 2218 MIPS 24m sources computed using HST/ACS images, near-IR images and the 4 Spitzer/IRAC bands (Ciesla et al. 2009). All PACS sources were detected in the Spitzer/MIPS observation. This cross-correlation allowed us to classify sources as foreground, cluster, or background galaxies. More than 90% of background sources with confirmed spectroscopic or photometric redshift have , while 11 out of the 13 confirmed cluster galaxies detected both at 100 and 160 m have . This allows classification of sources with , but without redshift, as lensed-background galaxies. This is as also supported by their extremely faint magnitudes in the optical and/or their disturbed morphologies.
Less than 30% (20%) of the sources at 100 m (160 m) are classified as cluster galaxies. This situation is very similar to the mid-IR, where e.g. Altieri et al. (1999); Metcalfe et al. (2003); Egami et al. (2006); Hopwood et al. (2010), showed that the large majority of far-IR sources are background, hence lensed, sources. The cluster core is virtually transparent in the FIR and acts as a natural telescope to provide a magnified view of the background sky. This increases the sensitivity and at the same time reduces the effects of source confusion; in particular, the cD galaxy is undetected in both bands.
Four of the 7 sub-mm sources in the ultra-deep map of Abell 2218 (Knudsen et al. 2006) are detected in the 160 m map, including the triple z=2.516 sub-mm source SMMJ16359+6612 (Kneib et al. 2004a), the sources SMMJ163555.2+661150 at , and SMMJ163541.2+661144 at (Knudsen et al. 2009). However, the highest redshift sub-mm source (z=4.048) SMMJ163555.5+661300 and the two faintest sub-mm sources have not been detected, which is also true for the z=5.56 source of Ellis et al. (2001) and the triple source of Kneib et al. (2004b).
4 Lensing inversion and source counts

Lensing acts in two ways on the background sky: i) it amplifies source brightness, typically by a factor of 2, but by as much as 10 near critical lines; ii) it magnifies the area probed - and both the flux amplification and the space magnification are stronger toward the cluster core and increase with source-plane redshift. We exploited the detailed mass model of Abell 2218 (Kneib et al. 1996, 2004b), which considers 8 multiply imaged systems, of which 7 have spectroscopically confirmed redshifts (among these the several high-z multiply-lensed sources mentioned at the end of Section 3).
We used the publicly available software, LensTool, described in Jullo et al. (2007) to compute the source amplification factors and the surface magnification due to lensing. Where redshifts were not available for sources judged by morphology or intrinsic faintness to be in the background, a value of was assigned, corresponding to the median redshift of field sources having spectroscopic or photometric redshift. This has little impact on the lensing amplification factor and area magnification, as illustrated in Figure 2. This figure shows the area mapped to a given sensitivity in the image plane (i.e. on the apparent sky), compared to the corresponding areas in source planes at redshifts 0.7, 1, 1.5, and 2.5. For redshifts above 0.7, the lensing surface magnification depends only weakly on redshift. The lensing amplification factor for a given source on the other hand may be more sensitive to the redshift. However, setting all (morphologically classified) background sources without known redshift to z=1 (instead of z=0.7) did not change the shape of the counts significantly, because it shifted only a few sources among adjacent flux bins.
Figure 2 expresses the fact that some small, highly-lensed regions of the source plane are mapped onto larger areas in the image plane (the apparent sky), with the result that, over a few arcmin2, flux densities in the range 1 to 3 mJy become accessible by virtue of the lensing effect.
Ten sources (12 apparent sources, including all images of SMM J16359+6612) have lens-corrected fluxes below 3 mJy at 100 m and 13 (15 apparent) below 5.7 mJy at 160 m, with these quoted limits the 3 sensitivities achieved on the GOODS-N field (Berta et al. 2010). Such sources would most likely not be detected even in upcoming deeper blank-field surveys, like GOODS-S (deeper by a factor of 2). The triple source SMM J16359+6612, for instance, is amplified by a factor of 45, in total. It was counted only once, as number counts refer to the source plane.
By correcting for lensing amplification, surface magnification effects, contamination by cluster galaxies, and non-uniform sensitivity of our maps, we can derive number counts at 100 m and 160 m. Because of the non-uniform sensitivity of the maps on the sky and the lensing effect, different areas on the sky are surveyed to different depths in the source plane. The object density per flux bin was computed using gain-dependent surface areas. Incompleteness affects the counts progressively below apparent fluxes of 6 mJy at 100 m and 9 mJy at 160 m. We restricted these counts to 4 detections where the completeness of measurement is typically 80%. This avoids potentially complicated folding of completeness correction with lensing correction, not justified by the relatively small numbers of sources and relatively large statistical error bars associated with these sample counts on a single lensing cluster. A comprehensive completeness analysis will be required when combining the observations of a sample of massive cluster lenses to extract the galaxy number counts below the 1 mJy level.
Our counts are barely affected by confusion at 100 m, with a source density of 20 beams/source in the image plane (for the Lagache et al. 2003 definition of the beam). At 160 m the density is as high as 10 beams/source, with even fewer beams per source in the central area of high-lensing. Hence, the Abell 2218 catalog is affected by source confusion at 160 m (16.7 beams/source from Dole et al. (2003)) and the high density of detected sources prevents the extraction of fainter objects.
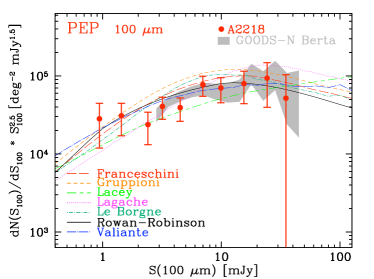
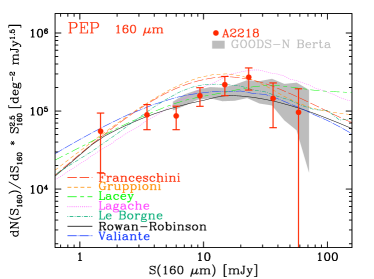
The source counts, corrected for cluster contamination and lensing effects, in both the 100 m and 160 m bands, are presented in Figure 3, normalized to the Euclidean slope (). Error bars consider Poisson statistics only, as flux uncertainties are minimal by comparison.
5 Discussion
The Abell 2218 /PACS maps are the deepest FIR maps to date. Covering an area of arcmin2 over the cluster core, we have surveyed the region where strongly lensed background sources are present. At fluxes higher than 5 mJy, the lens-corrected normalized number counts are consistent, within error bars, with the GOODS-N counts (Berta et al. 2010) showing evidence of a peak between 5-10 and 30 mJy. Thanks to gravitational lensing, we could extend the counts down to 1 mJy at 100 m and 2 mJy at 160 m, confirming the negative sub-Euclidean slope below the turnover.
The Abell 2218 differential counts (not normalized to the Euclidean slope) at 100 m show a faint-end slope similar to GOODS-N, but they are higher at fainter fluxes. At 160 m the differential counts show a steeper slope than GOODS-N ( instead of assuming the functional form of the counts: ). This is also reflected in the Euclidean-normalized counts. The high error bars seen at the faint end come from the poor statistics. The counts could be slightly underestimated at 160 m at the lowest fluxes because the source density is approaching confusion with no correction made for this.
The counts are reproduced well by the models of Valiante et al. (2009) or Rowan-Robinson et al. (2009), both at 100 and 160 m, but other backwards evolutionary models similarly reproduce the downward turn below 10 mJy. The summed contribution of resolved galaxies provides a lower limit to the IR background and can be compared to the estimation of the CIB. Here we have adopted the latest measure of its surface brightness from COBE/DIRBE maps (Dole et al. 2006): nW m-2 sr-1 at 100 m and nW m-2 sr-1 at 160 m (which is an interpolated value).
| flux-range | CIB | d(CIB) | fraction | |
|---|---|---|---|---|
| (mJy) | (nW m-2 sr-1) | (%) | ||
| 100 m A2218 | 0.94-35 | 7.9 | 3.4 | 55 24 |
| 100 m PEP | 0.94-142 | 8.8 | 3.5 | 62 25 |
| 160 m A2218 | 1.47-36 | 9.9 | 3.9 | 77 31 |
| 160 m PEP | 1.47-179 | 11.3 | 4.1 | 88 32 |
The contribution to the CIB by Abell 2218 background galaxies above the 4 detection threshold was computed by simply integrating the observed number counts (Table 2). Errors were computed by integrating the envelope of the counts with their uncertainties. More than half of the DIRBE CIB (Dole et al. 2006) has been directly resolved, which is also consistent with the surface brightness found by Béthermin et al. (2010) in a stacking analysis of Spitzer/MIPS sources.
Combining the deep counts in Abell 2218 with the results obtained by Berta et al (2010) in wider/shallower PEP fields (e.g. COSMOS), we were able to extend the integration flux range to 142 mJy at 100 m and 179 mJy at 160 m. Consequently, the resolved CIB fractions increase to % and % in the two bands. One must keep in mind that not only is the CIB surface brightness from PEP affected by large uncertainties (cosmic variance), but the reference values by Dole et al. (2006) are also defined only within a factor of 2.
Another 9 massive lensing clusters will be targeted as part of PEP and another 40 more in the open-time Lensing Survey KP (Egami et al. 2010). We expect that, in the coming years, combined results from many lensing clusters will greatly improve the statistics of highly amplified sources and constrain source densities around 1 mJy or below. By penetrating below the unlensed confusion limit and probing the high-redshift galaxy populations beyond the sensitivity limit of blank-field surveys, the fraction of the resolved CIB will increase.
Acknowledgements.
PACS has been developed by a consortium of institutes led by MPE (Germany) and including UVIE (Austria); KU Leuven, CSL, IMEC (Belgium); CEA, LAM (France); MPIA (Germany); INAF-IFSI/OAA/OAP/OAT, LENS, SISSA (Italy); IAC (Spain). This development has been supported by the funding agencies BMVIT (Austria), ESA-PRODEX (Belgium), CEA/CNES (France), DLR (Germany), ASI/INAF (Italy), and CICYT/MCYT (Spain).References
- Altieri et al. (1999) Altieri, B., Metcalfe, L., Kneib et al. 1999, A&A, 343, 65
- Berta et al. (2010) Berta, S. et al. 2010, A&A, this volume
- Béthermin et al. (2010) Béthermin, M., Dole, H., Beelen, A. & Aussel, A. 2010, A&A, 512, 78
- Ciesla et al. (2009) Ciesla, L. , 2009, OAMP/LAM report.
- Diolaiti et al. (2000) Diolaiti, E., Bendinelli, O., Bonaccini, D., et al. 2000, A&AS, 147, 335
- Dole et al. (2003) Dole, H., Lagache, G., & Puget, J. 2003, ApJ, 585, 617
- Dole et al. (2004) Dole, H.; Le Floc’h, E., P rez-Gonz lez, P. G.; Papovich, C. et al. 2004, 154, 87
- Dole et al. (2006) Dole, H., Lagache, G., Puget, J.-L. et al. 2006, A&A, 451, 417
- Ebbels et al. (1998) Ebbels, T.; Ellis, R.; Kneib, J.-P.; Le Borgne, J.-F. et al., 1998, MNRAS, 295, 75
- Elbaz et al. (2002) Elbaz, D.; Cesarsky, C. J.; Chanial, P.; Aussel, H. et al. 2002, A&A, 384, 848
- Egami et al. (2006) Egami, E.; Rieke, G. H., Rigby, J. R., Papovich, C. et al. 2006, ASPC, 357, 242
- Egami et al. (2010) Egami, E. et al. 2010, A&A, this volume
- Ellis et al. (2001) Ellis R., Santos M., Kneib J.-P., Kuijken K., 2001, ApJ, 560, L119
- Frayer et al. (2006) Frayer, D. T.; Huynh, M. T.; Chary, R.; Dickinson, M. et al. 2006, ApJ, 647, 9
- Fixsen et al. (1996) Fixsen, D. J.; Cheng, E. S.; Gales, J. M.; Mather, J. C. et al. 1996, ApJ, 473, 576
- Genzel & Cesarsky (2000) Genzel, R., and Cesarsky, C. 2000, A&AR, 38, 761
- Hopwood et al. (2010) Hopwood, R., Serjeant, S., Negrello et al. 2010, ApJ in press, arXiv:1005.1575
- Jullo et al. (2007) Jullo, E.; Kneib, J.-P.; Limousin, M.; Elíasdóttir et al. 2007, NJPh, 9, 447
- Kneib et al. (1996) Kneib, J.-P., et al 1996, ApJ, 471, 643
- Kneib et al. (2004a) Kneib, J.-P.; van der Werf, P.; Knudsen, K. et al. 2004, MNRAS, 349, 1211
- Kneib et al. (2004b) Kneib, J.-P., Ellis, R., Santos, M.R., Richard, J., 2004b, ApJ, 607, 697
- Knudsen et al. (2006) Knudsen, K. K.; Barnard, V. E.; van der Werf et al. 2006, MNRAS, 368, 487
- Knudsen et al. (2009) Knudsen, K. K., Neri, R., Kneib, J.-P., & van der Werf, P. P. 2009, A&A, 496, 45
- Lagache et al. (1999) Lagache, G.; Abergel, A.; Bernard, J.-P. et al. 1999, A&A, 344, 322
- Lagache et al. (2003) Lagache, G.; Dole, H.& Puget, J.-L. 2003, MNRAS, 338, 555
- LeBorgne et al. (1992) Le Borgne, J. F.; Pello, R.; Sanahuja, B. 1992, A&AS, 95, 87
- Metcalfe et al. (2003) Metcalfe, L.; Kneib, J.-P., McBreen, B., Altieri, B. et al. 2003, A&A, 407, 791
- Ott et al. (2010) Ott, S. 2010, ASPCS, ADASS XIX, Mizumoto Y. et al. eds in press
- Papovich et al. (2004) Papovich, C.; Dole, H.; Egami, E.; Le Floc’h, E. et al. 2004, 154, 70
- Pilbratt et al. (2010) Pilbratt G. et al. 2010, A&A, this volume
- Poglitsch et al. (2010) Poglitsch A. et al. 2010, A&A, this volume
- Puget et al. (1996) Puget, J.-P., Abergel, A.; Bernard, J.-P.; Boulanger, F. et al. 1996,A&A, 308, L5
- Rowan-Robinson et al. (2009) Rowan-Robinson, M., et al 2009, MNRAS 394, 117
- Smail et al. (1997) Smail, Ian; Ivison, R. J.; Blain, A. W 1997, ApJ, 490, 5
- Valiante et al. (2009) Valiante, E., Lutz, D., Sturm, E ., Genzel, R. & Chapin, E. 2009, ApJ, 701, 1814
- Ziegler et al. (2001) Ziegler, B.; Bower, R.; Smail, I.; Davies, R.; Lee, D. 2001 MNRAS, 325, 1571