The Stellar Kinematic Center and the True Galactic Nucleus of NGC253111Based on observations at the European Southern Observatory VLT (075.A-0250).
Abstract
We present the first sub-arcsecond resolution two-dimensional stellar kinematics and X-ray observations of the prototypical starburst galaxy NGC253 which define the position and nature of the galactic nucleus. These observations comprise some of the best probes of the central 300 pc of NGC253, the nearest massive galaxy undergoing a powerful starburst, and will allow us to gain more insight into the nature of the centers of starburst galaxies. We get an estimate of the stellar kinematic center location corresponding to an area of centered southwest from the radio core, and historically presumed nucleus, TH2. Newly processed Chandra data reveal a central point-like hard X-ray source (X-1) lying southwest from the kinematic center. Very accurate alignment between radio, infrared and X-ray sources in the nuclear region shows that TH2, the IR photometric center and X-1 are not associated with each other. As the kinematic center is consistent with the positions of TH2 and X-1, and both could be a manifestation of nuclear activity, we consider the two as possible galactic nucleus candidates. Although TH2 is the strongest compact radio source in the nuclear region, it does not have any infrared, optical or X-ray counterparts. If the kinematic center is associated with this source, by analogy we suggest that the nucleus of NGC253 resembles our Galactic Center SgrA∗. On the other hand, X-1 is a heavily absorbed object ( cm-2) only detected at energies keV ( ergs s-1). If X-1 is instead associated with the kinematic center, the nucleus of NGC253 is compatible with an obscured low luminosity active galactic nucleus (AGN) or a spatially resolved super star cluster (SSC) brightening up in X-rays most probably due to young supernovae or supernova remnants, a situation also observed in the nuclear starburst of M82. If no SSC is associated with the kinematic center, we conclude that NGC253 is a galaxy in which a strong starburst and a weak AGN (either TH2 or X-1) coexist. Results from few other high resolution studies of nearby starburst galaxies (e.g. M82, NGC5253, NGC4945) indicate that the AGN in these systems, if present, is always in the low luminosity regime. This may indicate that the onset of nuclear activity in galaxies is closely related with the occurrence of star formation, and that we are witnessing the emergence or dissaperance of an AGN.
1 Introduction
It is observationally well established that star formation in starburst galaxies manifests itself in the production of numerous young massive star clusters of extraordinary luminosity and compactness, normally referred to as super star clusters (SSCs). In fact, the four most luminous circumnuclear starburst systems (M82, M83, NGC253 and NGC4945) account for of the high-mass ( M⊙) star formation within 10 Mpc (Heckman, 1998). Nearby starburst galaxies provide thus a unique laboratory for investigating the mechanisms which cause enhanced star formation to occur and be sustained, as well as physical conditions analogous to intensely star-forming galaxies identified at high-z (e.g. Shapley et al. 2003). An intriguing issue in studies of starburst galaxies is the apparent absence of a well defined nuclear source which could be associated with the center of the galaxy. This situation is present in spatially resolved starbursts in nearby galaxies: e.g. M82 (Matsumoto et al., 2001); NGC4945 (Marconi et al., 2000); NGC5253 (Summers et al., 2004); NGC253 (this work). Massive black holes (BHs) and/or nuclear star clusters (NSCs) are thought to reside in the centers of most galaxies, with the first being mostly identified in massive ellipticals (Richstone et al., 1998; Graham, 2008) and NSCs in irregular and late spirals (e.g. Böker et al. 2002; Seth et al. 2010). Although tens of SSCs exist in the central region of starburst galaxies, the presence of a NSC in these systems is very poorly constrained. Since the central few hundred parsecs of starburst galaxies are heavily affected by large and nonuniform dust extinction, the determination of SSCs properties (age, colors, luminosities, etc.), and thus the detection of a putative NSC, has been difficult and uncertain. The presence of massive BHs in galaxy centers is normally inferred when nuclear activity is observed (Filippenko & Sargent, 1989). Active Galactic Nuclei (AGN) are usually characterized by prominent point sources in -band. Starburst galaxies do not show any IR point-like emission at the position of the assumed galactic nucleus, which in the majority of these systems has been associated to either a powerful compact radio source or a hard X-ray peak. However, in several cases it is not possible to reject/accept the AGN hypothesis on the basis of radio/X-ray emission peaks alone, particularly when the three photometric centers (radio, IR, X-ray) don’t coincide. For the nearest, best studied starbursts, possible galactic center candidates include: young supernovae (SNe), supernova remnants (SNRs), intermediate-mass BHs, inactive supermassive BHs, low-luminosity AGN, etc. (see e.g. Wills et al. 1999 and Stevens et al. 1999 for the case of M82, Marconi et al. 2000 for NGC4945 and Fernández-Ontiveros et al. 2009 for NGC253).
As the center of a galaxy is likely to coincide with the bottom of the galaxy potential well, independent estimates of the kinematic center position from kinematic data can help to determine which photometric center, if any, is the most promising candidate for galactic nucleus. These important dynamical studies had not previously been widely performed because high S/N spectra over a full 2D field with high spatial resolution are required, and these are still scarce. In this paper we provide the first estimate of the kinematic center of the prototypical starburst galaxy NGC253 using sub-arcsecond resolution two-dimensional stellar kinematics. This is combined with data at radio, infrared and X-ray wavelengths to examine the nature of the galactic nucleus itself. These observations comprise some of the best probes of the inner region of NGC253 and will allow us to gain more insight into the nature of the centers of starburst galaxies.
As the nearest massive galaxy experiencing a strong starburst (3.94 Mpc, = 19 pc, Karachentsev et al. 2003), NGC253 is one of the most studied objects in the sky, yet many aspects of its nuclear region remain poorly understood. One of the main unresolved issues is the precise location and physical nature of the center of the galaxy. The galactic nucleus has historically been associated to a powerful compact non-thermal radio source (TH2 in Ulvestad & Antonucci 1997) with characteristics similar to other synchrotron sources in active galaxies (Turner & Ho, 1985): very small size ( mas), high brightness temperature ( K at 15 GHz), and a relatively flat spectral index between GHz(, ). Follow up studies accross the electromagnetic spectrum, each limited by the spatial resolution available at that time, have matched this source with i) H2O maser emission (Nakai et al., 1995), ii) different knots of IR emission (Forbes et al., 2000; Galliano et al., 2005), and iii) the hard X-ray emission peak (Weaver et al., 2002), suggesting that TH2 may be a low luminosity active galactic nucleus (LLAGN). However, it is now apparent from recent high-spatial resolution observations at different wavelengths, and using diverse observational techniques, that this picture may be incorrect. The evidences are the following:
-
•
VLA and VLBA observations at 23 GHz (Brunthaler et al., 2009) have shown that the high velocity H2O maser is not associated with TH2 but with another nearby continuum source (TH4 in Ulvestad & Antonucci 1997), which has been classified as a SNR embedded in an HII region (Lenc & Tingay, 2006). This suggests that a maser-AGN connection is unlikely and that the maser emission is almost surely related to star formation.
- •
-
•
Very accurate alignment at parsec scales has been found between the near-IR and radio sources by means of Adaptive Optics VLT/NACO IR data with a comparable resolution to those in existing VLA radio maps (Fernández-Ontiveros et al., 2009). Surprisingly, this new alignment shows that TH2 has no infrared counterpart. The newly revealed IR nature of TH2 shows no evidence of a central point source that would indicate nuclear activity. However, the non-detection of IR emission does not rule out other scenarios such as the existence of an inactive supermassive black hole (SMBH) like Sgr A∗ (Fernández-Ontiveros et al., 2009; Brunthaler et al., 2009).
In addition, one needs to be cautious when associating the hard X-ray peak to TH2. It is well known that NGC253 harbors compact radio sources (Ulvestad & Antonucci, 1997) and near-infrared point-like sources (Fernández-Ontiveros et al., 2009). This significant change in morphology with wavelength has led to different registrations in the literature (see e.g. Galliano et al. 2005 and references herein). Since Chandra data were processed with pixel -1 resulting in resolution and have an astrometric accuracy of rms, the hard X-ray peak could be associated with several other discrete sources in the field. This is demonstrated in Figure 2 of Weaver et al. (2002) where a variety of IR and radio sources are contained within the size of the hard X-ray peak. Moreover, these authors followed the alignment proposed by Forbes et al. (2000) which, in light of the current high spatial resolution NACO images presented in Fernández-Ontiveros et al. (2009), seems to be incorrect. Thus, it is still a topic of active investigation whether TH2 harbors an AGN, or even if it corresponds to the galactic center, or not.
Based on the alignment proposed by Fernández-Ontiveros et al. (2009) one could point to the infrared photometric center (or IR peak) as possible AGN candidate. The IR peak lies SW from TH2. It is in fact the brightest source at infrared wavelengths (m) and emits of the galaxy’s bolometric flux (Mohan et al., 2002). The spatial distribution of the 3.3 m polycyclic aromatic hydrocarbons (PAH) feature-to-continuum ratio reaches a local minimum in this region (Tacconi-Garman et al., 2005). This indicates that the source produces strong ionization, probably destroying the PAH molecules by photo-dissociation. Supporting this interpretation is the fact that multiband tracers of ionized gas such as Pa, Br, [HeI] and [NeII] are seen to peak strongly at this position (Böker et al., 1998; Engelbracht et al., 1998; Keto et al., 1999; Forbes et al., 2000; Tacconi-Garman, 2006). In addition, the IR peak has an individual counterpart at radio wavelengths (TH7 in Ulvestad & Antonucci 1997) which also presents a relatively flat spectrum between GHz (, ), but it is times fainter than TH2. Moreover, this strong IR source is located at the vertex of the rather collimated ionised-gas region seen in NGC253 (see Figure 8 of Tacconi-Garman et al. 2005). All these characteristics make this object unique among the other sources in the central region of the galaxy and could be explained either by invoking a very young SSC or an AGN.
NGC253 has been the subject of many detailed kinematical studies of its gaseous components. Optical rotation curves of the ionized gas have shown that, in addition to ordered rotation, large non-circular motions exist within the central region (Ulrich, 1978; Muñoz-Tuñon et al., 1993; Arnaboldi et al., 1995). However, because of problems of obscuration at optical wavelengths, results from H and [N II] observations are difficult to interpret. In addition, HI and H rotation curves are incomplete: either they cover the outer parts (Pence, 1980), or they are confined to the innermost regions where peculiar features and asymmetries in the ionized gas are dominant. Most of the optical and IR observations, aimed at studying the kinematics of the molecular gas in the nuclear region of NGC 253 (e.g., Prada et al. 1996; Engelbracht et al. 1998), have relied on measuring the velocity gradients along chosen position angles passing through the nucleus (e.g., major axis and minor axis). Interferometric radio observations at millimeter and centimeter wavelengths measure two-dimensional velocity fields which provide a more complete picture of the kinematics in the nuclear region. Several radio observations in molecular emission lines such as CO (Mauersberger et al., 1996; Canzian, Mundy & Scoville, 1988; Das et al., 2001; Paglione et al., 2004), CS (Peng et al., 1996), HCN (Paglione et al., 1995), or in hydrogen recombination lines (Anantharamaiah & Goss, 1996) exist in the literature. These two-dimensional measurements reveal a complex but systematic velocity pattern in the central region. In addition to solid-body rotation, the observed velocity fields indicate motions which may be due to a barlike potential in the center (Peng et al., 1996) or a kinematic subsystem which may be caused by a past merger event (Anantharamaiah & Goss 1996). Although most of these observations have high spectral resolution, they typically have poor spatial resolution and are not always useful for probing the dynamics very close to the nucleus.
Because of this situation, different authors assumed different centers for their rotation curves/velocity maps: either the center is derived assuming complete symmetry of the outer parts in their fields of view, or it is coincident with the IR peak, or with the radio core TH2, or with the surface brightness peak. The highest resolution measurement of the two-dimensional velocity field available to date is that of Anantharamaiah & Goss (1996), who observed the H92 recombination line with a beam of and a velocity resolution of 54 km s-1. After trying several positions near the H92 emission peak, the optimum center of the velocity field was found to be at (, )2000 = , ( error ), which is southwest of the H92 line peak which in turn is coincident with TH2. This means that the most accurate estimate of the kinematic center based on gas kinematics available to date lies closer to the IR peak () than to TH2.
However, kinematic studies of galaxies focused on the gaseous component (ionized and/or molecular gas) have the potential for revealing the dynamical forces that work in the gas closer to the galactic nucleus, but they cannot trace adequately the gravitational potential. The gas represents only a fraction of the total mass of the galaxy and could be driven by non-gravitational perturbations such as interactions, warps, bars, etc. Therefore, the kinematic parameters of any nuclear galactic disk (center, position angle and inclination) can be greatly influenced by these perturbations. Thus the velocity field of stars is needed to properly trace the gravitational potential.
Integral-field spectroscopy is an ideal tool for studying objects with complex morphologies and kinematics, such as the nuclei of starburst galaxies. This paper is the first of two describing the conclusions from an integral-field spectroscopic study with SINFONI on the VLT to clarify the structure, kinematics and emission mechanisms of the central 150 pc starburst region of NGC253. In this part we use the CO stellar absorption features in band to determine the stellar kinematic center of the galaxy. The stellar CO features have the advantage that they trace a component of the galaxy nucleus that is not affected by non-gravitational processes such as shocks or winds. We also obtained archival Chandra data and re-processed them using pixel-1. The X-ray images are carefully compared with available high spatial resolution radio and near-IR data. This multiwavelength approach combined with the estimate of the kinematic center is essential to find the true nucleus of NGC253. In a forthcoming publication (Müller-Sánchez et al., 2010b) we investigate the physical properties and kinematics of the super star clusters and the molecular and ionized gas in the nuclear starburst.
This paper is structured as follows. In Section 2, we describe the SINFONI and Chandra observations and the processing we performed on the data. The method used to extract the kinematics from the SINFONI spectral features is presented in this Section as well as the new X-ray images and spectra. In Section 3 we examine the stellar velocity field and obtain an estimate of the position of the kinematic center. We discuss the implications of our results for the nature of the galactic nucleus in Section 4. The overall conclusions of the study are outlined in Section 5.
2 Data Analysis and Results
2.1 Near-IR SINFONI data
2.1.1 Observations and data reduction
The SINFONI instrument on the VLT (Bonnet et al., 2004; Eisenhauer et al., 2003) was used without the adaptive optics module, resulting in slice widths of , a pixel scale of pixel-1, and a field of view of . Due to the high-inclination of the galaxy (), this field size is not enough to cover the diameter of the circumnuclear starburst regions under study, hence mosaicing was necessary. To cover the central along the photometric major axis, 8 different pointings were performed and the raw data were obtained from the ESO archive. The individual frames were combined to form a mosaic that was used for analysis. The SINFONI mosaic has a dimension of and is centered at the position of the presumed galactic nucleus, TH2.
The SINFONI data presented here were taken in -band (1.9–2.4 m) on the night of 28 August 2005 in 18 individual frames of 300s resulting in 1.5h total integration time. In this night the atmospheric conditions were excellent (seeing ), which allows us to obtain a resolution of 0.5 as measured from the FWHM of the smallest knot of emission in -band. The FWHM spectral resolution is 68 km s-1 (R4400). The data were reduced using the SINFONI custom reduction package SPRED (Abuter et al., 2005). This performs all the usual steps needed to reduce near infrared spectra, but with the additional routines for reconstructing the data cube. Flux calibration was performed using a standard star observed next in time to the science frames, which yielded in a 0.5 aperture centered at the near-IR emission peak a -band magnitude of 12.34. In addition, flux calibration was cross-checked with NACO data in a similar aperture (Fernández-Ontiveros et al., 2009). Agreement between the different data sources was consistent to 15%.
2.1.2 Spectral fitting
The shape of the CO absorption bandheads in a galaxy spectrum arises from the intrinsic spectral profile of the stars themselves convolved with a broadening profile which carries the information about the kinematics. The use of template stars allows one to separate these two components. We have extracted the 2D properties of the CO absorption features by fitting a Gaussian convolved with a template stellar spectrum to the continuum-subtracted spectral profile of the CO bandheads at each spatial pixel in the data cube. For the CO bandheads in NGC253, we chose a template stellar spectrum of a late spectral type star, HD49105 (spectral type K0), observed with SINFONI in the same instrument configuration (pixel scale and grating). We performed a minimisation of the in which the parameters of the Gaussian (amplitude, center and width in velocity space) were adjusted until the convolved profile best matched the data (dof ). The uncertainties were boot-strapped using Monte Carlo techniques, assuming that the noise is uncorrelated and the intrinsic profile is well represented by a Gaussian (Davies et al., 2007). This method allowed us to obtain uncertainties for the velocity map in the range of km s-1.
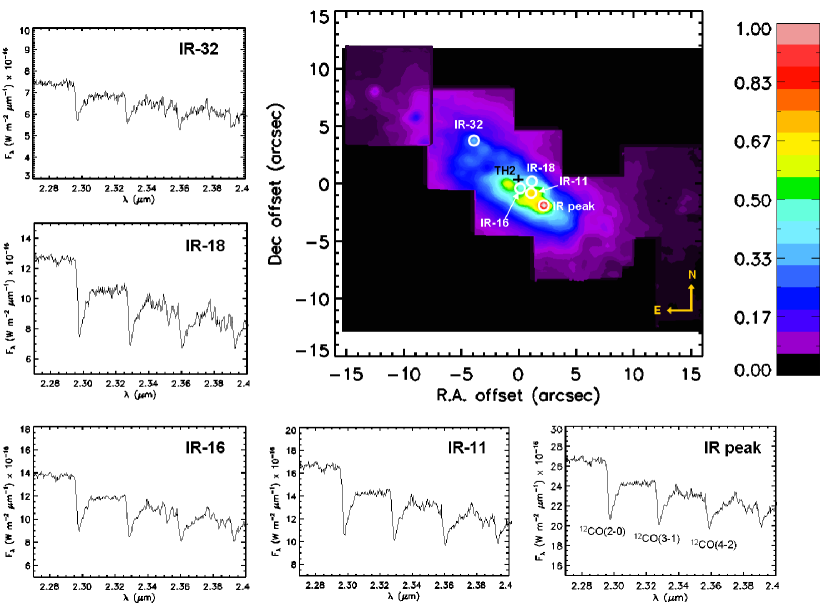
Thanks to the high S/N of our data we could make use of the three overtone bands of 12CO at 2.294 (2-0), 2.323 (3-1), and 2.353 (4-2) m. This is demonstrated in Fig. 1, where we have plotted the spectral region around the band CO bandheads of several knots of IR emission in the nuclear region. We have extracted stellar flux, velocity and dispersion maps. However, in this paper we only analyze the stellar velocity field and refer to Müller-Sánchez et al. (2010b) for a detailed study of the other maps.
2.1.3 Distribution of the band continuum emission
A flux map of -band continuum emission in the central pc of NGC253 is presented in Fig. 1. The image is centered at the position of the radio core, and presumed galactic center, TH2 (Ulvestad & Antonucci, 1997). Registration of sources is based on the alignment between radio and near-IR images proposed by Fernández-Ontiveros et al. (2009). Relevant IR sources in this study are labeled as “IR-” following the enumeration used by these authors as well, except for the IR peak. Here we briefly summarize the main morphological features of the band continuum to put them in context for the upcoming kinematic analysis and discussion.
Our SINFONI band map agrees well with previous near-IR studies of slightly lower spatial resolution (Sams et al., 1994; Engelbracht et al., 1998; Forbes et al., 2000) and with the high-resolution Adaptive Optics VLT/NACO images presented in Fernández-Ontiveros et al. (2009). At these wavelengths (1.9-2.4 m) the continuum emission of the nuclear region consists of multiple compact sources distributed along the disc of the galaxy in an apparent ring-like structure superposed on a diffuse emission component. The spatial resolution of our data and the availability of mosaic images at and bands providing a larger field of view compared to standard SINFONI observations, allow us to identify several discrete sources in the central pc of the galaxy. A qualitative and quantitative analysis of the intrinsic properties of the stellar clusters found in the central 300 pc of NGC253 will be presented in Müller-Sánchez et al. (2010b).
As can be seen in Fig. 1, the IR photometric center (the point of maximum emission in the wavelength range 1 – 20 m) is offset by about (60 pc) from the radio core, TH2. While the IR peak has an individual counterpart at radio wavelengths (TH7 in Ulvestad & Antonucci 1997), there is no discrete IR source associated with the radio nucleus (Fernández-Ontiveros et al., 2009). As it was discussed in the Introduction, this situation has originated a profuse debate about the precise location of the center of the galaxy and the nature of these two photometric centers. Thanks to the availability of sub-arcsecond resolution integral field data we are able to provide a third independent estimate of the center of the galaxy: the stellar kinematic center. This will be derived in Sect. 3.2 and compared with radio, IR and X-ray images of the nuclear region in Sect. 4.1.
2.2 X-ray Chandra Data
2.2.1 Observations and Data Processing
Level 2 event data from the ACIS instrument were extracted from Chandra archive111http://cda.harvard.edu/chaser/ (ObsID 3931) and observed in 2003 September 19. The data were reduced with the ciao 4.0222See http://asc.harvard.edu/ciao data analysis system and the Chandra Calibration Database (caldb 4.0.0333see http://cxc.harvard.edu/caldb/). The exposure time was processed to exclude background flares, using the task lc_clean.sl444see http://cxc.harvard.edu/ciao/download/scripts/ in source-free sky regions of the same observation. The net exposure time after flare removal is 76 ksec. The nucleus has no significant pileup.
Chandra data include information about the photon energies and positions that were used to obtain energy-filtered images, and to carry out sub-pixel resolution spatial analysis. Although the default pixel size of the Chandra/ACIS detector is , smaller spatial scales are accessible as the image moves across the detector pixels during the telescope dither, therefore sampling pixel scales smaller than the default pixel of Chandra/ACIS detector. It allows sub-pixel binning of the images. We made 0.125 images with FWHM resolution of in two bands: 0.5-2 keV (hereafter soft band) and 2-10 keV (hereafter hard band). The absolute astrometric accuracy of Chandra data is 1 rms.
In addition to the high-spatial resolution analysis we applied smoothing techniques to detect the low contrast diffuse emission. We applied the adaptive smoothing CIAO tool csmooth, based on the algorithm developed by Ebeling et al. (2006). csmooth is an adaptive smoothing tool for images containing multiscale complex structures, and it preserves the spatial signatures and the associated counts as well as significance estimates. A minimum and maximum significance S/N level of 3 and 4, and a scale maximum of 2 pixels were used.
The central sources detected in the image analysis were extracted to make the spectral analysis using circular apertures centered in the sources and with small radii of . This radius was chosen as trade-off between number of counts and contamination from background emission. We then extracted the background from source-free apertures around the hard X-ray emission regions. We subtracted the background from each source and performed the spectral analysis in the background-free sources. Response and ancillary response files were created using the CIAO mkacisrmf and mkwarf tools. To be able to use the as the fit statistics, the spectra were binned to give a minimum of 20 counts per bin before background subtraction using grppha task, included in FTOOLS555http://heasarc.gsfc.nasa.gov/docs/software/ftools. The analysis of the spectral counts was performed using the software package XSPEC (version 12.4.0666http://cxc.heasarc.gsfc.nasa.gov/docs/xanadu/xspec/, Arnaud et al. 1996).
2.2.2 X-ray imaging
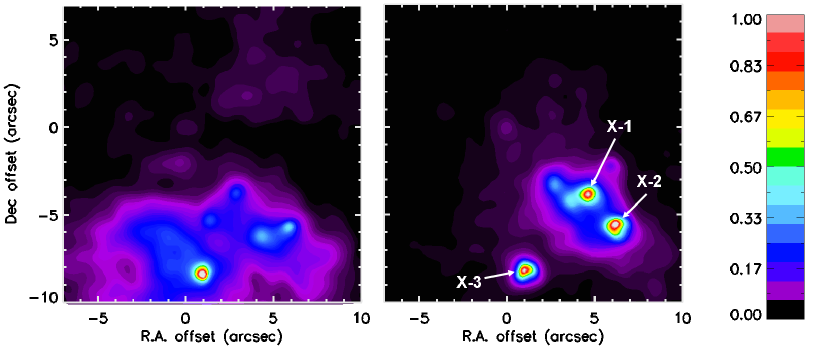
Fig. 2 shows the newly processed resolution ACIS images of the nuclear region () of NGC253 in two energy bands: soft (0.5-2 keV) and hard (2-10 keV) X-rays. The images are centered at the position of source IR-32, unambiguously identified at infrared, optical and X-ray spectral ranges (see Sect. 4.1).
The soft X-ray image shows several knots of emission embedded in a diffuse component which originates in the nuclear starburst and extends southwest in an apparent cone of ionization. Indeed, Strickland et al. (2000) showed that the soft X-ray emitting gas distribution is consistent with a conical outflow of hot plasma, that is well collimated in a direction nearly perpendicular to the plane of the galaxy and extremely similar in morphology and extent to the previously observed limb-brightened H outflow cone (Lehnert & Heckman, 1996).
In the hard X-ray image the emission is more compact and less diffuse. Three individual point-like sources are clearly identified: two lying in the nuclear starburst (X-1 and X-2) and one located SE from the nuclear region which corresponds to X-3 (Fig. 2). We use the “X-” nomenclature because it denotes easily the number of individual point-like hard X-ray sources found in the field (Fig. 2). X-1 and X-2 are separated by (44 pc). While X-2 has a counterpart at soft X-rays, X-1 is only bright at energies keV, suggesting that this source is highly absorbed. Extracting an even harder image in the 4–10 keV band shows that indeed X-1 is the brightest point-like source at higher energies. This is consistent with the spectra of the three sources (see Sect. 2.2.3 and Fig. 3).
2.2.3 X-ray spectroscopy
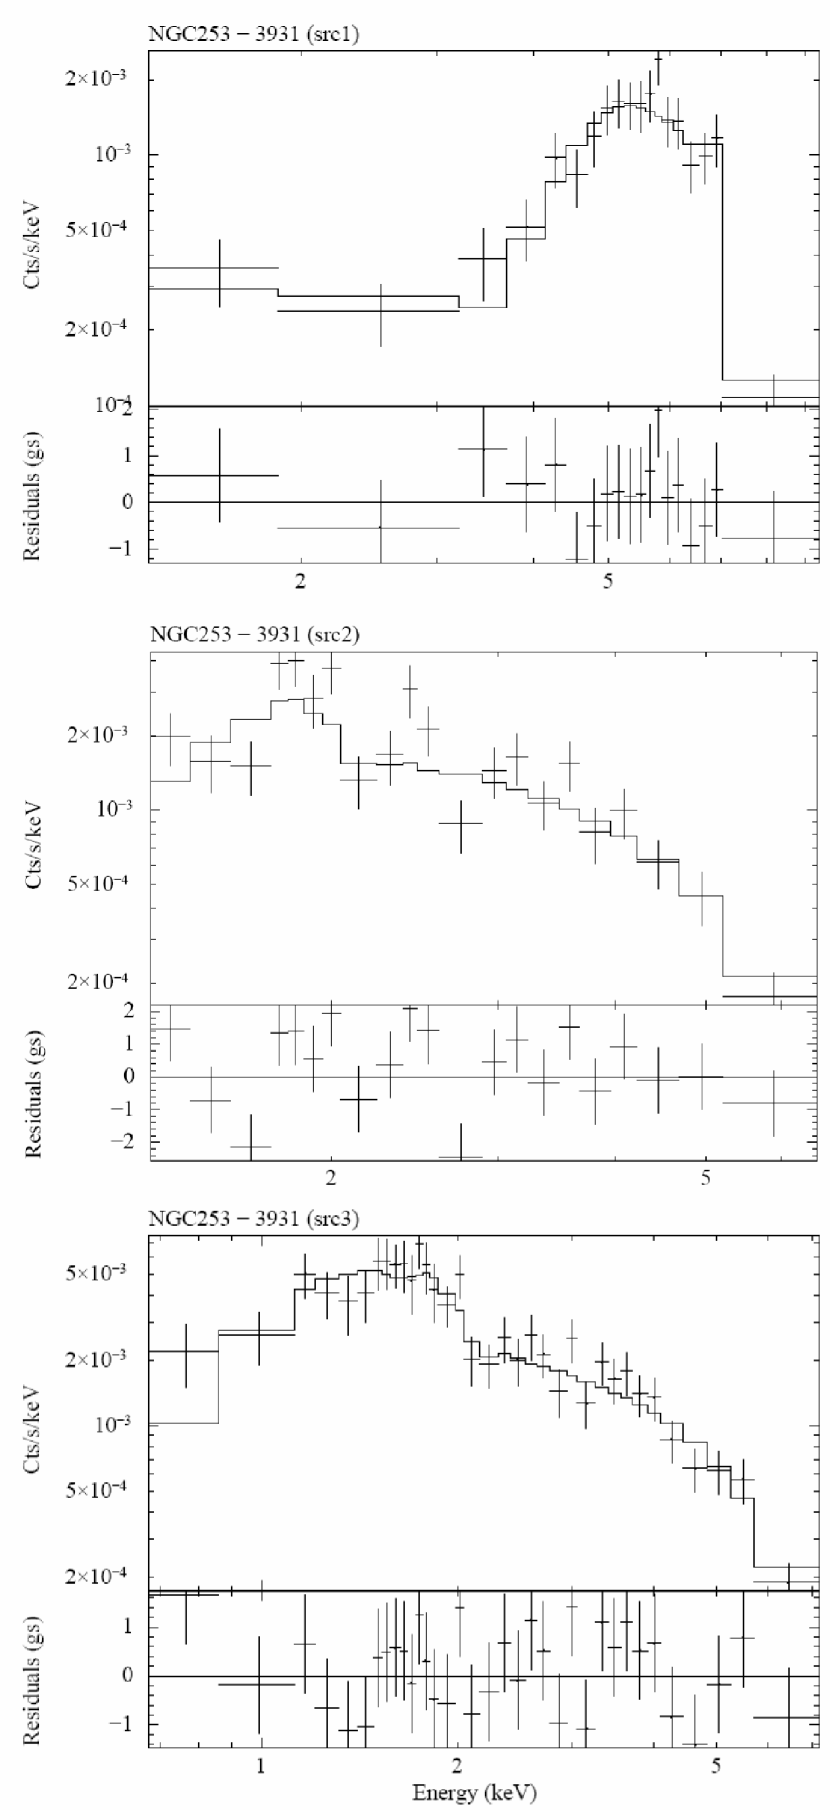
We performed spectral analysis for the three hard X-ray sources identified in the right panel of Fig. 2. We investigated five baseline models for the three sources, two of them only with one component: abs(power-law) and abs(MEKAL); and the other three composite models: abs(power-law)+abs(MEKAL), abs(power-law)+abs(power-law) and abs(power-law+MEKAL)+abs(power-law). The best fit was selected as the simplest model in which we can reproduce the observed spectrum based on statistics. We tested whether a more complex model is statisticaly justified by using f-statistic (ftest within Xspec). See González-Martín et al. (2009) for a detailed description of the models and the fitting process. The spectra of the three sources are shown in Fig. 3 and the model parameters are listed in Table 1.
3 Stellar kinematics
3.1 Evidence for a rotating stellar disc
We have extracted stellar kinematics in the nuclear region of the galaxy using the method described in Sect. 2.1.2, allowing for the first time a two-dimensional study of the stellar motions on scales enclosing the star-forming nuclear ring. Fig. 4 shows the velocity field of the stars in the central of the galaxy. As can be seen in this Figure, the stellar velocity field is very regular, typical of rotational motions. The major kinematic axis exhibits a velocity gradient from -80 km s-1 in the NE to 80 km s-1 in the SW and is well aligned with the photometric major axis of the nuclear disc. In addition, it presents azimuthal symmetry and the zero-velocity axis (or kinematic minor axis) is perpendicular to the kinematic major axis, as expected in regions dominated by rotation. The observed regular pattern of the stellar velocity field permits us to use a simple axisymmetric disc model to characterize the stellar kinematics in the nuclear region, and particularly, to constrain the location of the kinematic center. The fitting method and the derived model parameters will be discussed in the following Section.
3.2 Kinematic modeling: Defining the kinematic center of the galaxy
If a velocity map exhibits ordered rotation, such as the stellar velocity field of NGC253, the velocity can be well represented by circular motion in a disc. The standard method for deprojecting galaxies from kinematic data is to assume that the galaxy is made up of a number of rotating coplanar annuli. The velocity field is fitted with the equation:
where is the radius of a circular ring in the plane of the galaxy (or the semimajor axis of the ellipse in the plane of the sky), is the systemic velocity, is the ring circular velocity, is the ring inclination, is the position angle of the projected major axis, and is the azimuthal angle. This is the cosine law approximation (Krajnović et al., 2006). A crucial element of our investigation, which is intrinsic to this model, involves choice of the kinematic center. Most kinematic studies of galaxies do not consider the center as a variable, as they know a priori its location. For the purpose of this study, the stellar velocity field shall be fitted with a single disc model with four free geometric parameters: the center , the position angle , and the inclination .
The parameters of the rotating disc can be well determined via the kinemetry method developed and described in detail by Krajnović et al. (2006). Briefly, kinemetry is an extension of surface photometry to the higher-order moments of the velocity distribution. The procedure operates by first describing the data by a series of concentric ellipses of increasing major axis length, as defined by the system center, position angle, and inclination. Normally, the location of the center is the only parameter that is determined prior to running a kinemetric analysis; the latter two parameters (position angle and inclination) can either be determined a priori and used as inputs or be measured functions of semi-major axis length. At each radius, a small number of harmonic terms in a Fourier expansion is needed to determine the best-fitting ellipse:
where is the best-fitting ellipse at a given radius, is the maximum fit order used, and is the eccentric anomaly, which in the case of discs corresponds to the azimuthal angle. Following Trachternach et al. (2008), a decomposition of the velocity fields up to third order (i.e., ) is sufficient to capture most of the signal. If the motion is purely circular, the observed velocity along that ellipse will be described by a cosine law. In this ideal case, the term should be the only coefficient present in the harmonic expansion. Power in the other coefficients represents either deviations from circular motion (bars, inflows/outflows, etc.), or artifacts induced by the noise or incorrect geometric parameters (kinematic center, position angle and inclination).
Our fitting procedure therefore consists of iteratively changing the four geometric parameters (, , , ) until the values of , , , , , and are zero or close to zero. In other words, we use the kinemetry software to construct the best fitting rotating disk model of the stellar velocity field and determine simultaneously the kinematic center, position angle and inclination. In contrast to other previous kinemetric studies (Krajnović et al., 2007; Böker et al., 2008; Shapiro et al., 2008), in which the center is known a priori and the position angle and inclination are determined in two steps, the nature of our problem suggests that we need to calculate the four parameters simultaneously, as the location of the kinematic center is thigthly connected with the position angle of the kinematic major axis. Note that this procedure affects the determination of non-circular motions and could lead to slightly different geometric parameters and as for the cases in which the centers are known a priori. The position of the kinematic center is to first order that position which minimizes the non-circular motions in a tilted-ring fit and adopting this center position would then result in non-circular motions slightly smaller than the ones derived for the cases of known kinematic centers.
The regular pattern of the stellar velocities allows us to consider the entire velocity field at once and solve for a global kinematic center, position angle and inclination. In fact, we do not consider the possibility of having a kinematic center which varies with radius as it does not have a physical meaning. In more detail we performed the following steps:
-
1.
We masked out pixels in the velocity field having of the peak flux in the band continuum and those presenting velocities greater than km s-1.
-
2.
We assumed initial values of (, , , ) for the stellar disc in units of pixels for (, ) and degrees for (, ), and kept them constant through the kinemetric analysis. The choice of these units was dictated by practical reasons of easily identifying the kinematic center in our SINFONI maps.
-
3.
The observed velocity field was sampled along a set of ellipses regularly spaced in the semimajor axis and with constant (, , , ) as defined above.
-
4.
The velocities of every ellipse were fitted with a complete kinemetric expansion.
-
5.
We determined the agreement between the observed velocity field and the disc model (the 2D image reconstructed from only the term of the kinemetric expansion) as: where is the number of pixels included in the fit and are the measured errors of the velocity at each pixel . The residuals map reflects the combined powers in the higher coefficients, which may appear as asymmetries in the velocity field. As our stellar velocity field shows ordered rotation, the residuals are a measurement of the error in the estimation of the disc parameters.
-
6.
We then performed a multidimensional minimization of the function (, , PA, ) using the AMOEBA function in IDL (Nelder & Mead, 1965).
-
7.
We finally selected the best fitting values and the corresponding errors from the parameter space of (, , , ). The values of (, , , ) that give the lowest , , were considered to be the best-fit values and the confidence intervals were determined by a range of values greater than , defined as . If it is assumed that the observational errors are normally distributed, then also follows a probability distribution with the number of degrees of freedom equal to the number of model parameters (Lampton et al., 1976; van der Marel et al., 1998).
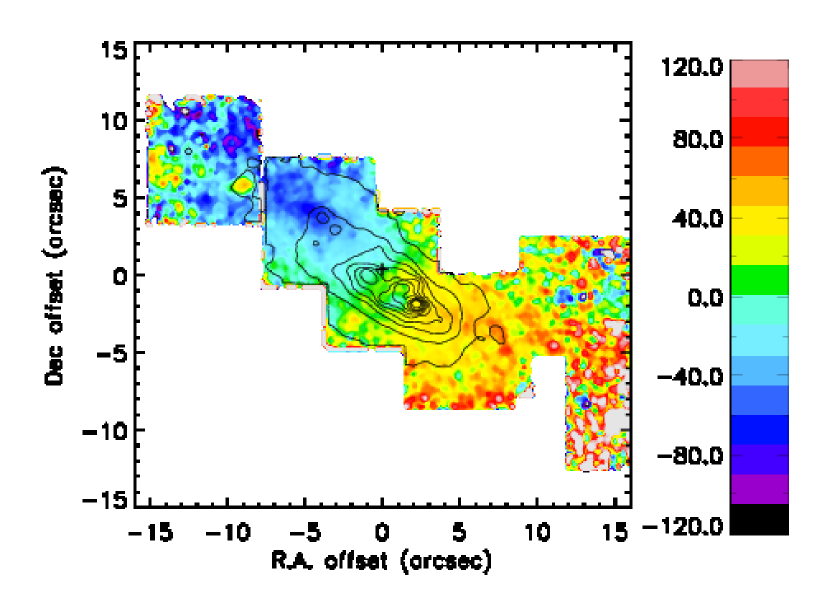
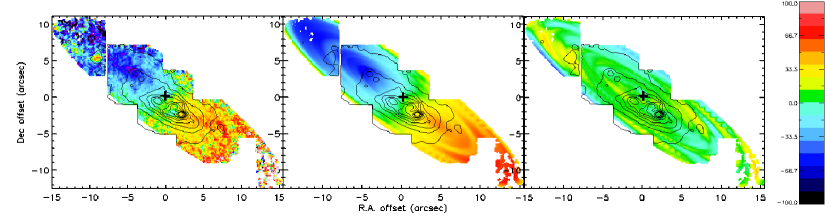
The result of the above procedure provided the best fitting disc parameters acceptable to the confidence level (corresponding to a uncertainty): the center is located at pixel , in our data, , and degrees. For reference, TH2 is located at pixel and in our SINFONI maps, which implies that the kinematic center is offset by and from the radio core. Notice that the position of TH2 is consistent with the kinematic center estimate within the errors. The estimated absolute position of the kinematic center is thus (, )2000 = , with a mean uncertainty of . The stellar velocity field used for the modeling is presented in the left panel of Fig. 5, while the best fitting disc model is shown in the middle panel. The residuals between the data and the best fitting model are displayed in the right panel. It is apparent from the residuals map that the observed velocities can be remarkably well described by the adopted simple thin disc approximation. No obvious regular patterns are noticeable in the residuals map, suggesting that the features observed in the residuals are only due to noisy pixels in the data. Furthermore, this map shows values between km s-1 consistent with the measured errors of the velocity map. The best fit and are in agreement with those from the photometric nuclear ring and those of the galactic disc (Pence, 1980; Paglione et al., 2004). Regarding to the location of the stellar kinematic center, we found that it lies in between the two original candidates for the galactic center, TH2 and the IR peak. However, the estimated confidence interval of our kinematic modeling clearly rules out the IR peak as kinematic center (they are separated by distance from each other). A more detailed discussion on the candidates for galactic nucleus and their physical properties will be presented in Sect. 4.
4 The Nucleus of NGC253
4.1 Alignment between radio, IR and X-ray images of the nuclear region
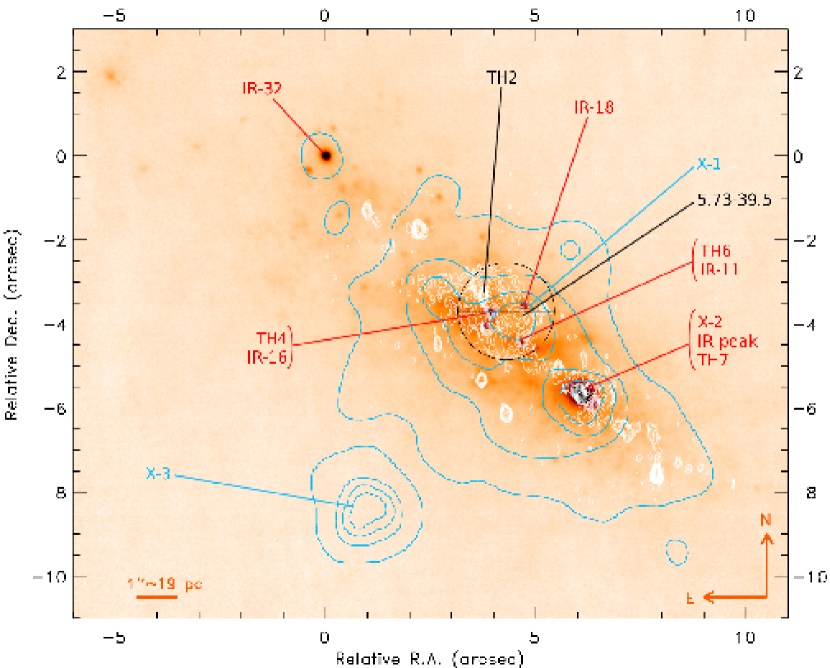
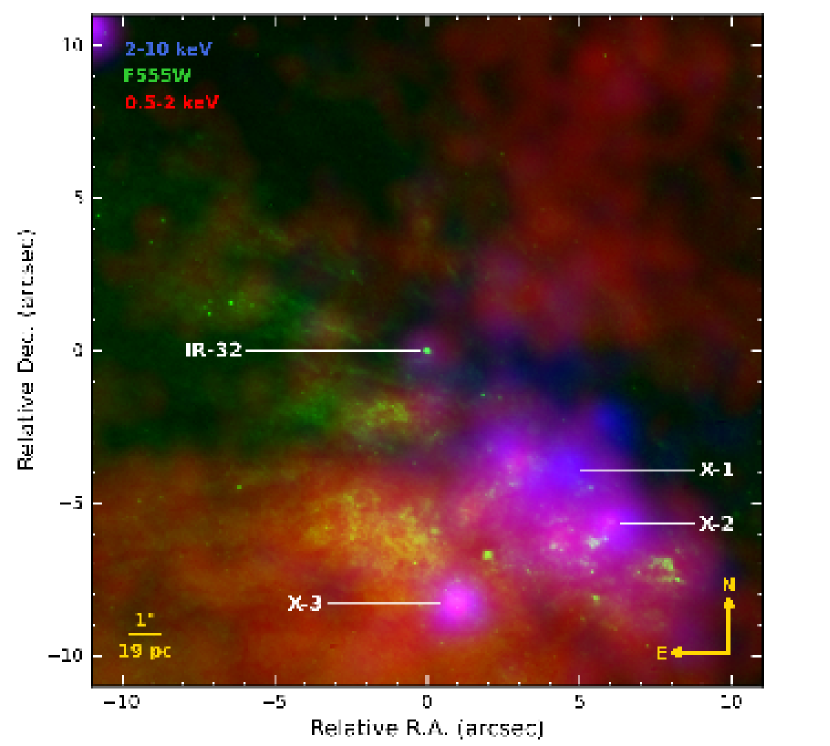
Fig. 6 summarizes the main results of our investigation. In this Figure, an overlay of the continuum emission at radio, IR and hard X-ray wavelengths in the central ( pc) of the galaxy is shown. The colour scale corresponds to the high resolution 3.8m NACO image from Fernández-Ontiveros et al. (2009). The 2-cm VLA A-configuration map from Turner & Ho (1985) is shown in white contours and the new 2-10 keV Chandra image from this work is presented in blue contours. The relevant radio, infrared and X-ray sources are indicated in the Figure, and the stellar kinematic center within approximately the errors is marked with a crossed circle of radius . We use the nomenclature from Ulvestad & Antonucci (1997) for the radio sources (except for source 5.73–39.5), and the IR and hard X-ray sources are labeled following the nomenclatures proposed in Sect. 2.1.3 and Sect. 2.2.2, respectively. The alignment between radio and near-IR images was done as proposed by Fernández-Ontiveros et al. (2009). The key alignment, however, is between hard X-ray and IR images. The first registration of sources was obtained directly from Chandra’s absolute astrometry. The absolute astrometric accuracy of the nuclear pointing is rms. This astrometric approximation could be improved through the identification of common sources. We noticed that two of the brightest IR point-like sources in the nuclear region, the IR peak and IR-32, have individual counterparts in the X-rays (see Fig. 6). The presence of these reference objects allowed us to tie the X-ray and IR images and achieve relative position accuracy in searching for radio and IR counterparts to the X-ray sources. The alignment was further cross-checked using optical and X-ray images. A three-color composite image of the central ( pc) region of NGC253 is shown in Fig. 7. Green corresponds to -band (WFPC2/F555W), red to soft X-ray and blue to hard X-ray emission. The image is centered at the position of source IR-32, which is an outstanding feature at IR, optical and X-ray wavelengths, and a reference object in the alignment. We found that the extended soft X-ray emission southeast of the nuclear starburst is well correlated with the -band emission in this region. Furthermore, the most prominent dark dust lane running along the northwestern part of the nuclear starburst is spatially coincident in optical and soft X-ray images (see Fig. 7).
As can be seen in Fig. 6, within the error circle of the stellar kinematic center, there are objects detected at different wavelengths: 6 radio sources, 8 IR knots of emission interpreted as young star clusters (Fernández-Ontiveros et al., 2009), and the hard X-ray source X-1. Having ruled out the IR peak as the kinematic center, the two next likely candidates for galactic nucleus are the photometric centers at radio and X-ray wavelengths (TH2 and X-1, respectively), the two consistent with the kinematic center location. Surprisingly, TH2 and X-1 are not each other’s counterparts. X-1 is located SW from TH2 well beyond the error of in the registration of the images. Not detecting any point-like hard X-ray source at the position of TH2 questions strongly its AGN nature, but does not discard it as the galactic nucleus with characteristics similar to Sgr A∗, as proposed by Fernández-Ontiveros et al. (2009). However, Chandra results clearly point to X-1 as AGN candidate. As our analysis cannot conclude whether the stellar kinematic center corresponds to TH2 or X-1, we consider the two as possible galactic nucleus candidates and discuss the implications in the following subsections.
4.2 TH2 as candidate for galactic nucleus
The newly processed Chandra observations of NGC253, combined with most of the current high-spatial resolution studies of this galaxy at different wavelengths, provide sufficient evidence against the AGN nature of TH2 (see Sect. 1). In fact, this source is only detected at radio wavelengths between 2.3 and 23 GHz and using baselines corresponding to synthesized beam sizes mas (Sadler et al., 1995; Lenc & Tingay, 2006). At frequencies lower than 2.3 GHz the source is not visible probably due to strong free-free absorption (Tingay, 2004). Longer baselines completely resolve TH2 as demonstrated by recent VLBI observations at 2.3 and 23 GHz with and mas resolution, respectively (Lenc & Tingay, 2006; Brunthaler et al., 2009). The upper limit on the flux density of these two observations is mJy. As this source is unresolved with the VLA (size mas and a flux density of 20 mJy at 23 GHz), this implies that its linear size is probably in the range of pc. Lenc & Tingay (2006) performed LBA observations at 2.3 GHz with slightly shorter baselines detecting TH2 with a flux density of mJy, a source size of mas ( pc), and a brightness temperature of K. The spectrum of the source between 5-15 GHz is relatively flat () and can be best fit with a free-free absorbed-power-law. All these characteristics are not particular unusual in the radio regime and can be explained in terms of either an accreting massive object similar to other synchrotron sources in the centers of active galaxies (Hummel et al., 1984; Turner & Ho, 1985; Gallimore et al., 2004), or a very compact SNR (Ulvestad & Antonucci, 1997).
The apparent lack of detected source variability at radio wavelengths over 8 year timescales implies that if TH2 is a SNR it is likely not expanding (Ulvestad & Antonucci, 1997). Recently, Brunthaler et al. (2009) reported signs of possible variability of TH2. However, as pointed out by these authors, a comparison of different values of flux densities in the literature is difficult, first due to potential contamination by the extended diffuse emission from the galaxy, and second because of the different resolutions used in the observations. This uncertainty can be seen in the comparison of the flux densities from VLA A and B configuration data in Ulvestad & Antonucci (1997) and in Table 1 and Figure 5 of Lenc & Tingay (2006). The different flux density measurements for TH2 have originated confusion on the nature of its radio spectrum, which has been argued to be flat (Turner & Ho, 1985).
Brunthaler et al. (2009) question the presence of a possible LLAGN based on the non-detection of TH2 on mas scales with an upper limit of 1 mJy at 23 GHz. In their analysis, they suggest that TH2 may be a Gigahertz Peaked Spectrum (GPS) source due to an apparent turnover in its spectrum between 4.8 and 8 GHz. However, as they pointed out, the GPS nature of TH2 is dubious as GPS sources having a turnover point between 5-10 GHz normally have sizes around 20 pc, times larger than the upper limit of 2 pc predicted for TH2, and are several orders of magnitudes more powerful than TH2. In addition, the lack of any optical or IR counterpart is inconsistent with the GPS hypothesis (Snellen et al., 1998).
In summary, TH2 is the brightest radio source (a factor compared to other sources) detected by the VLA (beam sizes mas) in the central pc of NGC253. However, it does not have any infrared, optical or X-ray counterpart, which argues against an AGN or SNR nature. Regarding the last possibility, Fernández-Ontiveros et al. (2009) show that a scaled version of the Crab or N40 SNRs to TH2 radio emission level should produce an IR/optical detectable counterpart, which is not the case. If indeed associated with the kinematic center of NGC253, these properties make TH2 similar to the center of our Galaxy, SgrA∗. A dormant BH like SgrA∗ at the distance of NGC253 (3.95 Mpc) would have flux densities at radio (23 GHz) and IR (flares at 3.8 m) wavelengths of Jy and Jy, respectively, making the source undetectable. The existence of a scaled version of SgrA∗ in NGC253 was proposed by Fernández-Ontiveros et al. (2009) based on the IR/radio ratio of TH2, measured with VLA 15 GHz and NACO band images of comparable resolution ( mas, 4 pc), which resembles that of SgrA∗ rather than an AGN.
4.3 X-1 as candidate for galactic nucleus
Chandra observations reveal a heavily absorbed source of hard X-rays embedded within the error circle of the kinematic center (see Fig. 6). The hard X-ray emission map from Weaver et al. (2002) shows a partly extended component along the nuclear ridge confined to an encircled area of r. At these scales, it is not clear whether or not the peak in hard X-rays is pointlike, but it has been argued that it is coincident with TH2. We reprocessed Chandra data and found, with an accurate astrometry of rms, a central hard X-ray peak (X-1) that is indeed point-like but which lies SW from TH2. It is evident from the similarity of the morphologies between the two hard X-ray maps that X-1 corresponds to the strongest source in the 4.5-8 keV continuum map of Weaver et al. (2002).
While the X-ray images from the two studies are very consistent, the X-ray spectrum of X-1 obtained by Weaver et al. (2002) is very different to the one measured in this work (see Figure 3 of Weaver et al. 2002 and our Fig. 3). We believe that this discrepancy is caused by the different aperture sizes used in the extraction of the spectra. In their work, a nuclear spectrum was extracted from within a circular region of diameter centered to the northeast of TH2 in order to avoid contamination from X-2. However, this aperture is with high probability contaminated by the diffuse 0.5–8 keV X-ray emission surrounding X-1 (Fig. 2).
The X-ray spectrum of X-1 presented in Fig. 3 is best fitted with two absorbed power-laws with and cm-2 (see Sect. 2.2.3 and Table 1). While is consistent with the extinction of the nuclear starburst region measured with near-IR observations (Fernández-Ontiveros et al., 2009), is particularly high, indicating that the source is heavily absorbed. This is supported by the lack of emission in the soft X-ray band. We hardly detected photons with energies below 2 keV resulting in a very low ratio of . X-ray sources with low and high are most often regarded as hidden AGN (Ueda et al., 2007; Winter et al., 2009). We estimate the intrinsic 2–10 keV luminosity of X-1 to be ergs s-1, consistent with the lower limit proposed by (Weaver et al., 2002) of ergs s-1. The intensity of the X-ray emission places the source in the “ultraluminous X-ray source” category. Given its location, coincident with the kinematic center and embedded in the nuclear starburst, chances are high that the ultraluminous source is a central massive object, either a weakly accreting massive BH (a LLAGN, Terashima et al. 2002; González-Martín et al 2009) or an evolved NSC brightening up in X-rays most probably due to young SNe and/or SNRs, similar to the luminous X-ray source near the center of M82 (Stevens et al., 1999). We examine these two possibilities below.
Within the achieved alignment error between radio, IR and X-ray images (Sect. 4.1), there are two SSCs that could be associated with X-1: IR-11 and IR-18 (Fig. 6). The two SSCs are spatially resolved in band, and are very similar in size (FWHM pc), flux density ( mJy in -band) and shape of their IR SEDs (Fernández-Ontiveros et al., 2009). While IR-11 has an individual counterpart at radio wavelengths (TH6 in Ulvestad & Antonucci 1997), there is no discrete radio source associated with IR-18 (see Fig. 6). In the radio regime, TH6 is the second strongest flat-spectrum source in NGC253 (, Lenc & Tingay 2006). Notice that it is not clear whether the spectrum of TH2 is flat or not (see Sect. 4.2). It appears to be resolved in VLA observations at 23 and 15 GHz (sizes of 4.5 2.4 and 4 1.8 pc, respectively), but unresolved at 8.4, 5 and 2.3 GHz. It was not detected at 1.4 GHz with the LBA probably due to free-free absorption as TH2 (Tingay, 2004). Interestingly, this source shows a position offset in LBA observations at 2.3 GHz that is not as consistent as the other sources when compared against VLA positions (Lenc & Tingay, 2006). These facts suggest that TH6 may have structure that varies significantly with frequency. In addition, it is associated with Radio Recombination Lines (RRL) emission that is consistent with the free-free absorbed spectra of HII regions. As in young stellar clusters, hard X-ray radiation is mainly produced by young SNe and/or SNRs (Stevens et al., 1999; Van Bever & Vanbeveren, 2000), the SSC IR-11/radio-TH6 is the most likely counterpart of X-1, presenting the expected simultaneous contribution in radio, IR and X-ray from young SNe and/or SNRs evolving in the SSC (Fernández-Ontiveros et al., 2009). The fact that IR-18 has no radio counterpart makes more difficult to justify its association with X-1. There is an additional radio source, 5.73–39.5 in Lenc & Tingay (2006), also compatible with the location of X-1 (Fig. 6). However, its flux density has been measured only at two frequencies: 8.4 and 23 GHz. In these measurements 5.73–39.5 is four times weaker than TH6, and has no IR counterpart, all together making dubious any interpretation.
A second alternative is the association of X-1 with a hidden LLAGN on the basis of the hardness of its X-ray spectrum with an absorbing column density of almost cm-2. No other manifestation of the active nucleus is found, neither a strong radio nor a near-infrared point source is located at the position of X-1. The absence of any signature other than in the hard X-rays implies that the AGN is non-standard and similar to the hidden AGN detected in NGC4945, but times less luminous (Marconi et al., 2000).
In summary, X-1 appears to be a heavily absorbed object ( cm-2) only detected at energies keV ( ergs s-1). If indeed associated with the kinematic center of the galaxy, the simplest explanation accounting for these properties is that X-1 is a hidden LLAGN, similar to the one observed in NGC4945. Alternatively, within the Chandra error circle of , X-1 could be associated with two SSCs (IR-18 and IR-11/radio-TH6) and one resolved radio source (5.73–39.5). Among these three possibilities, the SSC IR-11/radio-TH6 is the most likely counterpart to X-1. In this case, the hard X-ray emission would be associated to processes occuring in the SSC which could produce the intrinsic 2–10 keV luminosity of ergs s-1, being the most plausible explanation young SNe and/or SNRs evolving in this massive cluster. The nature of the kinematic center of NGC253 would then be a NSC of M⊙ with properties similar to other clusters in the nuclear region (Fernández-Ontiveros et al., 2009; Müller-Sánchez et al., 2010b).
X-1 might alternatively be a background X-ray source. In this case, the inferred luminosity is only a lower limit and a background AGN could well be invoked to explain the X ray power of the source. Although we cannot completely rule out this scenario, it seems very unlikely that there exists a background AGN which is precisely coincident with the kinematic center of NGC253. In addition, as it was discussed above, X-1 may have radio and/or IR counterparts which are believed to belong to the galaxy.
5 Conclusions
SINFONI near-infrared integral field spectroscopy combined with Chandra imaging and spectroscopy have been used in this work to probe the galactic nucleus of NGC253. Thanks to our high S/N integral field data we were able to extract 2D stellar kinematics in the nuclear region of NGC253 and estimate the kinematic center of the galaxy with a very good accuracy. Our main results and conclusions can be summarized as follows:
-
•
The stellar kinematic center is located in between the strongest compact radio source (TH2) and the IR photometric center, or IR peak. It lies SW from TH2 and NE from the IR peak.
-
•
The estimated confidence interval of our kinematic modeling () clearly discards the IR peak as kinematic center, but includes the position of TH2.
-
•
Newly processed Chandra images reveal a central point-like hard X-ray source (X-1) lying SW from the kinematic center.
-
•
Very accurate alignment between radio, IR and X-ray sources in the nuclear region shows that TH2 and X-1 are not associated with each other, being separated by . As the two could be a manifestation of nuclear activity, and our current estimate of the kinematic center location is consistent with both sources, we consider the two as possible galactic nucleus candidates.
-
•
TH2 is the brightest radio source, with the highest brightness temperature, detected with the VLA in the central region of NGC253. However, it does not have any IR, optical or X-ray counterparts. When observed at very high spatial resolution with the VLBI, TH2 is among the weakest sources ( mJy at 2.3 GHz, Lenc & Tingay 2006), or it is not detected ( mJy at 23 GHZ, Brunthaler et al. 2009). If the kinematic center is associated with TH2, we conclude that the nature of the nucleus of NGC253 resembles that of SgrA∗.
-
•
X-1 is a heavily absorbed object ( cm-2) only detected at energies keV ( ergs s-1). If X-1 corresponds to the kinematic center of the galaxy, the simplest explanation accounting for these properties is that the nucleus of NGC253 harbors a hidden LLAGN.
-
•
Alternatively, X-1 may be associated with one SSC in this region: SSC IR-11/radio-TH6. In this case the kinematic center of NGC253 would then be a M⊙ spatially resolved (diameter of pc) NSC in which some of its massive stars are evolving into the SN phase.
An important conclusion from this study is that the nature of dusty galaxies cannot be always characterized by photometric data alone but must be complemented with spectroscopic observations. In particular, we demonstrated the power of integral field spectroscopy for the determination of kinematic centers of galaxies. Further near-IR integral-field observations with high spatial resoultion would be useful to derive a more accurate position of the kinematic center, measure directly the mass of the putative central massive object, and reveal the presence of either broad recombination lines or forbidden high ionization lines. A detection of any of these would provide definite evidence of the existence of an AGN in this galaxy.
References
- Abuter et al. (2005) Abuter, R., Schreiber, J., Eisenhauer, F., Ott, T., Horrobin, M., & Gillesen, S. 2005, NewAR, 50, 398
- Anantharamaiah & Goss (1996) Anantharamaiah, K. R., & Goss, W. M. 1996, ApJ, 466, L13
- Arnaboldi et al. (1995) Arnaboldi, M., Capaccioli, M., Cappellaro, E., Held, E. V., & Koribalski, B. 1995, AJ, 110, 199
- Bonnet et al. (2004) Bonnet, H., et al. 2004, The ESO Messenger, 117, 17
- Böker et al. (1998) Böker, T., Krabbe, A. & Storey, J. W. V. 1998, ApJ, 498, 115
- Böker et al. (2002) Böker, T., Laine, S., van der Marel, R. P., Sarzi, M., Rix, H.-W., Ho, L. C., & Shields, J. C. 2002, AJ, 123, 1389
- Böker et al. (2008) Böker, T., Falcón-Barroso, J., Schinnerer, E., Knapen, J. H., & Ryder, S. 2008, AJ, 135, 479
- Brunthaler et al. (2009) Brunthaler, A., Castangia, P., Tarchi, A., Henkel, C., Reid, M. J., Falcke, H., & Menten, K. M. 2009, A&A, 497, 103
- Canzian, Mundy & Scoville (1988) Canzian, B., Mundy, L. G., & Scoville, N. Z. 1988, ApJ, 333, 157
- Das et al. (2001) Das, M., Anantharamaiah, K. R., & Yun, M. S. 2001, ApJ, 549, 896
- Davies et al. (2007) Davies, R., Müller Sanchez, F., Genzel, R., Tacconi, L.J., Hicks, E., Friedrich, S., & Sternberg, A. 2007, ApJ, 671, 1388
- Ebeling et al. (2006) Ebeling, H., White, D. A., & Rangarajan, F. V. N. 2006, MNRAS, 368, 65
- Eisenhauer et al. (2003) Eisenhauer, F., et al. 2003, in Instrument Design and Performance for Optical/Infrared Ground-based Tele- scopes, eds. Masanori I., Moorwood A., Proc. SPIE, 4841, 1548
- Engelbracht et al. (1998) Engelbracht, C. W., Rieke, M. J., Rieke, G. H., Kelly, D. M., & Achtermann, J. M. 1998, ApJ, 505, 639
- Fernández-Ontiveros et al. (2009) Fernández-Ontiveros, J. A., Prieto, M. A., & Acosta-Pulido, J. A. 2009, MNRAS, 392, L16
- Filippenko & Sargent (1989) Filippenko, A. V., & Sargent, W.L.W. 1989, ApJ, 342, L11
- Forbes et al. (2000) Forbes, D. A., Polehampton, E., Stevens, I. R., Brodie, J. P., & Ward, M. J. 2000, MNRAS, 312, 689
- Galliano et al. (2005) Galliano, E., Alloin, D., Pantin, E., Lagage, P. O., & Marco, O. 2005, A&A, 438, 803
- Gallimore et al. (2004) Gallimore, J. F., Baum, S. A., & O’Dea, C. P. 2004, ApJ, 613, 794
- González-Martín et al. (2009) González-Martín, O., Masegosa, J., Márquez, I., & Guainazzi, M. 2009, ApJ, 704, 1570
- Graham (2008) Graham, A. W. 2008, PASA, 25, 167
- Heckman (1998) Heckman, T. M. 1998, in ASP Conf. Ser. 148, Origins, ed. C. E. Woodward, J. M. Shull, & H. A. Thronson, Jr. (San Francisco: ASP), 127
- Hummel et al. (1984) Hummel, E., van der Hulst, J. M., & Dickey, J. M. 1984, A&A, 134, 207
- Karachentsev et al. (2003) Karachentsev, I. D., et al. 2003, A&A, 438, 803
- Keto et al. (1999) Keto, E., Hora, J. L., Fazio, G. G., Hoffmann, W. & Deutsch, L. 1999, ApJ, 518, 183
- Krajnović et al. (2006) Krajnović, D., Cappellari, M., de Zeeuw, P. T., & Copin, Y. 2006, MNRAS, 366, 787
- Krajnović et al. (2007) Krajnović, D., Sharp, R., & Thatte, N. 2007, MNRAS, 374, 385
- Lampton et al. (1976) Lampton, M., Margon, B., & Bowyer, S. 1976, ApJ, 208, 177
- Lehnert & Heckman (1996) Lehnert, M. D., & Heckman, T. M. 1996, ApJ, 462, 651
- Lenc & Tingay (2006) Lenc, E., & Tingay, S. J. 2006, AJ, 132, 1333
- Marconi et al. (2000) Marconi, A., Oliva, E., van der Werf, P. P., Maiolino, R., Schreier, E. J., Macchetto, F., & Moorwood, A.F.M. 2000, A&A, 357, 24
- Matsumoto et al. (2001) Matsumoto, H., Tsuru, T. G., Koyama, K., Awaki, H., Canizares, C. R., Kawai, N., Matsushita, S., & Kawabe, R. 2001, ApJ, 547, L25
- Mauersberger et al. (1996) Mauersberger, R., Henkel, C., Wielebinski, R., Wiklind, T., & Reuter, H.-P. 1996, A&A, 305, 421
- Mohan et al. (2002) Mohan, N. R., Anantharamaiah, K. R., & Goss, W. M. 2002, ApJ, 574, 701
- Müller-Sánchez et al. (2010b) Müller-Sánchez, F., et al. 2010b, in preparation
- Muñoz-Tuñon et al. (1993) Muñoz-Tuñon, C., Vilchez, J. M., & Castañeda, H. 1993, A&A, 278, 364
- Nakai et al. (1995) Nakai, N., Inoue, M., Miyazawa, K., Miyoshi, M., & Hall, P. 1995, PASJ, 47, 771
- Nelder & Mead (1965) Nelder, J.A., & Mead, R. 1965, Computer Journal, 7, 308
- Paglione et al. (1995) Paglione, T. A. D., Tosaki, T., & Jackson, J. M. 1995, ApJ, 454, L117
- Paglione et al. (2004) Paglione, T. A. D., Yam, O., Tosaki, T., & Jackson, J. M. 2004, 611, 835
- Pence (1980) Pence, W. D. 1980, ApJ, 239, 54
- Peng et al. (1996) Peng, R., Zhou, S., Whiteoak, J. B., Lo, K. Y., & Sutton, E. C. 1996, ApJ, 470, 821
- Prada et al. (1998) Prada, F., Gutiérrez, C. M., & McKeith, C. D. 1998, ApJ, 495, 765
- Richstone et al. (1998) Richstone, D., et al. 1998, Nature, 395, A14
- Sadler et al. (1995) Sadler, E. M., Slee, O. B., Reynolds, J. E., & Roy, A. L. 1995, MNRAS, 276, 1373
- Sams et al. (1994) Sams III, B. J., Genzel, R., Eckart, A., Tacconi-Garman, L., & Hofmann, R. 1994, ApJ, 430, L33
- Seth et al. (2010) Seth, A., et al. 2010, ApJ, 714, 713
- Shapiro et al. (2008) Shapiro, K., et al. 2008, ApJ, 682, 231
- Shapley et al. (2003) Shapley, A., et al. 2003, ApJ, 588, 65S
- Snellen et al. (1998) Snellen, I. A. G., et al. 1998, MNRAS, 301, 985
- Stevens et al. (1999) Stevens, I. R., Strickland, D. K., & Wills, K. A. 1999, MNRAS, 308, L23
- Strickland et al. (2000) Strickland, D. K., Heckman, T. M., Weaver, K. A., & Dahlem, M. 2000, AJ, 120, 2965
- Summers et al. (2004) Summers, L. K., Stevens, I. R., Strickland, D. K. & Heckman, T. M. 2004, MNRAS, 351, 1
- Tacconi-Garman et al. (2005) Tacconi-Garman, L. E., Sturm, E., Lehnert, M., Lutz, D., Davies, R. I., & Moorwood, A. F. M. 2005, A&A, 432, 91
- Tacconi-Garman (2006) Tacconi-Garman, L. E. 2006, NewAR, 49, 569
- Terashima et al. (2002) Terashima, Y., Iyomoto, N., Ho, L. C., & Ptak, A. F. 2002, ApJS, 139,1
- Tingay (2004) Tingay, S. J. 2004, AJ, 127, 10
- Trachternach et al. (2008) Trachternach, C., de Blok, W. J. G., Walter, F., Brinks, E., & Kennicutt, R. C. 2008, AJ, 136, 2720
- Turner & Ho (1985) Turner, J. L., & Ho, P. T. P. 1985, ApJL, 299, L77
- Ueda et al. (2007) Ueda, Y., Eguchi, S., Terashima, Y., Mushotzky, R., Tueller, J., Markwardt, C., Gehrels, N., Hashimoto, Y., & Potter, S. 2007, ApJ, 664, L79
- Ulrich (1978) Ulrich, M. H. 1978, ApJ, 219, 424
- Ulvestad & Antonucci (1997) Ulvestad, J. S., & Antonucci, R. R. J. 1997, ApJ, 488, 621
- Van Bever & Vanbeveren (2000) Van Bever, J., & Vanbeveren, D. 2000, A&A, 358, 462
- van der Marel et al. (1998) van der Marel, R. P., Cretton, N., de Zeeuw, P. T., & Rix, H.-W. 1998, ApJ, 493, 613
- Weaver et al. (2002) Weaver, K. A., Heckman, T. M., Strickland, D. K., & Dahlem, M. 2002, ApJL, 576, L19
- Wills et al. (1999) Wills, K. A., Pedlar, A., Muxlow, T.W.B., & Stevens, I. R. 1999, MNRAS, 305, 680
- Winter et al. (2009) Winter, L. M., Mushotzky, R. F., Terashima, Y., & Ueda, Y. 2009, ApJ, 701, 1644
| Source | TypeaaBest-fit spectral model, stands for abs(power-law), for abs(MEKAL), and 2po for abs(power-law)+abs(power-law). | CountsbbNumber of counts in the range 0.5-10 keV | ccHydrogen column densities in units of cm-2 | ccHydrogen column densities in units of cm-2 | ddObserved flux in logarithmic units of ergs cm-2 s-1 | ddObserved flux in logarithmic units of ergs cm-2 s-1 | eeIntrinsic hard X-ray luminosity in logarithmic units of ergs s-1 (assuming Mpc) | /dof | |
|---|---|---|---|---|---|---|---|---|---|
| X-1 | 2po | 393 | |||||||
| X-2 | po | 436 | - | ||||||
| X-3 | po | 803 | - |