2 LERMA & UMR 8112 du CNRS, Observatoire de Paris, 61 Av. de l’Observatoire, 75014 Paris, France
From high-mass starless cores to high-mass protostellar objects††thanks: Herschel is an ESA space observatory with science instruments provided by Principal Investigator consortia. It is open for proposals for observing time from the worldwide astronomical community.
Abstract
Aims. Our aim is to understand the evolutionary sequence of high-mass star formation from the earliest evolutionary stage of high-mass starless cores, via high-mass cores with embedded low- to intermediate-mass objects, to finally high-mass protostellar objects.
Methods. Herschel far-infrared PACS and SPIRE observations are combined with existing data at longer and shorter wavelengths to characterize the spectral and physical evolution of massive star-forming regions.
Results. The new Herschel images spectacularly show the evolution of the youngest and cold high-mass star-forming regions from mid-infrared shadows on the Wien-side of the spectral energy distribution (SED), via structures almost lost in the background emission around 100 m, to strong emission sources at the Rayleigh-Jeans tail. Fits of the SEDs for four exemplary regions covering evolutionary stages from high-mass starless cores to high-mass protostellar objects reveal that the youngest regions can be fitted by single-component black-bodies with temperatures on the order of 17 K. More evolved regions show mid-infrared excess emission from an additional warmer component, which however barely contributes to the total luminosities for the youngest regions. Exceptionally low values of the ratio between bolometric and submm luminosity additionally support the youth of the infrared-dark sources.
Conclusions. The Herschel observations reveal the spectral and physical properties of young high-mass star-forming regions in detail. The data clearly outline the evolutionary sequence in the images and SEDs. Future work on larger samples as well as incorporating full radiative transfer calculations will characterize the physical nature at the onset of massive star formation in even more depth.
Key Words.:
Stars: formation – Stars: early-type – Stars: individual: IRAS 18223-1243 – Stars: evolution – Stars: massive1 Introduction
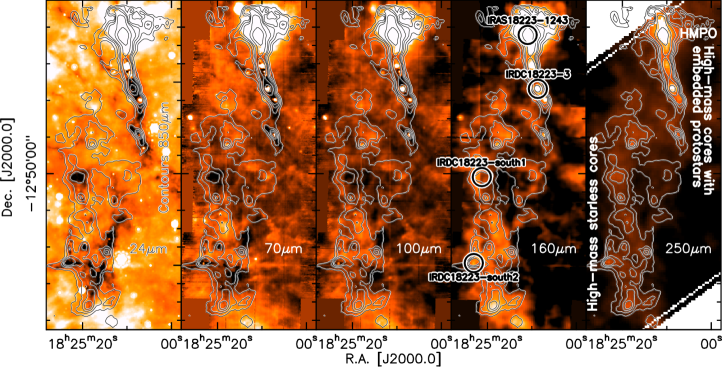
Characterizing the early evolutionary stages of (high-mass) star formation is difficult because the cold cores (10 to 20 K) have the peak of the spectral energy distribution (SED) at far-infrared wavelengths which were hardly accessible until recently. Herschel has changed this situation completely, and we are now able to study the young (massive) star-forming regions in detail. For this early Herschel study we selected the complex associated with the High-Mass Protostellar Object (HMPO) IRAS 18223-1243 and the Infrared Dark Cloud IRDC 18223-3 at a distance of 3.7 kpc (Sridharan et al., 2002). This region hosts most evolutionary stages in massive star formation, starting with high-mass starless cores, continuing with high-mass cores with embedded low- to intermediate-mass protostars potentially forming massive stars, to HMPOs with already embedded and likely still accreting massive protostars (Fig. 1).
Previous studies focused either on the HMPO IRAS 18223-1243 (e.g., Sridharan et al. 2002; Beuther et al. 2002) or at a high-mass core with embedded low- to intermediate-mass protostar IRDC 18223-3 (Garay et al., 2004; Beuther & Steinacker, 2007; Fallscheer et al., 2009). However, the whole complex with the youngest starless cores has not been studied so far. Here we combine Herschel PACS and SPIRE data at far-infrared wavelengths (Pilbratt et al., 2010; Poglitsch et al., 2010; Griffin et al., 2010) with Spitzer mid-infrared data and (sub)mm continuum observations at the Rayleigh-Jeans tail of the spectrum.
2 Data and observations
The cloud complex with a size of was observed with PACS (Poglitsch et al., 2010) on Herschel (Pilbratt et al., 2010) on 2009 October 9 within the science demonstration program. Scan maps in two orthogonal directions with scan leg lengths of and , respectively, were obtained with the medium scan speed of 20′′/s. The raw data have been reduced with the HIPE software, version 3.0, build 455 (Poglitsch et al., 2010). Beside the standard steps leading to level-1 calibrated data, a second-level deglitching as well as a correction for offsets in the detector sub-matrices were performed. Finally, the data were highpass-filtered, using a median window of the size of the full scan legs, to remove the effects of bolometer sensitivity drifts and the 1/f noise along the course of the data acquisition. We masked out emission structures (visible in a first iteration) before computing and subtracting this running median. Thereby over-subtraction of source emission in the highpass filtering step can be minimized. The flux correction factors provided by the PACS ICC team were applied. The beam sizes of the 70, 100 and 160 m data are 5.6′′, 6.8′′ and 11.4′′, respectively. The 100 m PACS flux within an aperture of toward the IRAS source 18223-1243 is fully consistent with the calibration uncertainties of both missions (17% measured difference).
Maps at 250, 350, and 500 m were obtained with SPIRE (Griffin et al., 2010) on 2009 October 19. Two scan legs were used to cover the source. The data were processed within HIPE with the standard photometer script up to level 1. During baseline removal, we masked out the high-emission area associated with the IRAS source. Because no cross-scan data were obtained for these observations, the iterative de-striping algorithm was invoked to mitigate this effect (Bendo et al., 2010). The beam sizes at 250, 350 and 500 m are 18.1′′, 24.9′′ and 36.6′′, respectively. We estimate the fluxes to be accurate within 20%.
The MIPS 24 and 70 m data (from MIPSGAL, Carey et al. 2009) as well as the IRAC 3.5 to 8 m (from GLIMPSE, Churchwell et al. 2009) and the PdBI 3.2 mm continuum data were first presented in Beuther et al. (2005) and Beuther & Steinacker (2007). On the long-wavelength side, we use the SCUBA 850 m data from the SCUBA archive (Di Francesco et al., 2008) and the 1.2 mm continuum flux measurement observed with the IRAM 30 m telescope (Beuther et al., 2002). The accuracy of the flux measurements at (sub)mm wavelength is estimated to be correct within 15% and for the 24 m within 20%. Because no sources are detected in the IRAC bands for most of our targets (except of the HMPO), the 3 upper limits of the four Spitzer IRAC datasets are 0.05 mJy at 3.6 and 4.5 m, 0.13 mJy at 5.8 m and 0.15 at 8 m.
3 Results
3.1 General structure of the complex
Figure 1 gives an overview of the whole complex from mid-infrared via far-infrared to (sub)mm wavelengths. The covered region of approximately corresponds at the given distance to an area of 42 pc2 with a length of 10 pc. At 70 m, the linear spatial resolution is 20 000 AU. Globally, one can clearly distinguish the different evolutionary stages and the corresponding spectral behavior in these images. We will discuss the global properties first, spectral energy distributions of exemplary sources will be presented in Sect. 3.2.
While the HMPO and IRAS source in the north of the field (IRAS 18223-1243) is a strong emission source at all covered wavelengths, this is clearly not the case for most other parts of the region. For example, the filamentary structure south of IRAS 18223-1243 is a clear (sub)mm continuum emission region, but it shows pronounced filamentary absorption structures against the bright Galactic background at 24 m and shorter wavelengths (see also Beuther et al. 2005; Beuther & Steinacker 2007). Nevertheless, while the (sub)mm emission peaks in the filament extending south to a declination of show only absorption in the IRAC bands up to 8 m wavelength (Beuther et al., 2005), they are weak emission sources in the Spitzer 24 m band. Combining this weak mid-infrared emission features with outflow signatures like the “extremely green objects” (EGOs, Cyganowski et al. 2008) and CO and CS line wing emission favors the interpretation of these sources as low- to intermediate-mass protostars embedded in high-mass cores that will likely form massive stars at the end of the evolution (Beuther & Steinacker, 2007). Again different from these sources are the (sub)mm emission peaks found south of . Almost all of these (sub)mm sources are either extinction features at 24 m wavelength or they show extended emission associated likely with the fore- or background. None of these sources show clear 24 m emission indicative of a protostar during its formation. While some of these (sub)mm sources start appearing as far-infrared emission peaks at 70 m in the Herschel data, others remain in absorption or at least “inconspicuous” to wavelengths as long as 100 m. While more targeted studies in the past almost always found signs of star formation activity toward IRDCs (e.g., Rathborne et al. 2006; Beuther & Sridharan 2007; Motte et al. 2007) less biased Herschel studies now have the potential to identify and characterize genuine high-mass starless cores.
From a more general point of view, these images can be considered as templates of how young star-forming regions change their appearance with wavelength: While the youngest and coldest regions appear as shadows from near- to mid-infrared wavelengths against the stronger diffuse background emission, background and source emission approximately equalize at far-infrared wavelength (e.g., 100 m panel in Fig. 1). Going to even longer wavelengths, the cold SEDs raise the emission of the cores considerably above the background, and one clearly identifies them as emission sources. This evolutionary picture strongly resembles that of low-mass star-forming regions (e.g., Andre et al. 1993).
3.2 Spectral energy distributions


To better characterize the evolutionary sequence, we selected four sources representing different evolutionary stages: (a) the HMPO IRAS 18223-1243 (Sridharan et al., 2002; Beuther et al., 2002), (b) the low- to intermediate-mass protostar embedded in the infrared dark filament IRDC 18223-3 (Beuther et al., 2005; Beuther & Steinacker, 2007), (c) a 24 m shadow in the south that becomes detectable from 70 m onward (IRDC 18223-south2), and (d) a source that remains dark up to 100 m (IRDC 18223-south1). The sources are marked in Fig. 1, the peak positions in R.A. and Dec. (J2000.0) are (a) 18:25:10.67 -12:42:25.8, (b) 18:25:08.61 -12:45:19.7, (c) 18:25:22.89 -12:54:50.7, (d) 18:25:19.15 -12:50:11.2, respectively.
Because Herschel fully covers the peak of the SED even for the coldest regions, and is unique with respect to spatial resolution, sensitivity and robustness against saturation at the given wavelengths, this offers the opportunity to characterize this evolutionary sequence from an SED point of view in detail. Therefore we extracted the fluxes over the full wavelength coverage between 12 m and 1.3 mm wavelength covering the Wien and Rayleigh-Jeans parts of the spectrum. We derived the fluxes in all bands for uniform apertures. For IRDC 18223-3 and IRDC 18223-south2, the chosen aperture was based on the coarsest spatial resolution of the SPIRE 500 m band (FWHM36.6′′). For the HMPO IRAS 18223-1243, we chose a aperture to be able to combine the data with the IRAS fluxes at 12 and 25 m (Spitzer is saturated for that source at 24 m and shorter wavelengths). And for the youngest source we choose an even larger aperture of to cover the whole clump as visible in Fig. 1. Table 1 shows the derived fluxes and Fig. 2 presents the corresponding SEDs.
| 18223-1243 | 18223-3 | 18223-south2 | 18223-south1 | |
|---|---|---|---|---|
| 16.21 | – | – | – | |
| 64.91 | 12.13 | – | – | |
| 756.6 | 7.54 | 0.395 | – | |
| 938.6 | 33.0 | 22.16 | – | |
| 811.0 | 77.7 | 22.66 | 43.0 | |
| 222.0 | 60.6 | 19.1 | 48.9 | |
| 84.5 | 28.9 | 10.0 | 25.0 | |
| –2 | 20.8 | 7.3 | 10.4 | |
| 4.4 | 1.9 | 0.65 | 1.2 | |
| 1.9 | 0.75 | – | – |
The SCUBA 850 m data and the 1.2 mm data are taken from Di Francesco et al. (2008) and Beuther et al. (2002), respectively. 1IRAS flux; 2Artifact (see Fig. 1); 3Beuther & Steinacker (2007), 4Because the source is embedded in absorption filament, we selected smaller aperture just covering the emission source. 5Because of absorption close to the source, here we applied PSF photometry based on the template by Poglitsch et al. (2010). 6We corrected for the mapping artifact visible around the source in Fig. 1.
The SEDs were fitted with modified Planck black-body functions accounting for the wavelength-dependent emissivity of the dust. The assumed dust composition follows Ossenkopf & Henning (1994), and the assumed gas-to-dust mass ratio is 100. The data longward of 70 m can be well fitted with a single black-body function of cold dust and gas (Fig. 2). We also fitted the data for smaller apertures ignoring the less resolved 350 and 500 m SPIRE data points, and the derived temperatures agree well with our presented fits. Therefore, on the scales resolvable by these data for the cold dust and gas components, single component fits are still adequate. Furthermore, detections at 24 m and shorter wavelengths for IRDC 18223-3 and IRAS 18223-1243 indicate additional inner heating sources. This implies a temperature gradient throughout the inner core for these more evolved regions. However, a sophisticated radiative transfer modeling is out of the scope of this letter. Although nominally one can fit a second component to this warmer gas (Fig. 2), only the luminosities of these components are useful parameters, while masses and temperatures are poorly constrained because of rising optical depth at shorter wavelengths. It should be noted that in particular for IRDC 18223-3 this additional luminosity only barely contributes to the total luminosity, consistent with pre-Herschel fits (Beuther & Steinacker, 2007). The gas masses calculated from the fits using the Ossenkopf & Henning (1994) dust model with thin ice mantles can be considered as lower limits. Hence, we also calculated the gas masses from the 850 m data assuming optically thin dust continuum emission, a dust spectral index (corresponding to a dust absorption coefficient cm2g-1) resembling the general ISM (Hildebrand, 1983; Hunter et al., 2000), and the temperatures from the cold component fits. Another quantity to differentiate evolutionary stages is the ratio of bolometric to submillimeter luminosity that is usually applied to low-mass protostars but is also discussed in the high-mass regime (e.g., Andre et al. 1993; Mueller et al. 2002). Table 2 lists the derived parameters.
| [K] | [M⊙] | [L⊙] | [L⊙] | [L⊙] | [M⊙] | ||
|---|---|---|---|---|---|---|---|
| 18223-12 | 31 | 189 | 13849 | 3898 | 155 | 115 | 452 |
| 18223-3 | 18 | 212 | 566 | 36 | 54 | 11 | 413 |
| 18223-s2 | 16 | 102 | 157 | – | 21 | 8 | 169 |
| 18223-s1 | 18 | 142 | 372 | – | 36 | 10 | 249 |
, , and are fit results. is the submm luminosity (longward of 400 m, and is the mass in the derived from only the 850 m flux (see main text).
4 Discussion and conclusion
These regions represent a potential evolutionary sequence where IRDC 18223-south1 resembles the youngest detectable stage with a large emission peak of cold dust continuum emission on the Rayleigh-Jeans tail of the SED longward of 160 m. However, at 100 m the source is lost in the background, and at shorter wavelengths it remains an absorption shadow. The source IRDC 18223-south2 appears a bit more evolved because one detects an emission source from 70 m to longer wavelengths. Nevertheless, the region is still young and cold without any emission at 24 m. Continuing on the evolutionary ladder, IRDC 18223-3 exhibits 24 m emission but remains dark in the IRAC bands. Beuther & Steinacker (2007) called this a high-mass core with an embedded low- to intermediate-mass protostar potentially becoming massive at the end of the evolution. Finally, at the northern end of the filament IRAS 18223-1243 comprises all features of a typical HMPO (Sridharan et al., 2002).
This sequence is also reflected in the SED fitting. For the cold sources, the single black-body fits result in low temperatures between 16 and 18 K, luminosities of only a few hundred L⊙ and gas masses of several hundred M⊙. The luminosities of these cold sources are not related to internal heating, but are mainly produced by the external radiation field. The low temperatures are consistent with previous estimates toward infrared dark clouds based on spectral line observations (e.g., Sridharan et al. 2005; Pillai et al. 2006). We note that our fitted temperatures are also in the range of temperatures derived from COBE for the general ISM (e.g., Reach et al. 1995). On the given scales (0.65 pc) at these early evolutionary stages, the gas and dust clumps still have temperatures comparable to those of the general ISM. For the most evolved HMPO, the fitted cold temperature is warmer than for the other sources. Furthermore, the luminosity already indicates the presence of an HMPO, while the gas reservoir is still large, allowing for further accretion. While the total luminosity compares well with older fits that were only based on IRAS data (Sridharan et al., 2002), the cold temperature of the new fit is lower than those only based on IRAS data (28 versus 50 K, respectively). This is because IRAS alone did not sample the peak of the SED well and hence overestimated the temperature. Therefore sampling the full SED is important even for such evolved sources to derive reasonable temperature estimates.
In the framework of the ratio, the HMPO is above 100 where 200 was defined as the border between class 0 and class I for low-mass sources (Andre et al., 1993). While this cannot easily be translated to high-mass star-forming regions, it shows that even the HMPO is still in a young evolutionary stage (see Sridharan et al. 2002). The three infrared-dark sources all have exceptionally low ratios around 10, lower than the high-mass cores reported by Mueller et al. (2002), and among the lowest values so far reported in the literature (e.g., Young et al. 2003). This supports the extreme youth of these sources. That we do not see a marked difference in for the three infrared-dark sources indicates that – in the evolution of the massive cores – first signatures for star formation do not come from a global warm-up of the bulk of dust and gas. More evolved sources like the HMPO 18223-1243 in turn have multiple T components which show up at mid-infrared wavelengths, but most of the cold dust can still be reasonably well fitted by a higher but single temperature.
While we present here one of the first sources observed with PACS and SPIRE, there is tremendous potential in this kind of observations. For the future we anticipate full radiative transfer modeling of such regions, which will result e.g. in more detailed temperature maps and density structures over the entire field. Furthermore, the Herschel key project EPOS (PI O. Krause) contains more than 40 regions in young evolutionary stages. A combined analysis of the whole sample should result in a robust characterization of the physical properties and early evolution of high-mass star formation.
Acknowledgements.
PACS has been developed by a consortium of institutes led by MPE (Germany) and including UVIE (Austria); KUL, CSL, IMEC (Belgium); CEA, OAMP (France); MPIA (Germany); INAF-IFSI/ OAA/OAP/OAT, LENS, SISSA (Italy); IAC (Spain). This development has been supported by the funding agencies BMVIT (Austria), ESA-PRODEX (Belgium), CEA/CNES (France), DLR (Germany), ASI (Italy), and CICT/MCT (Spain).References
- Andre et al. (1993) Andre, P., Ward-Thompson, D., & Barsony, M. 1993, ApJ, 406, 122
- Bendo et al. (2010) Bendo et al. 2010, A&A, this volume
- Beuther et al. (2002) Beuther, H., Schilke, P., Menten, K. M., et al. 2002, ApJ, 566, 945
- Beuther & Sridharan (2007) Beuther, H. & Sridharan, T. K. 2007, ApJ, 668, 348
- Beuther et al. (2005) Beuther, H., Sridharan, T. K., & Saito, M. 2005, ApJ, 634, L185
- Beuther & Steinacker (2007) Beuther, H. & Steinacker, J. 2007, ApJ, 656, L85
- Carey et al. (2009) Carey, S. J., Noriega-Crespo, A., Mizuno, D. R., et al. 2009, PASP, 121, 76
- Churchwell et al. (2009) Churchwell, E., Babler, B. L., Meade, M. R., et al. 2009, PASP, 121, 213
- Cyganowski et al. (2008) Cyganowski, C. J., Whitney, B. A., Holden, E., et al. 2008, AJ, 136, 2391
- Di Francesco et al. (2008) Di Francesco, J., Johnstone, D., Kirk, H., MacKenzie, T., & Ledwosinska, E. 2008, ApJS, 175, 277
- Fallscheer et al. (2009) Fallscheer, C., Beuther, H., Zhang, Q., Keto, E., & Sridharan, T. K. 2009, A&A, 504, 127
- Garay et al. (2004) Garay, G., Faúndez, S., Mardones, D., et al. 2004, ApJ, 610, 313
- Griffin et al. (2010) Griffin et al. 2010, A&A, this volume
- Hildebrand (1983) Hildebrand, R. H. 1983, QJRAS, 24, 267
- Hunter et al. (2000) Hunter, T. R., Churchwell, E., Watson, C., et al. 2000, AJ, 119, 2711
- Motte et al. (2007) Motte, F., Bontemps, S., Schilke, P., et al. 2007, A&A, 476, 1243
- Mueller et al. (2002) Mueller, K. E., Shirley, Y. L., Evans, N. J., & Jacobson, H. R. 2002, ApJS, 143, 469
- Ossenkopf & Henning (1994) Ossenkopf, V. & Henning, T. 1994, A&A, 291, 943
- Pilbratt et al. (2010) Pilbratt, G., Riedinger, J., Passvogel, T., et al. 2010, A&A, this volume
- Pillai et al. (2006) Pillai, T., Wyrowski, F., Carey, S. J., & Menten, K. M. 2006, A&A, 450, 569
- Poglitsch et al. (2010) Poglitsch, A., Waelkens, C., Geis, N., et al. 2010, A&A, this volume
- Rathborne et al. (2006) Rathborne, J. M., Jackson, J. M., & Simon, R. 2006, ApJ, 641, 389
- Reach et al. (1995) Reach, W. T., Dwek, E., Fixsen, D. J., et al. 1995, ApJ, 451, 188
- Sridharan et al. (2005) Sridharan, T. K., Beuther, H., Saito, M., Wyrowski, F., & Schilke, P. 2005, ApJ, 634, L57
- Sridharan et al. (2002) Sridharan, T. K., Beuther, H., Schilke, P., Menten, K. M., & Wyrowski, F. 2002, ApJ, 566, 931
- Young et al. (2003) Young, C. H., Shirley, Y. L., Evans, II, N. J., & Rawlings, J. M. C. 2003, ApJS, 145, 111