22institutetext: School of Physical & Geographical Sciences, Lennard-Jones Laboratories, Keele University, Staffordshire ST5 5BG, UK
33institutetext: Department of Physics and Astronomy, University College London, Gower Street, London WC1E 6BT
44institutetext: Spitzer Science Center, California Institute of Technology, MS 220-6, Pasadena, CA 91125
55institutetext: Stratospheric Observatory for Infrared Astronomy, Universities Space Research Association, Mail Stop 211-3, Moffett Field, CA 94035
66institutetext: CEA, Laboratoire AIM, Irfu/SAp, Orme des Merisiers, F-91191 Gif-sur-Yvette, France
77institutetext: Steward Observatory, University of Arizona, 933 North Cherry Ave., Tucson, AZ 85721, USA
88institutetext: Jodrell Bank Centre for Astrophysics, Alan Turing Building, School of Physics & Astronomy, University of Manchester, Oxford Road, Manchester M13 9PL, United Kingdom
99institutetext: Department of Astronomy, Cornell University, Ithaca, NY 14853, USA
Dust in the bright supernova remnant N49 in the LMC ††thanks: Herschel is an ESA space observatory with science instruments provided by European-led Principal Investigator consortia and with important participation from NASA.
We investigate the dust associated with the supernova remnant (SNR) N49 in the Large Magellanic Cloud (LMC) as observed with the Herschel Space Observatory. N49 is unusually bright because of an interaction with a molecular cloud along its eastern edge. We have used PACS and SPIRE to measure the far IR flux densities of the entire SNR and of a bright region on the eastern edge of the SNR where the SNR shock is encountering the molecular cloud. Using these fluxes supplemented with archival data at shorter wavelengths, we estimate the dust mass associated with N49 to be about 10 . The bulk of the dust in our simple two-component model has a temperature of 20-30 K, similar to that of nearby molecular clouds. Unfortunately, as a result of the limited angular resolution of Herschel at the wavelengths sampled with SPIRE, the uncertainties are fairly large. Assuming this estimate of the dust mass associated with the SNR is approximately correct, it is probable that most of the dust in the SNR arises from regions where the shock speed is too low to produce significant X-ray emission. The total amount of warm 50-60 K dust is 0.1 or 0.4 , depending on whether the dust is modeled in terms of carbonaceous or silicate grains. This provides a firm lower limit to the amount of shock heated dust in N49.
Key Words.:
ISM: supernova remnants: SNR N49; ISM: dust; Galaxies:Magellanic Clouds; Submillimeter: ISM1 Introduction
N49 is a bright X-ray and optical supernova remnant (SNR) in the Large Magellanic Cloud (Long et al. 1981), associated with a soft gamma ray repeater (Cline et al 1982) and unresolved X-ray point source (Rothschild et al. 1994). It has an asymmetric surface-brightness distribution at essentially all wavelengths, which is due to an interaction with a molecular cloud that is located on the southeast limb of the SNR (Vancura et al. 1992; Banas et al 1997). Based on a simple Sedov model for the SNR, Hughes et al. (1998) concluded that the swept-up mass was the order of 200 . Park et al. (2003) recently conducted a detailed study of its X-ray properties using Chandra, confirming that the SNR is relatively young, on the order of 6 000 yrs. They find that although most of the emission is dominated by interstellar material (ISM), the Chandra observations appear to show “explosion fragments” on the SW side of the SNR in X-rays. According to Bilikova et al. (2007), the X-ray temperature (1.2107 K) implies a shock velocity of 920 km s-1, while the optical filaments which reflect shocks traversing denser gas have typical line-of-sight velocities of 250 km s-1. Hill et al. (1995) estimated the mass of the progenitor of N49 to be about 20 based on the association with the 10 Myr old association LH 53. A 1720 MHz OH maser emission comes from a region toward the southwest. N49 is almost certainly the result of a Type II explosion.
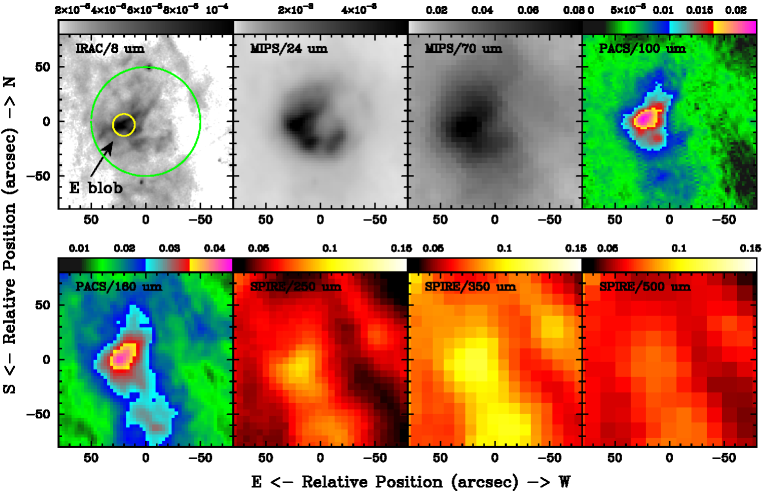
Apparently first detected at mid-IR wavelengths with IRAS (Graham et al. 1987), the first mid-IR images of the SNR were obtained with Spitzer (Williams, R. et al. 2006), where N49 is visible not only in the MIPS 24 and 70 m bands, but also in the IRAC 3.6, 4.5, 5.6 and 8 m bands. IRS spectra of the eastern limb show strong line emission from O, Ne, Ar, Si, S, and Fe and H2 in the 5-37 m band (Williams, R. et al 2006). While lines and dust emission compete at the short wavelengths, van Loon et al (2010) showed with the low resolution MIPS spectra of the bright blob on the eastern limb that dust is the dominant source of emission at 70 m, and estimated a dust mass for N49 of 0.2 .
Dust in SNRs can arise either from the SN itself or from the ISM. Ejecta dust is thought to play a key role as a coolant in the formation of high-redshift galaxies (see, e.g. Morgan & Edwards 2003). However, given the amount of swept-up material in N49, most of the dust in N49 is expected to be of interstellar origin.
Here we describe observations of N49 obtained with the Herschel Space Observatory. Our primary purpose is to explore the properties of dust in N49, and to obtain a better estimate of the dust mass than was heretofore possible by probing the longer wavelength bands, where larger dust grains are expected to be more apparent. Combining Herschel data and data obtained from other observatories, we construct spectral energy distributions (SEDs) of the entire SNR and of a bright blob on the eastern limb, where the SNR is interacting with a molecular cloud. (see, e.g. van Loon et al. 2010). We use a simple two-temperature model of the SED to estimate dust masses and temperatures.
2 Observations and data reduction
N49 was observed with Herschel as part of the science demonstration program associated with the HERITAGE program ( PI: M.Meixner). The observations and the data reduction process for the PACS green and red bands (100/160 m) and SPIRE all bands (250/350/500 m) are described by Meixner, et al. (2010).
To complement the Herschel data, we used archival Spitzer/IRS low- and high-resolution spectra (5-40 m; PI: Gehrz) of the eastern blob (E blob, hereafter), Spitzer/IRAC 3.6/4.5/5.8/8.0 m and MIPS 24/70 m images (Meixner et al. 2006), and the published 3/7/11/15/24 m fluxes for whole SNR (Seok et al. 2008) taken by the AKARI/IRC (Murakami et al. 2007; Onaka et al. 2007). We indicate the position of the E blob in Fig 1. We rescaled the flux density of the IRS spectrum by a factor of 1.25 in order to match the total flux between 20.34 and 29.46 m of the IRS spectrum and the MIPS 24 m flux. We used the reductions of the IRS and the MIPS spectra (52-93 m) of the E blob made by Kemper et al. (2010) as part the SAGE-Spec project. The MIPS spectrum has been described in detail by van Loon et al. (2010).
Selected Spitzer and Herschel images are presented in Fig 1. Although the angular resolution of PACS at 100 and 160 m is comparable to that of MIPS 24 and 70 m, the resolution of SPIRE is such that it becomes increasingly difficult to distinguish the SNR from the surrounding molecular clouds. The intensity of the E blob becomes comparable to the southern molecular clouds at longer wavelengths. There is no obvious difference however in the morphology of the SNR as a function of wavelength, although at long wavelengths, where the resolution is poorer, it becomes increasingly difficult to pick out the shell of the SNR. The general interpretation that the SNR is interacting with a molecular cloud on the SE is confirmed by the Herschel images.
To estimate flux densities, we performed aperture photometry. We used 50′′ and 10′′ radius regions to define the entire SNR and the eastern blob, respectively (see Fig 1). We subtracted background from an annulus centered on the SNR with inner and outer radii of 110′′ and 130′′. In the IRAC 8 m image of Fig 1, the two regions are indicated as green (50′′ radius) and yellow (10′′) circles. We performed aperture corrections using observed or theoretical point-spread functions. The measured fluxes are listed in Table 1. The absolute flux calibration is 2 and 5 for MIPS 24 and 70 m bands and is 20 for PACS (Poglitsch et al. 2010) and 15 for SPIRE (Swinyard, Ade, & Baluteau 2010), respectively. We adopted these values as the flux density uncertainty for these bands. We did not include uncertainties associated with the subtraction of background, but these are at least as large in the SPIRE bands as the uncertainty in the flux calibration. For the other bands, the uncertainty in Table 1 corresponds to the standard deviation of the background.
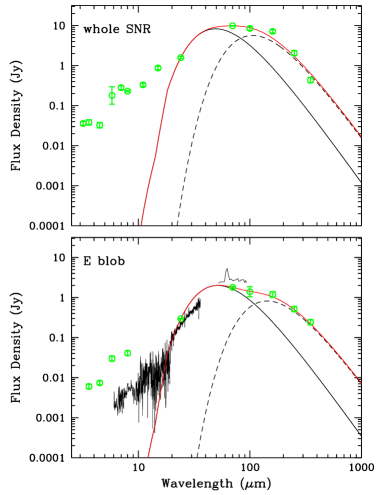
The SEDs are presented in Fig 2 for the entire SNR and for the E-blob alone. There are no obvious differences aside from normalization in the two spectra. Williams, R. et al. (2006), based on an early reduction of the IRS spectrum, argued that the emission lines rather than the dust continuum dominate the flux in the MIPS 24 m band. However, our improved reduction of the IRS spectrum shows an obvious dust continuum. Our estimate based on the full 9.7 m width of the MIPS 24 m band is that emission lines contribute about 38 % of the flux. The fluxes plotted at 24 m in Fig 2 represent the continuum flux, assuming that the line contribution is the same for the entire SNR as for the region covered by the IRS spectrum. At wavelengths of 70 m and longer, the radiation from dust grains in the SNR is the main luminosity source. van Loon et al. (2010) found dominant [O i] 63 m line in the MIPS 70 m band to contribute only 11% of the total emission in that band. Furthermore, based on this, the expected [O i] 146 m (-) flux is 3.4-7.210-13 erg s-1 cm-2 when assuming the electron temperature to be 104 K and a density 10-104 cm-3. The contribution of [O i] 146 m in the PACS 160 m band is 7.
| (Jy) | |||
| (m) | whole SNR | E blob | source |
| 3.2 | (3.6 0.4)10-2 | (1) | |
| 3.6 | (3.8 0.6)10-2 | (6.0 0.8)10-3 | (2) |
| 4.5 | (3.2 0.5)10-2 | (7.4 0.8)10-3 | (2) |
| 5.8 | (1.8 0.9)10-1 | (3.0 0.4)10-2 | (2) |
| 7.0 | (2.8 0.3)10-1 | (1) | |
| 8.0 | (2.3 1.0)10-1 | (4.1 0.5)10-2 | (2) |
| 11 | (3.3 0.3)10-1 | (1) | |
| 15 | (8.7 0.9)10-1 | (1) | |
| 24 | 1.6 0.1 | (30 0.6)10-2 | (2) |
| 70 | 9.9 0.5 | (18 0.9)10-1 | (2) |
| 100 | 8.5 1.7 | 1.4 0.4 | (3) |
| 160 | 7.2 1.4 | 1.2 0.2 | (3) |
| 250 | 2.1 0.3 | (5.3 0.8)10-1 | (3) |
| 350 | (5.0 0.8)10-1 | (2.8 0.4)10-1 | (3) |
| 500 | (1.0 0.2)10-1 | (3) | |
| part | dust | comp. | ||
|---|---|---|---|---|
| spices | (K) | () | ||
| SNR | carbon | warm | 62 2 | 0.10 0.02 |
| cold | 26 2 | 8.7 1.0 | ||
| silicate | warm | 57 2 | 0.4 0.06 | |
| cold | 27 2 | 12 2 | ||
| E blob | carbon | warm | 59 2 | 0.04 0.01 |
| cold | 19 2 | 4.2 1.7 | ||
| silicate | warm | 57 1 | 0.10 0.01 | |
| cold | 21 1 | 6.1 2.2 |
3 Dust mass in the N49 system and discussion
We estimated the dust mass with the line-contribution-subtracted data and its temperature through SED fitting. First, we estimated the contribution of the synchrotron emission to the mid- to far-IR region. Dickel & Milne (1998) measured the flux densities at 3.5/6/13/20 cm for the whole SNR. By extrapolating the flux densities at this radio wavelength to the mid-IR region, we found that the contribution is negligibly small (2 ) to the 24/70/100/160/250 m flux densities. In the SPIRE 350/500 m bands, the contribution is large; 14 for 350 m and 79 for 500 m. Before fitting, we subtracted the contribution of the synchrotron emission to the 350 m flux density for the whole SNR and E blob, assuming that the contribution can be also applied to the E blob. In the fittings we excluded 500 m data.
When we assume optically thin thermal radiation at a dust temperature of a component and a single dust species with the radius , the observed flux density is written by
| (1) |
where is the dust mass of the component , () is the Planck function of , and is the absorption efficiency, is the dust grain density and is a distance to the observed dust from us (Kwok 2007). Here, we adopted =50 kpc (Schaefer 2008). We considered two types of grains, amorphous carbon and silicates. For amorphous carbon the optical constants were taken from Zubko et al. (1996). We adopted =2.26 g cm-3. To simplify the model, we assume = 0.1m uniform grain radius. Next, we considered astronomical silicate only. The optical constants were taken from Draine & Lee (1984) and a of 3.6 g cm-3 was adopted. Due to the lower absorption efficiency at 70 m than amorphous carbon, a larger dust mass would be estimated. The dust mass estimated for the silicate-only case would be an upper limit. In the fittings we found the best fit and to the observations by least-square technique. In this process, and are the free parameters, and all the data are equal of weight.
We first considered a single temperature model to fit the SED. For the whole SNR, the best fit had a of 33 K and 34 K for amorphous carbon and for silicate respectively, and a derived of 3.6 and 4.6 . For the E blob, is 35 K (carbon case) and 39 K (silicate case), and is 0.47 and 0.60 . The temperature is fairly similar to the temperature derived by Graham et al. (1987) from IRAS data. However, we found that a better fit could be obtained if we considered a model with two-temperatures instead of one. The one-component fittings cannot simultaneously explain the 24 m and 160 m flux. The implied dust masses and temperatures for the two-temperate model are summarized in Table 2 for the two types of grains.
The best-fit two-temperature model, assuming silicate grains, for the SEDs is shown in Fig 2. The warm component has a temperature of 60 K, and is surely due to dust in shocked gas, while the cold component has a temperature of 20 K, similar to that found in molecular clouds (16-24 K, Bernard et al. 2008; Gordon et al. in 2010). The contribution from the cold component to the total flux in the Herschel bands is 80 . The dust mass and temperature of the warm component in the E blob are very close to van Loon et al. (2010; 0.2 and 43 K). The total mass of dust associated with N49 is about 10 and is dominated by dust at cold temperatures, dust which was difficult to observe with Spitzer. It is tempting therefore to identify the warm component with dust in the X-ray plasma and the cool component not with the SNR, but with the molecular cloud. However, this assignment is very uncertain, because dust temperature variations are also expected as a result of the large variations of post-shock gas density that are known to exist in N49.
To place SNR N49’s dust mass estimate into the context of SNR development, we plot the dust mass vs. age for all LMC and SMC SNRs studied to data, as noted in Fig 3. Note that except for N49 the dust masses are estimated based on 70 m data. The relation can be with the free expansion phase early on, followed by a Sedov phase (radius (age)2/5; cf. Badenes et al. 2010).
The mass of the warm dust component in N49 is 0.1 assuming amorphous carbon and 0.4 assuming silicates. Adopting a dust-to-gas mass ratio of 250 (Meixner et al. 2010) and assuming that only the warm dust is associated with shocked gas, the swept-up mass of the SNR ranges from 25 to 100 . This is comparable to the mass estimated from X-ray observations, 200 (Hughes et al. 1998), assuming the true grain characteristics are similar to those of silicates. A much higher (25 larger) swept-up mass is estimated if we included the cold dust in our estimate, which suggests that in the context of our simple model there is a significant molecular cloud component to the cold dust we associate with the SNR, and that the shocks propagating into the molecular cloud may be too slow to produce X-rays. While more sophisticated modeling of N49 may refine the mass estimates somewhat, the basic limitation in arriving at a more precise picture of the nature of the interaction with the molecular cloud and the amount of shocked molecular gas in N49 is the limited angular resolution of Herschel at longer wavelengths.

Acknowledgments
We acknowledge financial support from the NASA Herschel Science Center, JPL contract # 1381522. We are grateful for the contributions and support from the European Space Agency (ESA), the PACS and SPIRE teams, the Herschel Science Center and the NASA Herschel Science Center (esp. A. Barbar and K. Xu) and the PACS and SPIRE instrument control center at CEA-Saclay, without which none of this work would be possible.
References
- Badenes et al. (2010) Badenes, C., Maoz, D., & Draine, B. 2010, arXiv:1003.3030
- Banas et al. (1997) Banas, K. R., Hughes, J. P., Bronfman, L., & Nyman, L.-A. 1997, ApJ, 480, 607
- Bernard et al. (2008) Bernard, J.-P., et al. 2008, AJ, 136, 919
- Bilikova et al. (2007) Bilikova, J., Williams, R. N. M., Chu, Y.-H., Gruendl, R. A., & Lundgren, B. F. 2007, AJ, 134, 2308
- Cline et al. (1980) Cline, T. L., et al. 1980, ApJ, 237, L1
- (6) Dickel, J. R., Milne, D. K. 1998, ApJ, 115, 1057
- Draine & Lee (1984) Draine, B. T., & Lee, H. M. 1984, ApJ, 285, 89
- (8) Gordon, K. et al. in this issue
- Graham et al. (1987) Graham, J. R., Evans, A., Albinson, J. S., Bode, M. F., & Meikle, W. P. S. 1987, ApJ, 319, 126
- Hill et al. (1995) Hill, R. S., Cheng, K.-P., Bohlin, R. C., O’Connell, R. W., Roberts, M. S., Smith, A. M., & Stecher, T. P. 1995, ApJ, 446, 622
- Hughes et al. (1998) Hughes, J. P., Hayashi, I., & Koyama, K. 1998, ApJ, 505, 732
- Kemper et al. (2010) Kemper, F., et al. 2010, arXiv:1004.1142
- Kwok (2007) Kwok, S. 2007, “Physics and Chemistry of the Interstellar Medium” University Science Books, 2007.
- Long et al. (1981) Long, K. S., Helfand, D. J., & Grabelsky, D. A. 1981, ApJ, 248, 925
- (15) Meixner, M. et al. in this issue
- Meixner et al. (2006) Meixner, M., Gordon, K., Indebetouw, R. et al. 2006, AJ, 132, 2268
- (17) Morgan, H. L, Edmunds, M. G., 2003, MNRAS 343, 427
- Murakami et al. (2007) Murakami, H., et al. 2007, PASJ, 59, 369
- Onaka et al. (2007) Onaka, T., et al. 2007, PASJ, 59, 401
- Park et al. (2003) Park, S., Burrows, D. N., Garmire, G. P., Nousek, J. A., Hughes, J. P., & Williams, R. M. 2003, ApJ, 586, 210
- (21) Poglitsch et al. in this issue
- Rho et al. (2009) Rho, J., Reach, W. T., Tappe, A., Hwang, U., Slavin, J. D., Kozasa, T., & Dunne, L. 2009, ApJ, 700, 579
- Rothschild et al. (1994) Rothschild, R. E., Kulkarni, S. R., & Lingenfelter, R. E. 1994, Nature, 368, 432
- Sandstrom et al. (2009) Sandstrom, K. M., Bolatto, A. D., Stanimirović, S., van Loon, J. T., & Smith, J. D. T. 2009, ApJ, 696, 2138
- (25) Schaefer, B.E., 2008, ApJ, 135, 112
- Seok et al. (2008) Seok, J. Y., et al. 2008, PASJ, 60, 453
- (27) Swinyard, B. M., Ade, P., & Baluteau, J.-P. 2010, in this issue
- Vancura et al. (1992) Vancura, O., Blair, W. P., Long, K. S., & Raymond, J. C. 1992, ApJ, 394, 158
- van Loon et al. (2010) van Loon, J. T., et al. 2010, AJ, 139, 68
- Williams et al. (2008) Williams, B. J., et al. 2008, ApJ, 687, 1054
- Williams et al. (2006) Williams, B. J., et al. 2006, ApJ, 652, L33
- Williams et al. (2006) Williams, R. M., Chu, Y.-H., & Gruendl, R. 2006, AJ, 132, 1877
- Zubko et al. (1996) Zubko, V. G., Mennella, V., Colangeli, L., & Bussoletti, E. 1996, MNRAS, 282, 1321