The Aquila prestellar core population revealed by Herschel ††thanks: Herschel is an ESA space observatory with science instruments provided by European-led Principal Investigator consortia and with important participation from NASA. ††thanks: Figures 3, 4, 5, and 6 are only available in electronic format via http://edpsciences.org
The origin and possible universality of the stellar initial mass function (IMF) is a major issue in astrophysics. One of the main objectives of the Gould belt survey is to clarify the link between the prestellar core mass function (CMF) and the IMF. We present and discuss the core mass function derived from data for the large population of prestellar cores discovered with SPIRE and PACS in the Aquila Rift cloud complex at pc. We detect a total of 541 starless cores in the entire 11 deg2 area of the field imaged at 70–500 m with SPIRE/PACS. Most of these cores appear to be gravitationally bound, and thus prestellar in nature. Our results confirm that the shape of the prestellar CMF resembles the stellar IMF, with much higher quality statistics than earlier submillimeter continuum ground-based surveys.
Key Words.:
ISM: individual objects (Aquila Rift complex) – Stars: formation1 Introduction
The question of the origin and possible universality of the IMF, which is crucial for both star formation and galactic evolution, remains a major open problem in astrophysics. The Space Observatory (Pilbratt et al. 2010), equipped with its two imaging cameras SPIRE (Griffin et al. 2010) and PACS (Poglitsch et al. 2010), provides a unique tool to address this fundamental issue. This problem and other key questions about the earliest phases of star formation and evolution are central to the scientific motivation for the Herschel Gould belt survey, which will image the nearby ( kpc) molecular cloud complexes of the Gould belt using SPIRE at 250–500 m and PACS at 70–160 m (cf. André & Saraceno 2005 and André et al. 2010).
Starting with the 1.2 mm continuum study of the Ophiuchus main cloud by Motte et al. (1998), several ground-based (sub)-millimeter dust continuum surveys of nearby, compact cluster-forming clouds such as Ophiuchi, Serpens, and Orion B have uncovered ’complete’ (but small) samples of prestellar cores whose associated core mass functions (CMF) resemble the stellar IMF (e.g., Motte et al. 1998; Johnstone et al. 2000; Enoch et al. 2006; Nutter & Ward-Thompson 2007; – see also Alves et al. 2007 and André et al. 2007). Albeit limited by small-number statistics at both ends of the CMF, these findings favor theoretical scenarios according to which the bulk of the IMF of solar-type stars is largely determined by pre-collapse cloud fragmentation, prior to the protostellar accretion phase (e.g., Hennebelle & Chabrier 2008). The problem of the origin of the IMF may thus largely reduce to a good understanding of the processes responsible for the formation and evolution of prestellar cores within molecular clouds. Apart from limited statistics, another limitation of ground-based submillimeter continuum determinations of the CMF is that they rely on uncertain assumptions about the dust properties (temperature and emissivity). is now making it possible to dramatically improve the quality of the statistics and to reduce the core mass uncertainties by performing direct measurements of the dust temperatures.
In this Letter, we use the initial results of the Gould belt survey, obtained toward the Aquila Rift complex as part of the science demonstration phase (SDP) of Herschel, to present the first CMF derived from data. We discuss the robustness of the resulting CMF based on several tests and simulations.
The Aquila molecular cloud complex is located at the high Galactic-longitude end of the Aquila Rift, in the neighbourhood of the Serpens star-forming region. Here we adopt a distance of 260 pc for the Aquila star-forming complex. For a detailed introduction of the region and a discussion of its distance, we refer the reader to Bontemps et al. (2010).
2 Observations and data reduction
Our observations of the Aquila Rift complex were taken on 24 October 2009 in the SPIRE/PACS parallel-mode. A common 11 deg2 area was covered by both SPIRE and PACS scan maps, with a scanning speed of 60′′s-1. The field was observed twice by performing cross-linked scans in two nearly orthogonal scan directions. The combination of the nominal and orthogonal coverages reduced the effects of 1/ noise (see Sibthorpe et al. 2008).
The PACS 70 m and 160 m data were reduced with HIPE (Ardila et al. 2010) version 3.0. Standard steps of the default pipeline were applied starting from the raw data (level 0). We used file version 1 flat-fielding and responsivity in the calibration tree, instead of the built-in version 3 of those. Therefore, the flux density scale was corrected with the corresponding responsivity correction factors: 1.78 at 70 m, and 1.43 at 160 m. Multi-resolution median transform (MMT) deglitching and second-order deglitching were also applied. Baselines were then subtracted by high-pass filtering, with a median filter width corresponding to the full length (180′–190′) of the scan legs taken from HSPOT (Frayer et al. 2007). The baseline fits were performed on the ’level 1’ data using interpolation for the masked bright sources not to over-subtract true sky emission. In this way, we removed stripes and preserved spatial scales and diffuse emission up to the size of the maps. The final PACS maps were created using the photProject task, which performs simple projection of the data cube on the map grid.
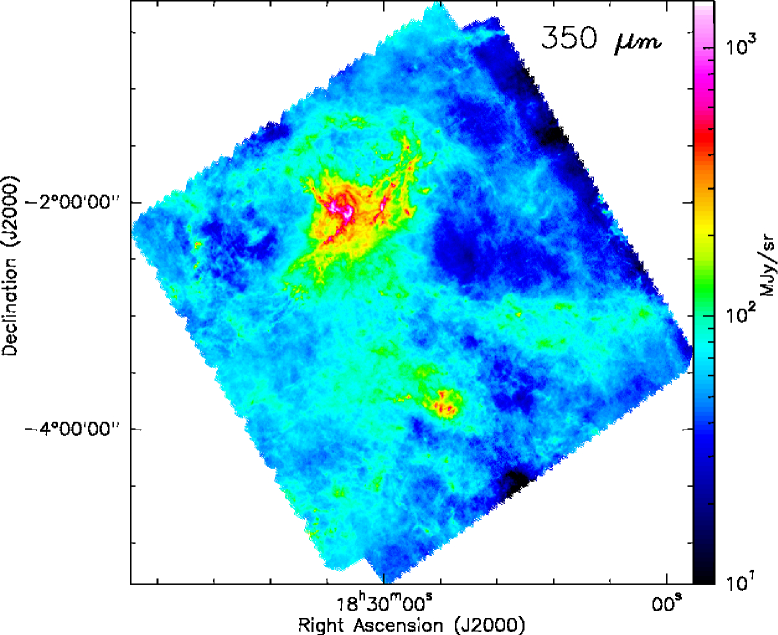
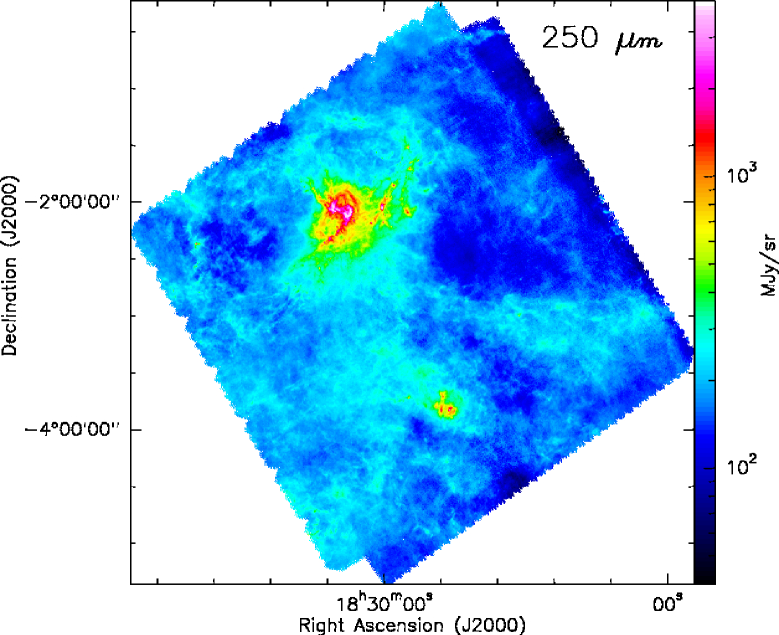
Our SPIRE observations at 250, 350, and 500 m were reduced using HIPE version 2.0 and the pipeline scripts delivered with this version. These scripts were modified, e.g., to include observations taken during the turnaround of the telescope. A median baseline was applied to the maps and the ’naive’ map-making method was used. Online Fig. 3 shows the 500/350/250 m SPIRE images. The PACS 160/70 m images of the same field are shown in Bontemps et al. (2010).
For SPIRE, the absolute calibration uncertanty is estimated to be 15% (Griffin et al. 2010), while for PACS the absolute flux accuracy is within 10% in the blue filter, and better than 20% in the red filter (Poglitsch et al. 2010). The in-flight calibration of the SPIRE instrument is described by Swinyard et al. (2010).
Besides cross-correlating the SPIRE and PACS maps to test their relative astrometry, we compared the astrometry of the images with publicly-available Spitzer 8 m and 24 m data, as well as high-positional accuracy (1′′) 3 mm IRAM Plateau de Bure observations of a small field at the center of the Aquila main filament (Maury et al. in prep.). In this way, we corrected the Herschel images for small astrometric offsets () remaining between the SPIRE and PACS maps, and achieved a final astrometric accuracy better than .


3 Results and analysis
Compact sources were extracted from the SPIRE/PACS images using getsources, a multi-scale, multiwavelength source-finding algorithm briefly described in Men’shchikov et al. (2010). Several sets of extractions were obtained, including one for the entire field and one for the main subfield of the Aquila complex (see Fig. 1). At this early stage of the scientific exploitation of the survey, we only considered robust sources with significant () detections in at least two SPIRE bands, especially since the significance of the sources depends slightly on the adopted set of extractions.
For the Aquila main subfield (see Fig. 1), Spitzer 24 m observations were used in combination with PACS 70 m data to distinguish between starless cores and young (proto)stellar objects (YSOs). In this subfield, objects detected in emission above the 5 level at 70 m and/or 24 m were classified as YSOs, while cores undetected in emission (or detected in absorption) at both 70 m and 24 m were classified as starless. This classification yielded 452 starless cores in the Aquila main subfield.
Outside the main subfield, we had to rely only on our PACS 70 m data to distinguish between starless and protostellar cores. Based on the results obtained in the main subfield, we estimate that the lack of Spitzer 24 m information leads only to a 3% error in the classification. Altogether, we identified a total of 541 starless cores and 201 embedded YSOs in the entire field. The YSOs include 45–60 Class 0 protostars depending on the selection criteria (see Bontemps et al. 2010).
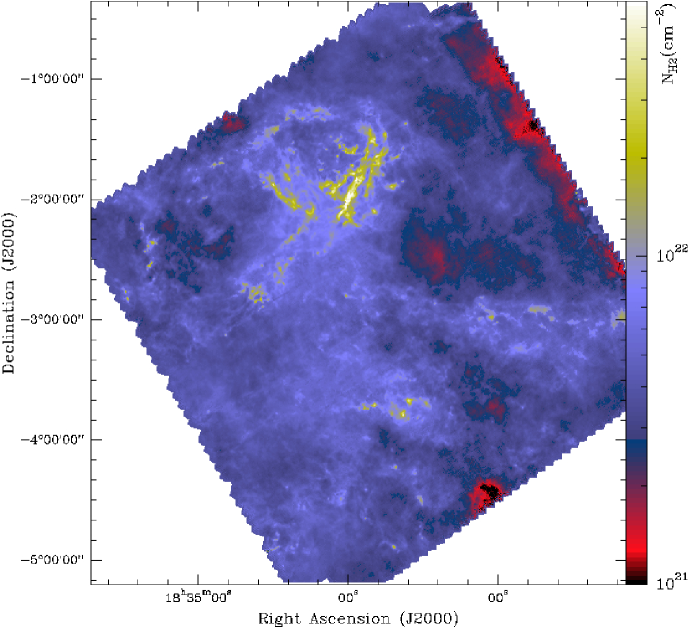
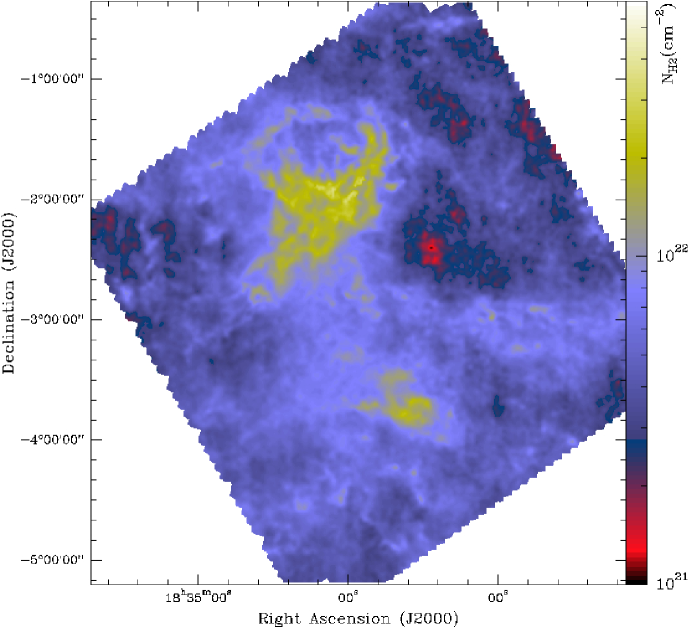
Based on our Herschel data, we constructed dust temperature () and column density () maps. To do this, we first smoothed all Herschel images to the 500 m resolution (36.9′′) and reprojected them to the same 6′′ pixel grid. Weighted spectral energy distributions (SEDs) were then constructed for all map pixels from the 5 observed SPIRE/PACS wavelengths.
Assuming single-temperature dust emission, we fitted each SED by a grey-body function of the form = , where is the observed surface brightness at frequency , is the dust optical depth, and is the dust opacity per unit (dustgas) mass, which was approximated by the power law cm2/g (cf. Beckwith et al. 1990). The dust emissivity index was fixed to 2 (e.g., Hildebrand 1983).
Each SED data point was weighted by 1/, where the rms noise was estimated in an emission-free region of the map at the relevant wavelength, and the calibration uncertainties were also included. The two free parameters and were derived from the grey-body fit to the 5 data points for all pixels for which the fit was successful. Map pixels for which the fit was unsuccessful or unreliable were assigned the median dust temperature of the successful fits. Likewise, the column density along the line of sight to pixels with unreliable fits was estimated directly from the surface brightness measured at the longest wavelength with a reliable detection, assuming the median dust temperature of the successful fits.
A similar SED fitting procedure was employed to estimate the dust temperature, column density, and mass of each core. Here, the SEDs were constructed from the integrated flux densities measured by getsources for the extracted sources. Ignoring the distance uncertainty (see discussion in Appendix A of André et al. 2010), the core mass uncertainty is typically a factor of , mainly due to uncertainties in the dust opacity law ().
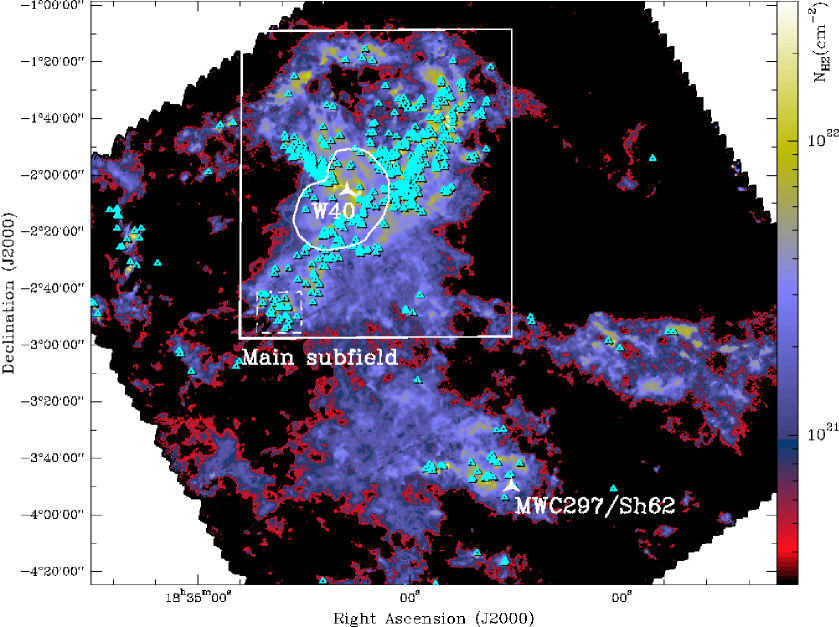
Monte Carlo simulations were carried out to estimate the completeness level of our SPIRE/PACS survey. We first constructed clean maps of the background emission at all wavelengths by subtracting the emission of the compact sources identified with getsources from the SPIRE/PACS images of Aquila. We then inserted a population of model starless cores and model protostars at random positions in the clean-background images to generate a full set of synthetic images of the Aquila region. The model cores were given a realistic mass distribution in the 0.0110 range and were assumed to follow a mass versus size relation. The emission from the synthetic cores was based on spherical dust radiative transfer models (Men’shchikov et al. in prep.). Compact source extraction of several sets of these synthetic skies was performed with getsources in the same way as for the observed images. Based on these simulations, we estimate that our census of prestellar cores is 75% and 85% complete above a core mass of 0.2 and 0.3 M⊙, respectively, in most of the field. Likewise, our census of embedded protostars is more than 90% complete down to . Our survey may however be less complete than these values in the high background region around the W40 PDR (see white polygon in Fig. 1a).
4 Discussion and conclusions
4.1 Prestellar nature of the Aquila starless cores
In this paper, we follow the naming convention that a dense core is called prestellar if it is starless and gravitationally bound (cf. André et al. 2000, Di Francesco et al. 2007). In other words, prestellar cores represent the subset of starless cores that are most likely to form (proto)stars in the future.
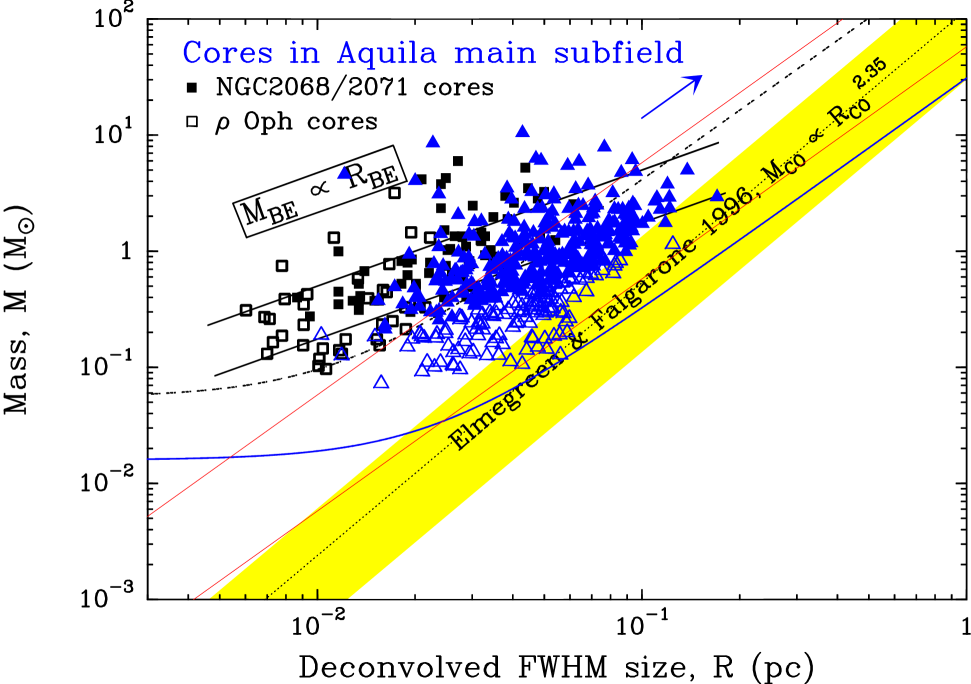
Strictly speaking, spectroscopic observations would be required to derive virial masses for the cores and determine whether they are gravitationally bound or not. However, millimeter line observations in dense gas tracers such as N2H+ show that thermal motions generally dominate over non-thermal motions in starless cores (e.g., André et al. 2007). Assuming that this is indeed the case for the Aquila cores observed here, we may use the critical Bonnor-Ebert (BE) mass, , as a surrogate for the virial mass, where is the BE radius, is the isothermal sound speed, and is the gravitational constant. The critical BE mass may also be expressed as , where is the external pressure, which may be estimated as a function of the column density of the local background cloud, , as (McKee & Tan 2003). For each object, we derived two estimates of the BE mass: (1) as a function of the observed core radius assuming a gas temperature of 10 K, and (2) as a function of the local background column density measured from both our source-subtracted images and the near-IR extinction map of Bontemps et al. (2010 – see also Fig. 6b). We then calculated BE mass ratios of and selected candidate prestellar cores to be the subset of starless cores for which . Based on this criterion, 314 (or ) of the 452 starless cores of the main subfield and 341 (or ) of the 541 starless cores of the entire field were found to be bound and classified as good candidate prestellar cores. These high fractions of bound objects are consistent with the locations of the Aquila starless cores in a mass versus size diagram (see online Fig. 4 for the main subfield and Fig. 4 of André et al. 2010 for the entire field).
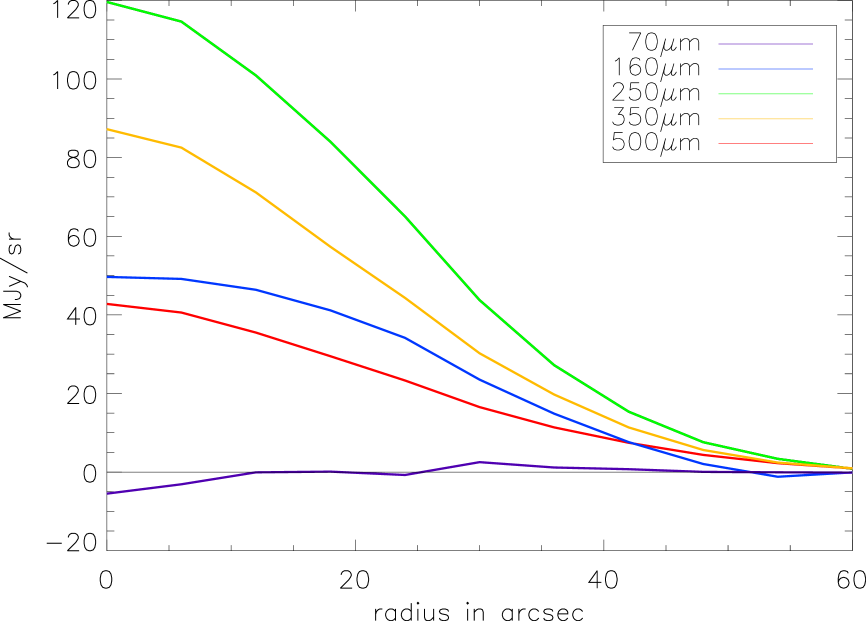
The self-gravitating character of most cores in Aquila is supported further by an independent analysis of their internal column density contrasts. We here define the internal column density contrast of a core as , where and are the peak and mean column densities of the core, respectively. Assuming optically thin dust emission at wavelengths and neglecting any dust temperature/opacity gradient, the internal column density contrast can be estimated from the core intensity values in the same form, as . The internal column density contrast is closely related to the degree of central concentration of a core defined by Johnstone et al. (2000) as . Based on their radial intensity profiles (cf. online Fig. 5b), the Aquila starless cores have a median internal column density contrast . For comparison, the internal column density contrast is larger than 3.6 for supercritical self-gravitating BE spheres, while it is only 1.5 for a uniform-density, non-self-gravitating object (Johnstone et al. 2000).
As a final check, we also estimated the typical column density contrast of the cores over the local background. For a critically self-gravitating BE core, the mean column density is expected to exceed the column density of the local background cloud by a factor of 1.46, if (McKee & Tan 2003). The candidate prestellar cores identified with have a median column density contrast of over the local background, which is consistent with the conclusion that they are self-gravitating.
4.2 Prestellar core mass function in Aquila
Figure 2a shows the mass distribution (CMF) of the 452 starless cores identified in the Aquila main subfield. A power-law fit to the high-mass end of this CMF gives d/dlog for , which is very close to the Salpeter power-law IMF (ddlog – Salpeter 1955). The CMF of the 541 starless cores identified in the entire field, shown by André et al. (2010), has a very similar shape.
The robustness of the derived CMF was tested by selecting several subsets of sources, based e.g., on their physical nature or locations in the SPIRE/PACS maps. In particular, we compared the mass spectrum of starless and prestellar cores. Figure 2a was then compared with Fig. 2b, which shows the differential mass function of 314 bound cores in the main subfield. We obtained the same best-fit power law fit to the high-mass end (d/dlog ) as for Fig. 2a. Only the low-mass end changed when selecting the subset of candidate prestellar cores.
We also selected subsets of starless cores based on their locations in the Aquila field. Along lines of sight to the HII region W40, the associated photon-dominated region (PDR, Shuping et al. 1999) is the source of very strong extended background emission at all infrared wavelengths. The strong background emission in the Spitzer 24 m and PACS 70 m images makes it more difficult to discriminate between YSOs and compact starless cores, implying that our census of starless cores is less reliable in this area. We thus constructed another version of the Aquila main subfield CMF, excluding the 83 cores identified toward the PDR region. The excluded region of unusually high infrared background emission (see in Fig. 1a) was defined using the dust temperature map shown in Bontemps et al. (2010). The high-mass end of this CMF can be fitted by a very similar power law to that of Fig. 2a: d/dlog .
Thanks to the large number of starless cores identified with in Aquila (541 cores in the entire field), we have been able to consider several core subsamples and construct a statistically meaningful CMF in each case. We confirm that the shape of the prestellar CMF resembles the stellar IMF, using data of far higher quality statistics than earlier submillimeter ground-based surveys and more accurate core masses. Based on simulations, we conclude that our mass distributions are robust and do not depend strongly on different sets of extracted sources.
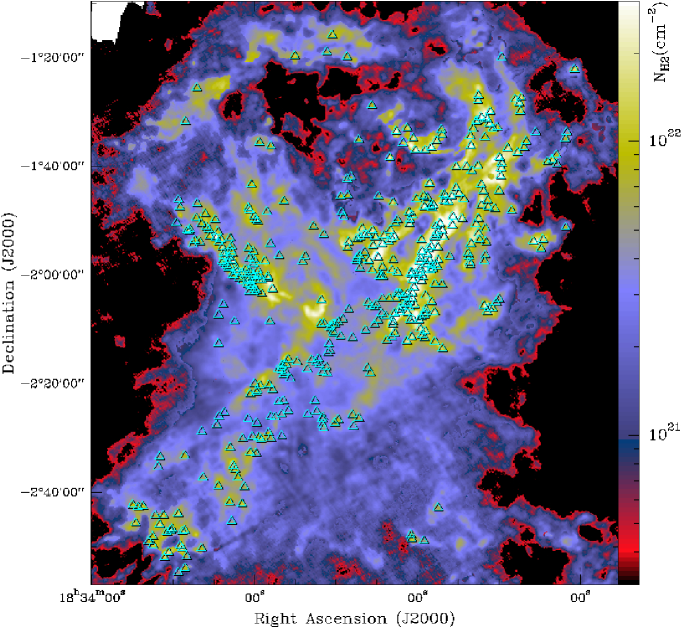
The column density maps shown in Fig. 1 and online Fig. 5 illustrate the tight correlation between the spatial distribution of the prestellar cores and the filamentary structure revealed by the images (Men’shchikov et al. 2010). The difference between our two SDP fields (Aquila Rift and Polaris Flare), in terms of filamentary structure and core mass distribution, is highlighted and discussed in André et al. (2010).
Acknowledgements.
PACS has been developed by a consortium of institutes led by MPE (Germany) and including UVIE (Austria); KUL, CSL, IMEC (Belgium); CEA, OAMP (France); MPIA (Germany); IFSI, OAP/AOT, OAA/CAISMI, LENS, SISSA (Italy); IAC (Spain). This development has been supported by the funding agencies BMVIT (Austria), ESA-PRODEX (Belgium), CEA/CNES (France), DLR (Germany), ASI (Italy), and CICT/MCT (Spain). SPIRE has been developed by a consortium of institutes led by Cardiff Univ. (UK) and including Univ. Lethbridge (Canada); NAOC (China); CEA, LAM (France); IFSI, Univ. Padua (Italy); IAC (Spain); Stockholm Observatory (Sweden); Imperial College London, RAL, UCL-MSSL, UKATC, Univ. Sussex (UK); Caltech, JPL, NHSC, Univ. Colorado (USA). This development has been supported by national funding agencies: CSA (Canada); NAOC (China); CEA, CNES, CNRS (France); ASI (Italy); MCINN (Spain); SNSB (Sweden); STFC (UK); and NASA (USA). V. K. acknowledges support from the ”CONSTELLATION” EC FP6 Marie Curie Research Training Network (MRTN-CT-2006-035890).References
- (1) Alves, J.F., Lombardi, M., Lada, C.J. 2007, A&A, 462, L17
- (2) André, P., Ward-Thompson, D., Barsony, M. 2000, in Protostars & Planets IV, p.59
- (3) André, Ph., & Saraceno P. 2005 in The Dusty and Molecular Universe: A Prelude to Herschel and ALMA, ESA SP-577, p.179
- (4) André, Ph., Belloche, A., Motte, F., Peretto, N. 2007, A&A, 472, 519
- (5) André, Ph., Men’shchikov, A., Bontemps, S., et al. 2010, this volume
- (6) Ardila, D.R., Sci. Ground Segment Cons. 2010, Bulletin of the AAS, 41, 397
- (7) Beckwith, S.V.W., Sargent, A.I., Chini, R.S., Guesten, R. 1990, AJ, 99, 924
- (8) Bontemps, S., André, Ph., Könyves, V., et al. 2010, this volume
- (9) Chabrier, G. 2005, ASSL, 327, 41
- (10) Dame, T.M., & Thaddeus, P. 1985, ApJ, 297, 751
- (11) Di Francesco, J., Evans, II, N.J., Caselli, P., et al. 2007, in Protostars & Planets V, p.17
- (12) Elmegreen, B.G., & Falgarone, E. 1996, ApJ, 471, 816
- (13) Enoch, M.L., Young, K.E., Glenn, J., et al. 2006, ApJ, 638, 293
- (14) Frayer, D.T., NHSC, HSC Teams 2007, Bulletin of the AAS, 38, 108
- (15) Griffin, M.J., Abergel, A., Abreu, A., et al. 2010, this volume
- (16) Hennebelle, P., Chabrier, G. 2008, ApJ, 684, 395
- (17) Hildebrand, R.H. 1983, QJRAS, 24, 267
- (18) Johnstone, D., Wilson, C.D., Moriarty-Schieven, G., et al. 2000, ApJ, 545, 327
- (19) Kramer, C., Stutzki, J., Rohrig, R., Corneliussen, U. 1998, A&A, 329, 249
- (20) Kroupa, P. 2001, MNRAS, 322, 231
- (21) McKee, C.F., & Tan, J.C. 2003, ApJ, 585, 850
- (22) Men’shchikov, A., André, Ph., Didelon, P., et al. 2010, this volume
- (23) Motte, F., André, P., Neri, R. 1998, A&A, 336, 150
- (24) Nutter, D., Ward-Thompson, D. 2007, MNRAS, 374, 1413
- (25) Pilbratt, G.L., Riedinger, J.R., Passvogel, T., et al. 2010, this volume
- (26) Poglitsch, A., Waelkens, C., Geis, N., et al. 2010, this volume
- (27) Salpeter, E.E. 1955, ApJ, 121, 161
- (28) Sibthorpe, B., Chanial, P., Waskett, T.J., Griffin, M.J. 2008, MNRAS, 388, 1787
- (29) Swinyard, B.M., Ade, P.A.R., Baluteau, J.-P., et al. 2010, this volume
3

4
5

6