The Herschel Virgo cluster survey: V. Star-forming dwarf galaxies - dust in metal-poor environments††thanks: Herschel is an ESA space observatory with science instruments provided by European-led Principal Investigator consortia and with important participation from NASA.
We present the dust properties of a small sample of Virgo cluster dwarf galaxies drawn from the science demonstration phase data set of the Herschel Virgo Cluster Survey. These galaxies have low metallicities (7.8 12 + log(O/H) 8.3) and star-formation rates 10-1 M⊙ yr-1. We measure the spectral energy distribution (SED) from 100 to 500 m and derive dust temperatures and dust masses. The SEDs are fitted by a cool component of temperature T 20 K, implying dust masses around 105 M⊙ and dust-to-gas ratios within the range 10-3-10-2. The completion of the full survey will yield a larger set of galaxies, which will provide more stringent constraints on the dust content of star-forming dwarf galaxies.
Key Words.:
Galaxies: dwarf; Galaxies: ISM; (ISM:) dust; Infrared: ISM1 Introduction
Late-type dwarf galaxies are metal-poor systems, and they represent unique environments to investigate the properties of dust in the low-metallicity regime. Mid/far-infrared (MIR/FIR) and submillimetre (submm) observations have provided information about the different dust components in dwarfs, showing that even metal-poor galaxies may host a significant amount of dust (Thuan et al. 1999; Houck et al. 2004; Engelbracht et al. 2008). While the majority of the studies to date have focused mainly on bright and isolated dwarfs (Galliano et al. 2003; Hunt et al. 2005; Galliano et al. 2005; Galametz et al. 2009), little is known about the interplay between the environment and the dust properties of low-mass and low-metallicity systems.
It is still unclear whether most of the dust mass in these systems is at very low temperature (T 10 K), as the excess emission in the submm observed in some dwarfs might suggest (Madden 2002; Galliano et al. 2005; Galametz et al. 2009). This cold dust component may either be associated with the star-forming regions, residing in clumpy molecular complexes (Galliano et al. 2003), or extend beyond the optical disc following the distribution of the neutral hydrogen (Hi; Popescu et al. 2002). However, the main objection to this interpretation is the high dust mass associated with the cold dust, and alternative explanations have been proposed (see Bendo et al. 2010, and references therein). For example, Lisenfeld et al. (2002) used a mixed dust model (Desert et al. 1990) of large and small grains, finding that a high abundance of small grains (compared to the Milky Way) with a shallow emissivity () may account for the excess submm emission in NGC 1569. Zhu et al. (2009) applied a similar approach to the starburst spiral galaxy NGC 3310 without introducing a cold dust component. Only additional measurements in the FIR/submm regime and the analysis of a larger sample of galaxies can help us properly assess the issue of dust at low temperatures.
The Herschel Space Observatory (Pilbratt et al. 2010) allows us for the first time to study the wavelength range between 200 and 500 m, where the emission from cold dust is expected to be the most prominent. As part of the Herschel Open Time Key Project, the Herschel Virgo Cluster Survey111http://www.hevics.org (HeViCS; Davies et al. 2010) will map an area of 64 square degrees of the Virgo cluster with PACS (Poglitsch et al. 2010) and SPIRE (Griffin et al. 2010) to investigate the dust content of the different morphological types within the cluster. The dwarf galaxy population of the Virgo cluster is dominated by dwarf ellipticals, but also contains a non-negligible fraction ( 10%) of late-type dwarfs with signs of current star formation activity (Binggeli et al. 1987). In this Letter, we present the dust properties of three of these galaxies detected with PACS and SPIRE in the HeViCS Science Demonstration Phase (SDP) data set, a 4 field covering the central region of the cluster.

2 Sample selection
The HeViCS SDP field contains 28 late-type low-luminosity galaxies classified in the Virgo Cluster Catalog (VCC, Binggeli et al. 1985) as Sm (7), Im (12), blue compact dwarfs (BCDs) (6), and dwarf irregulars (3). Three of the BCDs have been detected with PACS and SPIRE and are analysed in this work: VCC 562, VCC 1179, and VCC 1356. They have magnitudes between 15.5 and 16.7 ( between and ), and Hi masses of 107 108 M⊙ assuming a distance to Virgo of 16.5 Mpc (Mei et al. 2007). We inferred star-formation rates (SFRs) of between 10-1 and 10-2 M⊙ yr-1 from extinction-corrected H and UV fluxes (Gavazzi et al. 2004; Boselli et al. 2009). Although these dwarfs are compact, thus classified as BCDs by Binggeli et al. (1985), their SFRs are lower than the typical values for BCDs (Hunter & Elmegreen 2004; Zitrin et al. 2009). Metallicities were estimated using the Sloan Digitised Sky Survey (SDSS) spectroscopic database (York et al. 2000). Since the [Oii] 3727 nebular line is outside the observed wavelength range of the SDSS spectra, we estimated the oxygen abundances following the method of Pilyugin & Thuan (2007). Our estimates agree, within the errors, with the measurements available in the literature for VCC 562222Note that according to Vílchez & Iglesias-Páramo (2003) the uncertainties in the measurement of VCC 562 are also compatible with a higher metal abundance, 12 + log(O/H)=8.4-8.6. and VCC 1179 (Vílchez & Iglesias-Páramo 2003). The basic parameters of the three galaxies are given in Table 1.
Among the Sm and Im types, only one bright IBm galaxy, IC3583 (VCC 1686), was detected in the SDP field, but given its different properties from the three dwarfs, it will be analysed in more detail in a separate work.
3 Photometry
| ID | mB | 12+log(O/H) | SFR | log(MHI/M⊙) | T | log(Md/M⊙) | log( ) |
|---|---|---|---|---|---|---|---|
| mag | M⊙ yr-1 | K | |||||
| VCC 562 | 16.74 | 7.8 | 4.6 | 7.670.03 | 20.20.2 | 5.180.13 | -2.490.13 |
| VCC 1179 | 15.46 | 8.3 | 9.4 | 7.39 | 16.2 | 5.480.14 | -1.910.15 |
| VCC 1356 | 16.15 | 8.0 | 4.6 | 8.350.01 | 17.9 | 5.530.16 | -2.820.16 |
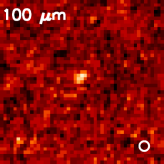
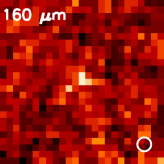
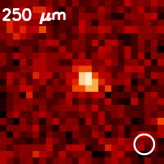
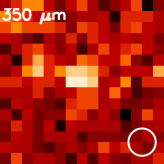
The SDP data were reduced using the Level I procedures described in Pohlen et al. (2010). More details on the observations can be found in Davies et al. (2010). The angular resolution for PACS in fast scan parallel mode is 7127 and 116157, at 100, and 160 m, respectively. For SPIRE, the PSF FWHM is 181, 252, and 369 at 250, 350, and 500 m respectively. Pixel sizes are 32, 64, 6, 10, and 14 for the five bands. The rms levels of empty sky regions at 100, 160, 250, 350, and 500 m are 2 mJy pix-1, 5 mJy pix-1, 8 mJy beam-1, 7 mJy beam-1, and 9 mJy beam-1, respectively.
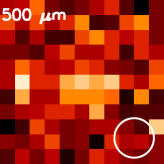
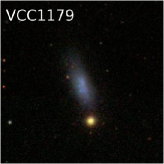
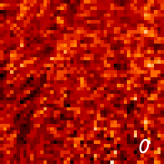
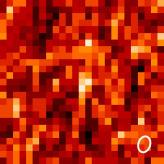
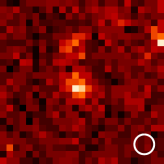
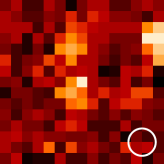
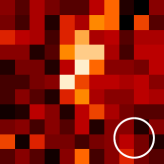
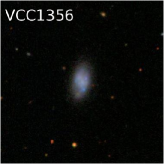
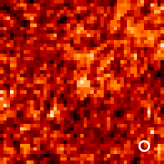
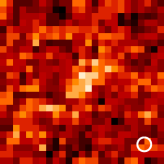
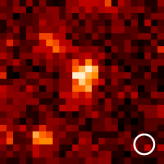
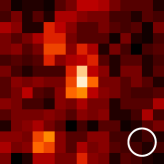
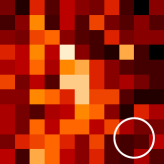
Figure 1 compares PACS and SPIRE data of the three dwarfs to the SDSS images. VCC 1179 is not detected at 100 m, nor VCC 562 at 500 m. The other galaxies are marginally detected at 500 m with a low signal-to-noise ratio (S/N) (4 and 5 for VCC 1179 and VCC 1356, respectively). The VCC 1179 images show an additional feature to the north extending beyond the edge of the optical disc. It is not clear whether this feature is associated with the galaxy or not, but it also does not seem to be related to any background source in the SDSS images.
Photometry from 100 to 500 m was derived by means of the standard growth curve analysis. The aperture is centred on the brightness peak, and the sky level is determined by considering the value that minimizes the radial variation in successively larger apertures. At large radii, the photometry should be relatively constant, and the asymptotic value corresponds to the total flux. The value of the sky thus derived is always within 1.5 standard deviations of the sky background measured in empty regions around the galaxies. The uncertainty in the flux density is assumed to be % (Boselli et al. 2010; Swinyard, Ade, Baluteau, et al. 2010).
4 Dust temperatures and masses
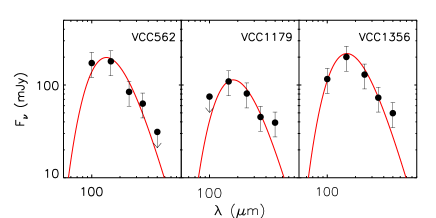
To derive the temperatures of the dust, we fitted the PACSSPIRE SEDs with a single modified Planck function and an emissivity law (Fig. 2, upper panels). We constrained the dust masses using the 250 m flux densities, and the emissivity 4.67 cm2 g-1 at 250 m (Li & Draine 2001). The resulting dust masses are approximately M⊙ , and the dust temperatures are around 20 K (see Table 1).
However, Fig. 2 shows that 500 m fluxes of VCC 1179 and VCC 1356 tend to be underestimated by the single-temperature fits. This difference could be due to either thermal or non-thermal radio emission (Condon 1992; Hunt et al. 2005), an additional cold (10 K) dust component (Galliano et al. 2003; Galametz et al. 2009), an enhanced abundance of small grains (Lisenfeld et al. 2002), or the different optical properties of the amorphous dust grains (Meny et al. 2007).
We first considered the possibility of radio emission. Following Condon (1992), we estimated the non-thermal and thermal radio flux at 500 m that would be expected given the SFR of each galaxy. Because of the steep frequency fall-off of the non-thermal radio component toward higher frequencies (), the estimated thermal flux at 500 m is higher than the non-thermal one by a factor of 9. Nevertheless, in both cases, given the low SFR of these BCDs ( M⊙ yr-1), the expected radio flux at 500 m is of the order of 200 Jy, and thus cannot be responsible for the 500 m excess.
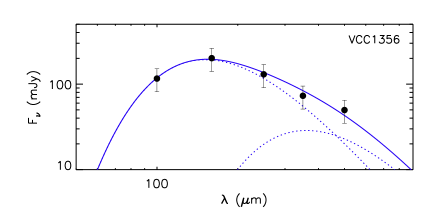
The emission from an additional cold dust component, 10 K, would peak between 200 and 300 m and could cause the excess we observe at 500 m. To explore this possibility, we refined the fiducial SED model by adding a second modified black body at a lower temperature. For this two-component grey-body fit, we also used . Since we have four points in the SED of VCC 1179 and the uncertainties in the flux densities are large, the fit could not be tightly constrained, and we discuss only the results obtained for VCC 1356. More than one set of parameters were able to provide a reasonable fit to the SED of this galaxy. We inferred mean temperatures of Tc = 8 K and Tw = 19.1 K for the two dust components and the fit for these values is displayed in Fig. 2 (lower panel). The corresponding total dust mass is M M⊙ . This high mass is inconsistent with current chemical evolution models (see next section). The least extreme value of cold dust temperatures providing a reasonable fit (T11 K, with Tw = 19.6 K) still yields a total dust mass M M⊙ , which is six times higher than the value for single-temperature fit. Fitting the data with a more sophisticated dust model to test alternative explanations is beyond the scope of this Letter; this analysis will be performed in a future work when the observations of the field are completed. At this stage, given the low S/N of the detections at 500 m and the large error bars, it is difficult to discriminate between the different scenarios.
5 Dust-to-gas mass ratios
The dust-to-gas-mass ratio (Mdust/Mgas) not only provides information about the amount of metals that are locked in dust grains, but also provides an indication of the star-formation history of a galaxy, reflecting the net balance between the formation and destruction of dust (Hirashita et al. 2002). The ratio is known to correlate with the oxygen abundance (Lisenfeld & Ferrara 1998; Edmunds 2001; Hirashita et al. 2002; James et al. 2002). Here we check whether the gas and dust masses we obtained for these galaxies in the Virgo cluster are compatible with the predictions of dust formation models.
To derive , we used neutral hydrogen masses available from the ALFALFA catalog (Giovanelli et al. 2007; Kent et al. 2008, see Table 1). The angular resolution of the 21-cm data (3) includes all dust emission detected in these objects. We assume the total gas mass is given by the atomic component only: independent of the lack of CO detections, this assumption is justified by the low H2-to-Hi mass fractions expected in metal-poor environments (e.g., Robertson & Kravtsov 2008; Krumholz et al. 2009a, b).
The resulting values of are reported in Table 1. Figure 3 shows for the Virgo BCDs (filled circles) as a function of nebular oxygen abundance. Also illustrated in Fig. 3 are data from the literature (James et al. 2002; Hunt et al. 2005; Walter et al. 2007). Selected model predictions for the -metallicity correlation are also shown (Edmunds 2001; Hirashita et al. 2002). The Hirashita et al. (2002) models, shown as long-dashed and dot-dashed curves, depend on the dust destruction efficiency, which begins to be effective when the oxygen abundance . Were the interstellar dust mass an approximately constant fraction of the ISM metal abundance, as proposed by Edmunds (2001) and James et al. (2002), the relation between and would be linear. A solid line indicates their prediction for dust production by SNe, and the short-dashed line represents that by only evolved low- and intermediate-mass stars. Alternatively, a non-linear trend is predicted by Lisenfeld & Ferrara (1998) and Hirashita et al. (2002) because of the additional effects of outflows and dust destruction efficiency. The two most metal-poor objects plotted, I Zw 18 and SBS 0335052 (at 7.2), have a very low dust-to-gas ratio for their metallicity (Hunt et al. 2005), but are approximately consistent with linearity.
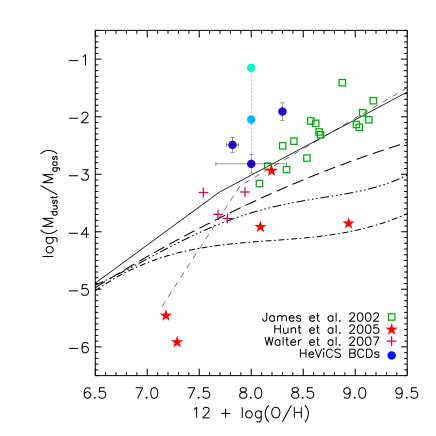
Our estimates of for the three dwarfs, based on the single-temperature fit of the data, are indeed consistent with what would be expected by the linear models. If these galaxies hosted a cold dust component with T K, as discussed in the previous section (and shown in Fig. 3), the corresponding would be much larger than the model predictions. In this case, a significant missing gaseous component (H2, cold Hi), a few times more massive than the amount of detected Hi, should be introduced to explain this discrepancy.
6 Comparison with far-IR properties of known star-forming dwarfs
The brightest and most metal-poor BCDs, such as IZw18 and SBS 0335-052E, have been studied with Spitzer, and dust has been detected even in these low abundance environments (Houck et al. 2004; Wu et al. 2007). While the SED peak of SBS 0335-052E is shifted to shorter wavelengths ( 28 m; Houck et al. 2004), I Zw 18 has also been detected at 70 m (Wu et al. 2007; Engelbracht et al. 2008), suggesting that a cool dust component might be present in this galaxy. Hunt et al. (2005) studied the global SEDs of seven BCDs showing that far-IR emission in these galaxies peaks at or shortward of 60 m.
However, the dwarfs detected with Herschel are more “quiescent” than the typical BCDs analysed in these studies. Walter et al. (2007) observed a sample of dwarf irregular galaxies in the M 81 group with SFRs and metallicities more similar to the Virgo dwarfs. They derived dust masses and temperatures of the M 81 dwarfs using only the 70 and 160 m Spitzer/MIPS bands. Their dust-to-gas mass ratios, taking into account the total Hi mass of the galaxies, are displayed in Fig. 3 (plus signs), and are about one order of magnitude smaller than those of the Virgo dwarfs with a similar metal abundance. Finally, six Im-BCD galaxies in Virgo analysed with ISO data by Popescu et al. (2002) show similar properties to the dwarfs in the current work. In particular, their 60-170 m SEDs indicate the presence of warm dust and a cooler component with a median temperature 18 K, in agreement with our results. The resulting dust-to-gas mass ratios in a few cases are rather large, 0.1.
7 Conclusions
We have presented PACS and SPIRE observations of three star-forming dwarf galaxies in Virgo detected in the far-IR/submm regime with the science demonstration phase data set for the HeViCS survey. The data indicate the presence of cool dust with a temperature 20 K and dust masses around 105 M⊙ . We have discussed the possibility that these galaxies host an additional cold (T 10 K) component to explain the excess at 500 m in two of the dwarfs. However, the low S/N of the 500 m detections precludes us from drawing firm conclusions. The completion of the full area of the survey will enable us to place more stringent constraints on the dust content of star-forming dwarf galaxies in a dense cluster environment.
References
- Bendo et al. (2010) Bendo, G. J., Wilson, C. D., Warren, B. E., et al. 2010, MNRAS, 402, 1409
- Binggeli et al. (1985) Binggeli, B., Sandage, A., & Tammann, G. A. 1985, AJ, 90, 1681
- Binggeli et al. (1987) Binggeli, B., Tammann, G. A., & Sandage, A. 1987, AJ, 94, 251
- Boselli et al. (2009) Boselli, A., Boissier, S., Cortese, L., et al. 2009, ApJ, 706, 1527
- Boselli et al. (2010) Boselli et al. 2010, this volume
- Condon (1992) Condon, J. J. 1992, ARA&A, 30, 575
- Davies et al. (2010) Davies et al. 2010, this volume
- Desert et al. (1990) Desert, F., Boulanger, F., & Puget, J. L. 1990, A&A, 237, 215
- Edmunds (2001) Edmunds, M. G. 2001, MNRAS, 328, 223
- Engelbracht et al. (2008) Engelbracht, C. W., Rieke, G. H., Gordon, K. D., et al. 2008, ApJ, 678, 804
- Galametz et al. (2009) Galametz, M., Madden, S., Galliano, F., et al. 2009, A&A, 508, 645
- Galliano et al. (2005) Galliano, F., Madden, S. C., Jones, A. P., Wilson, C. D., & Bernard, J. 2005, A&A, 434, 867
- Galliano et al. (2003) Galliano, F., Madden, S. C., Jones, A. P., et al. 2003, A&A, 407, 159
- Gavazzi et al. (2004) Gavazzi, G., Zaccardo, A., Sanvito, G., Boselli, A., & Bonfanti, C. 2004, A&A, 417, 499
- Giovanelli et al. (2007) Giovanelli, R., Haynes, M. P., Kent, B. R., et al. 2007, AJ, 133, 2569
- Griffin et al. (2010) Griffin et al. 2010, this volume
- Hirashita et al. (2002) Hirashita, H., Tajiri, Y. Y., & Kamaya, H. 2002, A&A, 388, 439
- Houck et al. (2004) Houck, J. R., Charmandaris, V., Brandl, B. R., et al. 2004, ApJS, 154, 211
- Hunt et al. (2005) Hunt, L., Bianchi, S., & Maiolino, R. 2005, A&A, 434, 849
- Hunter & Elmegreen (2004) Hunter, D. A. & Elmegreen, B. G. 2004, AJ, 128, 2170
- James et al. (2002) James, A., Dunne, L., Eales, S., & Edmunds, M. G. 2002, MNRAS, 335, 753
- Kent et al. (2008) Kent, B. R., Giovanelli, R., Haynes, M. P., et al. 2008, AJ, 136, 713
- Krumholz et al. (2009a) Krumholz, M. R., McKee, C. F., & Tumlinson, J. 2009a, ApJ, 693, 216
- Krumholz et al. (2009b) Krumholz, M. R., McKee, C. F., & Tumlinson, J. 2009b, ApJ, 699, 850
- Li & Draine (2001) Li, A. & Draine, B. T. 2001, ApJ, 554, 778
- Lisenfeld & Ferrara (1998) Lisenfeld, U. & Ferrara, A. 1998, ApJ, 496, 145
- Lisenfeld et al. (2002) Lisenfeld, U., Israel, F. P., Stil, J. M., & Sievers, A. 2002, A&A, 382, 860
- Madden (2002) Madden, S. C. 2002, Ap&SS, 281, 247
- Mei et al. (2007) Mei, S., Blakeslee, J. P., Côté, P., et al. 2007, ApJ, 655, 144
- Meny et al. (2007) Meny, C., Gromov, V., Boudet, N., et al. 2007, A&A, 468, 171
- Pilbratt et al. (2010) Pilbratt et al. 2010, this volume
- Pilyugin & Thuan (2007) Pilyugin, L. S. & Thuan, T. X. 2007, ApJ, 669, 299
- Poglitsch et al. (2010) Poglitsch et al. 2010, this volume
- Pohlen et al. (2010) Pohlen et al. 2010, this volume
- Popescu et al. (2002) Popescu, C. C., Tuffs, R. J., Völk, H. J., Pierini, D., & Madore, B. F. 2002, ApJ, 567, 221
- Robertson & Kravtsov (2008) Robertson, B. E. & Kravtsov, A. V. 2008, ApJ, 680, 1083
- Swinyard, Ade, Baluteau, et al. (2010) Swinyard, Ade, Baluteau, et al. 2010, this volume
- Thuan et al. (1999) Thuan, T. X., Sauvage, M., & Madden, S. 1999, ApJ, 516, 783
- Vílchez & Iglesias-Páramo (2003) Vílchez, J. M. & Iglesias-Páramo, J. 2003, ApJS, 145, 225
- Walter et al. (2007) Walter, F., Cannon, J. M., Roussel, H., et al. 2007, ApJ, 661, 102
- Wu et al. (2007) Wu, Y., Charmandaris, V., Hunt, L. K., et al. 2007, ApJ, 662, 952
- York et al. (2000) York, D. G., Adelman, J., Anderson, Jr., J. E., et al. 2000, AJ, 120, 1579
- Zhu et al. (2009) Zhu, M., Papadopoulos, P. P., Xilouris, E. M., Kuno, N., & Lisenfeld, U. 2009, ApJ, 706, 941
- Zitrin et al. (2009) Zitrin, A., Brosch, N., & Bilenko, B. 2009, MNRAS, 399, 924