berg, Germany 44institutetext: Johns Hopkins University Dept. of Physics and Astronomy, 3701 San Martin drive Baltimore, MD 21210 USA 55institutetext: Université Joseph Fourier/CNRS, Laboratoire d’Astrophysique de Grenoble, UMR 5571, Grenoble, France 66institutetext: Stockholm Observatory, AlbaNova University Center, Roslagstulls-
backen 21, SE-106 91 Stockholm, Sweden 77institutetext: INSA at ESAC, E-28691 Villanueva de la Cañada, Madrid, Spain 88institutetext: LAEX-CAB, Depto. Astrofísica, Centro de Astrobiología (INTA-CSIC), P.O. Box 78, E-28691 Villanueva de la Cañada, Spain 99institutetext: ESA-ESAC Gaia SOC. P.O. Box 78, E-28691 Villanueva de la Cañada, Madrid, Spain 1010institutetext: Institut d’Astrophysique et de Géophysique, Université de Liège, 17 Allée du Six Août, B-4000 Sart Tilman, Belgium 1111institutetext: Spitzer Science Center, California Institute of Technology, Pasadena, CA 91125, USA 1212institutetext: Centro Astronómico Hispano Alemán de Calar Alto (CAHA), C/ Jesús Durbán Remoń 2-2 E-04004 Almería, Spain 1313institutetext: NASA Exoplanet Science Institute, California Institute of Technology, Pasadena, CA 91125, USA 1414institutetext: Jet Propulsion Lab, California Institute of Technology, 4800 Oak Grove Dr, Pasadena, CA 91109, USA 1515institutetext: NASA Goddard Space Flight Center, Exoplanets and Stellar Astrophysics, Code 667, Greenbelt, MD 20771 1616institutetext: UNINOVA-CA3, Campus da Caparica, Quinta da Torre, Monte de Caparica, 2825-149 Caparica, Portugal 1717institutetext: University of Kiel, Institute of Theoretical Physics and Astrophysics, Leibnizstrasse 15, 24098 Kiel, Germany 1818institutetext: ESA Astrophysics & Fund Physics Missions Division, ESTEC/SRE-SA, Keplerlaan 1, NL-2201 AZ Noordwijk, The Netherlands 1919institutetext: Astrophysikalisches Institut und Universitätssternwarte, Friedrich-Schiller-Universität, Schillergäßchen 2-3, 07745 Jena, Germany 2020institutetext: Department of Physics and Astronomy, Open University, Walton Hall, Milton Keynes MK7 6AA, UK 2121institutetext: ESA/ESTEC Space Environment and Effects Section, PO Box 299, 2200 AG Noordwijk, The Netherlands 2222institutetext: LESIA, Observatoire de Paris, 92195, Meudon, France 2323institutetext: Science and Technology Facilities Council, Rutherford Appleton Laboratory, Chilton, Didcot OX11 0QX, UK 2424institutetext: European Southern Observatory, Alonso de Córdova 3107, Vitacura, Santiago, Chile
Resolving the cold debris disc around a planet-hosting star††thanks: Herschel is an ESA space observatory with science instruments provided by European-led Principal Investigator consortia and with important participation from NASA.
Abstract
Context. About two dozen exo-solar debris systems have been spatially resolved. These debris discs commonly display a variety of structural features such as clumps, rings, belts, excentric distributions and spiral patterns. In most cases, these features are believed to be formed, shaped and maintained by the dynamical influence of planets orbiting the host stars. In very few cases has the presence of the dynamically important planet(s) been inferred from direct observation.
Aims. The solar-type star q1 Eri is known to be surrounded by debris, extended on scales of 30′′. The star is also known to host at least one planet, albeit on an orbit far too small to make it responsible for structures at distances of tens to hundreds of AU. The aim of the present investigation is twofold: to determine the optical and material properties of the debris and to infer the spatial distribution of the dust, which may hint at the presence of additional planets.
Methods. The photodetector array camera and spectrometer (PACS) aboard the Herschel Space Observatory allows imaging observations in the far infrared at unprecedented resolution, i.e. at better than 6′′ to 12′′ over the wavelength range of 60 m to 210 m. Together with the results from ground-based observations, these spatially resolved data can be modelled to determine the nature of the debris and its evolution more reliably than what would be possible from unresolved data alone.
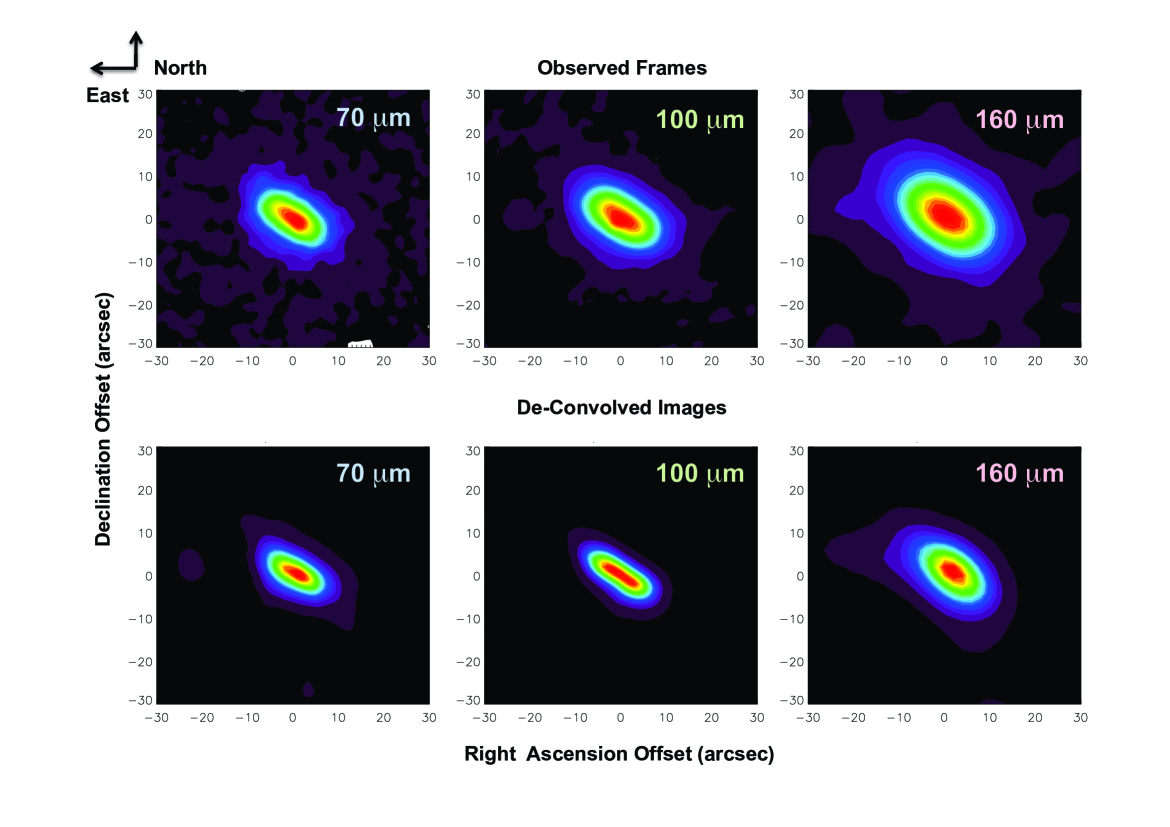
Results. For the first time has the q1 Eri disc been resolved at far infrared wavelengths. The PACS observations at 70 m, 100 m and 160 m reveal an oval image showing a disc-like structure in all bands, the size of which increases with wavelength. Assuming a circular shape yields the inclination of its equatorial plane with respect to that of the sky, ∘. The results of image de-convolution indicate that likely is larger than 63∘, where 90∘ corresponds to an edge-on disc.
Conclusions. The observed emission is thermal and optically thin. The resolved data are consistent with debris at temperatures below 30 K at radii larger than 120 AU. From image de-convolution, we find that q1 Eri is surrounded by an about 40 AU wide ring at the radial distance of 85 AU. This is the first real Edgeworth-Kuiper Belt analogue ever observed.
Key Words.:
Stars: individual: q1 Eri (HD 10647, HR 506, HIP 7978) – Stars: planetary systems: planetary discs – circumstellar matter – formation1 Introduction
We report new observations of the debris disc around q1 Eri (HD 10647, HR 506) using the Herschel Space Observatory (Pilbratt et al. 2010). The observations form part of a larger Key Programme (KP), viz. DUNES111DUst around NEarby Stars, http://www.mpia-hd.mpg.de/DUNES/, which is described in more detail by Eiroa et al. (2010). Here, we give a brief summary to put the contents of this Letter into context. The DUNES KP is a sensitivity limited study with the goal of discovering and characterising extra-solar analogues of the Edgeworth-Kuiper Belt (EKB) in an unbiased, statistical sample of nearby F, G and K main-sequence stars. The sample is volume limited, with distances 20 pc, and spans a broad range of stellar ages, from 0.1 to roughly 10 Gyr. In addition to the object of the present study (q1 Eri), a number of M- and A-type stars will be observed in collaboration with the DEBRIS-KP team (Matthews et al. 2010), implying that the whole sample covers a decade in stellar mass from 0.2 to 2 .
The PACS (Poglitsch et al. 2010) observations at 100 m aim at the detection of the stellar photospheres down to the confusion noise with a signal to noise ratio (S/N) of at least 5. Together with observations in the other Herschel bands, this will lead to an unprecedented characterisation of discs and will allow detailed theoretical modelling. It is foreseen that fractional luminosities of a few times will be reached, i.e. similar to that of the EKB of the Solar System (Stern 1996; Jewitt et al. 2009) and a more than order of magnitude improvement over Spitzer data (Bryden et al. 2009).
A main-sequence star with an infrared excess larger by more than three orders of magnitude than this limit is the late F-type star q1 Eri. This will potentially allow to study the material giving rise to the excess in great detail. The star is known to be accompanied by a giant planet, q1 Eri b, orbiting at the distance of 2 AU (Butler et al. 2006, and references therein), which corresponds to 01 at the distance of the system (17.35 pc; Perryman et al. 1997; van Leeuwen 2007). Such a small angle will not be resolved by the observations described in this paper, but q1 Eri is also surrounded by a ring or belt system of scattering and thermally emitting dust particles. The extent of the system, which from optical to sub-millimetre wavelengths is up to several tens of arc seconds in size (e.g., Stapelfeldt et al. 2007; Liseau et al. 2008, and references therein), should be readily accessible to PACS at the Herschel telescope ().
This contribution presents the observed properties of the q1 Eri system by Herschel. The results of theoretical model calculations will be communicated by Augereau et al. (in prep.). The observations and data reduction are described in Sect. 2, with the results presented in Sect. 3. These are discussed in Sect. 4 and, finally in Sect. 5, our main conclusions are briefly summarised.
| Observation | , | Fluxb | 2ab | 2bb | PAc | Alternate flux | |
|---|---|---|---|---|---|---|---|
| ID and Mode | (′′, ′′) | (mJy) | (′′) | (′′) | (∘) | (∘) | measurement (mJy) |
| 1342187142 - 70 : chop-nod | , | 13.9 (11.0) | 7.9 (4.4) | 54.4 (60.0) | 55.4 (66.4) | Spitzer/MIPSe | |
| 1342187141 - 100 : chop-nod | , | 15.5 (12.6) | 8.8 (5.1) | 54.4 (56.2) | 55.4 (66.1) | IRAS FSC | |
| 134218739/40 - 100 : scan map | , | 15.1 (12.5) | 8.8 (4.7) | 56.1 (54.8) | 54.4 (67.9) | IRAS FSC | |
| 1342187142 - 160 : chop-nod | , | 18.9 (13.5) | 12.3 (7.8) | 51.3 (48.9) | 49.4 (54.7) | Spitzer/MIPSf | |
| 134218739/40 - 160 : scan map | , | 19.3 (13.3) | 12.5 (6.5) | 51.2 (55.7) | 49.6 (60.7) | Spitzer/MIPSf |
Notes to the Table:
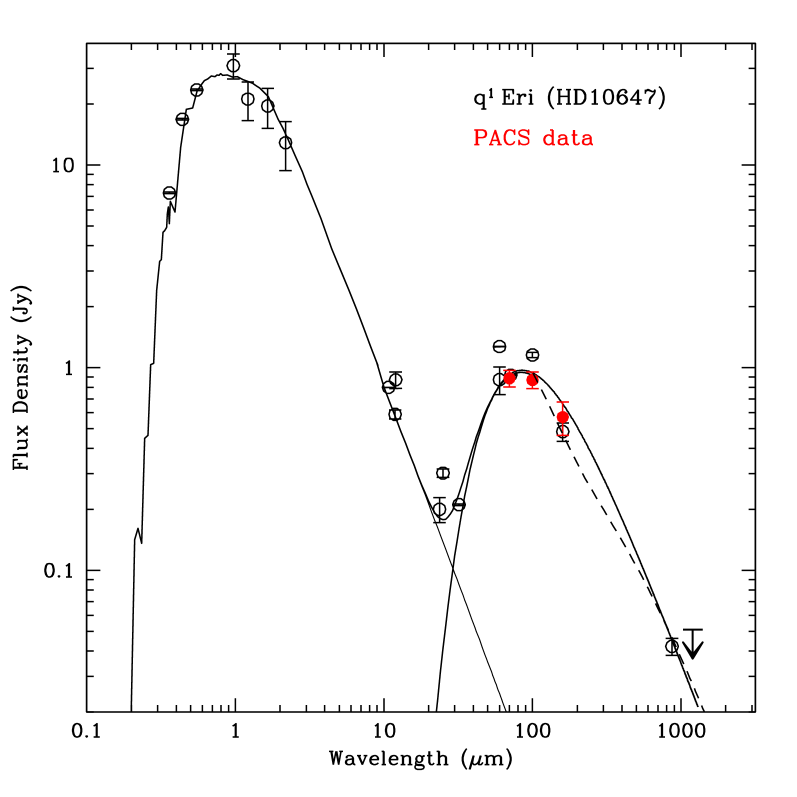
a Offsets of ellipse centre relative to stellar coordinates: proper motion corrected to IRCS 2009.89 (+0.186 s and 055 Perryman et al. 1997; van Leeuwen 2007) 01h42m29502, ∘ 44′ 2806. The photospheric fluxes are 17 mJy at 70 m, 8 mJy at 100 m and 3 mJy at 160 m (cf. Fig. 2).
b Flux for Gaussian ellipse with fitted FWHM to major and minor axis, 2a and 2b, respectively. Values in parentheses refer to de-convolved images.
c Position angle measured from North over East.
d Lower limit to the inclination, where ∘ refers to an edge-on geometry.
e Trilling et al. (2008).
f Tanner et al. (2009).
2 Observations and data reduction
During this initial observing run, two different modes of observing were executed for test reasons, in order to optimise the efficiency of the programme in terms of observing time and signal-to-noise ratio (S/N). These modes were, respectively, the chop-and-nod mode (70, 100 and 160 m), adopted for point source observing, and the scan-map option (100 and 160 m), for extended sources (Fig. 1). These modes are described by Eiroa et al. (2010) and in a future technical note.
The reduction was done within the Herschel interactive processing environment, using HIPE_v2.0.0_RC3, and with scripts for the pipeline developed by members of the PACS-ICC222Herschel science demonstration phase data processing workshop, 14-16 December 2009, ESAC, Spain.. At the medium scan speed of 20′′ s-1, two maps along position angles 63∘ and 117∘, respectively, were obtained in order to minimise striping in the resultant images. At both 100 m and 160 m, the sky noise was lower in the scan-map data (2.8 and Jy arcsec-2, respectively, as compared to (3.9 and Jy arcsec-2 of the chop-nod observations. These values are comparable to the surface brightness of the scattering disc at 0.6 m ( Jy arcsec-2, as deduced from data in Stapelfeldt et al. 2007).
The prime calibrator Arcturus ( Boo; e.g., Cohen et al. 2005) was observed close in time with q1 Eri and was used to provide the instrumental point spread function (PSF)333See
http://Herschel.esac.esa.int/AOTsReleaseStatus.shtml
http://Herschel.esac.esa.int/Docs/AOTsReleaseStatus/PACS_Scan
ChopNod_ReleaseNote_22Feb2010.pdf
http://Herschel.esac.esa.int/Docs/AOTsReleaseStatus/PACS_Phot
Map_ReleaseNote_23Feb2010.pdf .
The filters at the reference wavelengths of 70, 100 and 160 m are referred to as blue, green and red, spanning m, m and m, respectively (Poglitsch et al. 2008). The PSF has a tripolar shape at low intensities, i.e. a few percent of the peak value, and the half-power-width is circular for the 70 m and 100 m filters, but somewhat elongated at 160 m in the scan direction. Currently, the estimated accuracy of the absolute flux calibration is estimated to be better than 20% in the long-wave and better than 10% in the short-wave bands.
3 Results
In the Scan Map AOT release is the following note: The fluxes are too high and have to be scaled down by the following factors 1.05 in the blue band, 1.09 in the green band 1.29 in the red band, and in Table 1, no colour correction has been applied to the reported fluxes. The internal consistency of the PACS data - at a given wavelength but for different observing modes - is strikingly good and lends confidence to the quality of these data. From the comparison with previous measurements, it is apparent that IRAS fluxes are on the high side, whereas long-wave Spitzer data are somewhat on the low side.
At the level of the pointing accuracy of Herschel (2′′ rms, corresponding to 35 AU), there is no significant offset of the centres of the elliptical isophotes with respect to the position of the star (Table 1). This uncertainty is much larger than the offset of 8 AU observed for Fomalhaut (Kalas et al. 2008). For the nominal wavelengths of 70 m, 100 m and 160 m, the angular resolution is limited to about 6′′, 7′′ and 115, respectively. The image of q1 Eri seems clearly resolved, therefore, only in the long dimension.
The average of the position angle of the elliptical source is PA = 54∘ and the average of the lower limit to the inclination of an intrinsically circular feature (ring or belt) is ∘, with estimated uncertainties of ∘ (∘ for an edge-on geometry). For the de-convolved images (see below), the disc would be seen more edge-on and in this case, ∘. This is consistent with the tilt derived from optical images of the light scattered off the disc (∘, Stapelfeldt et al. 2007).
4 Discussion

4.1 The spectral energy distribution (SED) revisited
Figure 2 is taken from the paper by Liseau et al. (2008), but with the PACS data included. The 70 m and 100 m fluxes fall essentially on top of the 60 K blackbody curve, shown as a solid line. For 160 m, the Spitzer observations of Tanner et al. (2009) are also included. These seemed to confirm the ring-belt model in our earlier paper. The new PACS datum is marginally below the blackbody, but also marginally above the composite SED and, at the moment, we need to leave this issue as undecided.
4.2 Image de-convolution
From high-S/N data, possible fine-structural details in the image can be retrieved. This would require image sharpening techniques, such as, e.g., image de-convolution with the known PSF.
The images were de-convolved with the rotated Arcturus-PSF using the algorithm for a maximum entropy method (MEM) developed by Hollis et al. (1992). Guided by experience, we stopped the routine after about a dozen iterations in order not to produce artefacts and/or false super-resolution. More automatic and/or quantitative methods were tried, but were eventually abandoned due to insufficient reliability. In Fig. 1, the direct observations are compared with the de-convolved images and in Table 1, values measured on the sharpened images are reported.
In Figure 3, one-dimensional cuts along the major axis of the observed and de-convolved 100 m image are displayed. It would have been more natural to select the observation at 70 m, having the highest spatial resolution, but the 100 m scan map data are of considerably higher S/N, outweighing the apparent resolution advantage of the shorter wavelength data. In the analysed sub-frame, the flux was conserved within 7% by the MEM routine. Prior to the de-convolution, a stellar point source with photospheric flux of 8 mJy at 100 m (Table 1) was subtracted from the PACS image. The resulting sharpened image reveals a central broadened plateau and a central depression with a depth of about 2%, which is consistent with the debris residing in a ring or belt around the star.
With standard assumptions regarding the emitting grains (astronomical silicates, a blow-out size limit m for the F9 V star and a power law index for the size distribution) we find that the 100 m surface brightness profiles along the major and minor axes are well reproduced assuming a disk inclination of about 70∘ and a two-parameter model for the surface density, . These parameters are the peak density position, , and the power law index of the surface density profile for . The best fit to the surface brightness profiles is consistent with a ring-like disc, having values of AU and , respectively. A more elaborate model, with the size distribution computed self-consistently and taking into account the profiles also at other wavelengths, will be presented by Augereau et al. (in prep.).
This roughly 40 AU wide ring or belt at about 85 AU from the star appears similar to the EKB of the Solar System. Based on an analogy with the debris disc around Fomalhaut and on theoretical expectations, it is quite possible that another gas giant planet, q1 Eri c, could be orbiting the star inside the inner belt edge. Given the age of the system, 2 Gyr, the direct detection of q1 Eri c, for instance by means of coronography, can be expected to be hard (see, e.g., Beichman et al. 2006).
5 Conclusions
Based on imaging observations with PACS in the three photometric bands at 70 m, 100 m and 160 m we find that
-
the debris around the solar-type star q1 Eri has an oval-shaped brightness distribution, the size of which increases with the wavelength;
-
the integrated flux density at these wavelengths leads to an SED which is in good agreement with earlier results;
-
the very high signal-to-noise of the 100 m scan map is adequate to sharpen the image using an image de-convolution technique, revealing a ring-like structure with maximum surface density at 85 AU from the star;
-
with a width of about 35 to 45 AU, this ring or belt around the F9 V star q1 Eri is similar to the Edgeworth-Kuiper Belt around the Sun. This may hint at the presence of another planet, q1 Eri c.
Acknowledgements.
We wish to acknowledge the support by the SNSB, the CNES, the PNP and the MICINN. In addition, we have benefited from HCSS / HSpot / HIPE which are joint developments by the Herschel Science Ground Segment Consortium, consisting of ESA, the NASA Herschel Science Center, and the HIFI, PACS and SPIRE consortia.References
- Beichman et al. (2006) Beichman C.A., Bryden G., Stapelfeldt K.R. et al., 2006, ApJ, 652,1674
- Bryden et al. (2009) Bryden G., Beichman C.A., Carpenter J.M. et al., 2009, ApJ, 705, 1226
- Butler et al. (2006) Butler R.P., Wright J.T., Marcy G.W. et al., 2006, ApJ, 646, 505
- Cohen et al. (2005) Cohen M., Carbon D.F., Welch W.J. et al., 2005, AJ, 129, 2836
- Eiroa et al. (2010) Eiroa C. et al., 2010, this volume
- Jewitt et al. (2009) Jewitt D., Moro-Martín A. & Lacerda P., 2009, in: Astrophysics in the Next Decade, H.A. Thronson et al. (eds.), Astrophys. Space Sci. Proc., p. 63
- Hollis et al. (1992) Hollis J.M., Dorband J.E. & Yusef-Zadeh F., 1992, ApJ, 386, 293
- Kalas et al. (2008) Kalas P., Graham J.R., Chiang E. et al., 2008, Sci., 322, 1345
- Liseau et al. (2008) Liseau R., Risacher C., Brandeker A. et al., 2008, A&A, 480, L 47
- Matthews et al. (2010) Matthews B. et al., 2010, this volume
- Pilbratt et al. (2010) Pilbratt G.L. et al., 2010, this volume
- Perryman et al. (1997) Perryman M.A.C., Lindegren L., Kovalevsky J. et al., 1997, A&A, 323, L 49
- Poglitsch et al. (2010) Poglitsch A. et al., 2010, this volume
- Poglitsch et al. (2008) Poglitsch A., Waelkens C., Bauer O.H. et al., 2008, SPIE, 7010, 701005
- Stapelfeldt et al. (2007) Stapelfeldt K., Krist J., Bryden G. & Chen C., 2007, in: In the Spirit of Bernard Lyot: The Direct Detection of Planets and Circumstellar discs in the 21st Century, P. Kalas (ed.), University of California, Berkeley, CA, USA, p. 47
- Stapelfeldt et al. (2009) Stapelfeldt K.R., Bryden G., Krist J. et al., 2009, in: Exoplanets and discs: Their Formation and Diversity (T. Usuda et al., eds.), AIPC, 1158, p. 43
- Stern (1996) Stern S.A.,1996, AJ, 112, 1203
- Tanner et al. (2009) Tanner A., Beichman C., Bryden G., Lisse C. & Lawler S., 2009, ApJ, 704, 109
- Trilling et al. (2008) Trilling D.E., Bryden G., Beichman C.A. et al., 2008, ApJ, 674, 1086
- van Leeuwen (2007) van Leeuwen F., 2007, A&A, 474, 653