Plasticity and Dislocation Dynamics in a Phase Field Crystal Model
Abstract
The critical dynamics of dislocation avalanches in plastic flow is examined using a phase field crystal (PFC) model. In the model, dislocations are naturally created, without any ad hoc creation rules, by applying a shearing force to the perfectly periodic ground state. These dislocations diffuse, interact and annihilate with one another, forming avalanche events. By data collapsing the event energy probability density function for different shearing rates, a connection to interface depinning dynamics is confirmed. The relevant critical exponents agree with mean field theory predictions.
pacs:
05.10.Cc, 61.72.Cc, 62.20.Dc, 81.16.Rf, 81.40.Jj, 05.70.LnMaterials yield and deform plastically under large external stress. While the yield surface and the plastic flow are well described by various continuum theoriesCottrell (1953); Mendelson (1968); Hosford (2005), what happens microscopically during a plastic deformation is still not fully understood. On atomic scales, external stress is carried by localized crystal defects, such as dislocations and disclinations. They are created under stress and interact with each other. Although the properties of individual defects and their interactions are well knownHirth and Lothe (1982); Nabarro (1987), their collective behavior under external stress is complicated. It gives rise to scale invariant, power-law distributed phenomena Zaiser (2006); Weiss (2003); Weiss and Grasso (1997); Miguel et al. (2001); Richeton et al. (2005); Bharathi et al. (2001); Bharathi and Ananthakrishna (2002), in strong resemblance to the scaling behavior near a critical point. These phenomena include dislocation slip avalanches of a broad range of sizes, and acoustic emission with a power law power spectrum.
Recently, evidence has accumulated that these scaling phenomena reflect an underlying non-equilibrium critical pointZaiser (2006); Weiss (2003), i.e. a point where the non-equilibrium steady state fluctuations are governed by a diverging correlation length Ódor (2004), as appears to be the case in magnetic materialsSethna et al. (2001) and even turbulenceGoldenfeld (2006). Such a critical point would exist at the boundary between two distinct regimes, one of which would be a glassy, activated regime, the other would be a genuine plastic flow regime. Up to now, experimental and computational data have focused on the glassy regime: for example, Weiss et al. have measured the acoustic emission signal from creep deformation experiments on single crystal ice and found that the event size distribution follows a power law over decadesWeiss and Grasso (1997); Weiss (2003). Miguel et al.’s dislocation dynamics simulations in two dimensions showed event size distributions following a power law, with a rate-dependent cutoff, over approximately decades Miguel et al. (2001). Zaiser et al. have reported a data collapse of the event size distribution with different external stresses Zaiser (2006).
The purpose of this Letter is to approach plastic deformation from the flow side of the non-equilibrium critical point, manifested in the strain-rate dependence of the acoustic emission. Importantly, we are able to systematically vary the strain-rate in simulations, and moreover we relate the critical point underlying plastic flow at finite strain rates to the scaling of magnetic domain wall depinning Narayan (1996); Zaiser (2006); Dahmen et al. (2009). We find remarkable agreement between simulations and analytical mean field theory predictions of exponents, and in addition are able to show that the strain-rate data exhibit collapse. Our results strongly support the critical point picture of plasticity, and suggest new experiments. We study dislocation avalanches during plastic flows using the phase field crystal (PFC) modelElder et al. (2002); Elder and Grant (2004). This approach is well-suited to this problem, because it can be performed at finite temperature, for large systems, and over long time periods. The PFC model describes the dynamics of the local crystalline density field, and has been shown to give an excellent account of numerous materials properties including polycrystalline solidification, vacancy diffusion, grain growth, grain boundary energetics, epitaxial growth, fractureElder and Grant (2004), grain coarseningSinger and Singer (2006), elasticityStefanovic et al. (2006), dislocation annihilation, glides and climbBerry and Grant (2006), as well as vacancy dynamicsChan et al. (2009). The model can be derived from density functional theory and extended to the case of binary alloysElder et al. (2007). In this paper, we augment the model to treat external shearing forces by adding an advective term to the dynamics near the boundary. By adjusting the shearing force and measuring the resulting avalanche statistics, a data collapse is obtained, that is consistent with proximity to a domain wall depinning point at finite temperature Zaiser (2006); Dahmen et al. (2009).
The Model:- The phase field crystal (PFC) model is given by the free energy densityElder et al. (2002); Elder and Grant (2004)
| (1) |
where is the undercooling and is the local density. The dynamics associated with this free energy is conservative, relaxational and diffusive, and systematically derivable from density-functional theoryMajaniemi and Grant (2007). In order to study the plastic response of the PFC model under shear, we add a shearing term to the dynamical equation:
| (2) |
where
| (3) |
is the shearing profile and is the magnitude of the shearing, is the penetration depth, and control the range and time scale respectively of elastic interactions (phonon excitations) propagating through the mediumStefanovic et al. (2006), is the total free energy and is the thermal noise satisfying the fluctuation-dissipation theorem Here is the noise amplitude. It is directly proportional to the temperature, . The value of controls the magnitude of the shearing force; the penetration depth, , controls how deep the shearing force extends into the material. In all simulations we set , so the actual value of does not affect our simulation results. The boundary conditions are periodic in and fixed at . The PFC model we used allows propagating sound modesStefanovic et al. (2006) when ; as long as is non-zero and O(1), we do not expect that our scaling results will be sensitive to its precise value. Values of that are O(10) would correspond to very over-damped dynamics, and could model viscoelastic behaviorStefanovic et al. (2006) that is outside the scope of our work.
One of the advantages of using the PFC model is that we do not have to impose any ad hoc assumptions about the creation and annihilation of dislocations. Recall that in dislocation dynamics simulations, dislocations are treated as elementary particles and usually only the far field interaction between dislocations is captured. When dislocations get too close to each other (a few atomic spacings), the highly nonlinear interaction between them is not captured and more importantly, the annihilation of dislocations is not accounted for. The standard practice is then to impose some annihilation rules—dislocations of opposite topological charges annihilate when they get too close to each otherMiguel et al. (2001). Similarly, dislocations have to be created by hand when the local strain is high. Although these rules are consistent with our physical intuition, particular ways of implementing them are sometimes difficult to justify. However, because the PFC model captures the nonlinear elastic behavior of a crystal, the interaction between dislocations is completely captured. In addition, because the PFC model simulates the atoms in the lattice (the PFC density is periodic in its ground state with peaks representing atoms and troughs inter-atomic space), but not the dislocations themselves, creation and annihilation of them are also naturally captured as collective excitations of the lattice. No ad hoc rules or assumptions have to be imposed.
We solved Eq. (2) in a D rectangular domain. The crystal under shear is initially perfectly triangular. As the crystal is sheared, dislocations are created near the fixed boundaries where the stress is higher. They then propagate into the bulk. They interact with each other and form avalanches. To quantify the avalanche activity, we calculate the total speed of all dislocations in the domain, , where is the number of dislocations in the system at time and is the velocity of the -th dislocation. This measure is similar to the acoustic emission signal in Weiss et al.’s single crystal ice experiments. As dislocations are generated and interact with each other in the domain, in addition to the fast avalanching dynamics, quasi-static structures, such as grain boundaries, can form. These slow dynamics should not be measured because they are really not part of the avalanches. This leads to the distinction between fast-moving and slowly-moving dislocations introduced by Miguel et al.Miguel et al. (2001). In essence, they introduced a cutoff in dislocation speed and measure only dislocations with speed higher than the cutoff. In that way, they tried to retain only the avalanche activities in the acoustic emission signals.
We employed a different method to tackle this problem. Instead of simulating a very large system, with all sorts of dislocation activities, we simulated a moderate size of system with approximately atoms. For this system size, dislocation avalanches come and go, i.e., not many dislocations are left in the system after every avalanche. As a result, no grain boundaries, or slow dynamics, is present and we obtain clean avalanche data. It is fair to mention that this method severely limits the system size, and thus the resulting avalanche sizes. The system size we chose contains approximately dislocations in the largest avalanche events. The tradeoff, which we exploit, is the cleanness of the avalanche signal and the speed of the resulting simulations. Different methods, such as those we mentioned above, would have to be employed if larger avalanche sizes are desired.
We count the number of nearest neighbors of each atom, , using the Delaunay triangulation method in computational geometrySack and Urrutia (2000); O’Rourke (1998). Because we have for every atom in a perfectly triangular crystal, and because there are no vacancies introduced in the version of the PFC model simulated here (vacancies can be introduced into the PFC model by breaking the up-down symmetry of the PFC free energy, as detailed in Chan et al. (2009)), any atom having is sitting next to a dislocation. Because the PFC exhibits emergent rigidity in the region of the phase diagram studied here, these ‘defect atoms’ essentially track the locations of dislocations. Instead of measuring the total sum of dislocation speeds, , we then measure the total sum of these defect atoms’ speeds,
| (4) |
where is the number of defect atoms and is the velocity of defect atom . Note that the velocity of a defect atom is not the velocity of any atom in the system, but the velocity of the dislocation it is tracking. Because the two measures, and are proportional to each other with the proportionality constant being the mean number of defect atoms sitting next to a dislocation, we can use the latter for convenience.
 |
 |
Fig. 1 shows the typical time dependence of from a simulation with parameters , , , , , , , , and . changes as dislocations are being created and annihilated. There are intermittent events of creation of dislocations, with number of dislocations involved ranging from a few to . Fig 2 shows the acoustic emission signal, , in the same simulation. Similar to , the signal ranges from to , with intermittent pulses of various sizes. In order to measure the avalanche event size, we introduce a cutoff to the signal for shear velocity . The cutoff is increased proportionally to the shear velocity, and is primarily used to define the avalanche size, rather than to remove slowly moving dislocations from the analysis. The signal is then partitioned into individual avalanche events. The probability distribution of the event energy,
| (5) |
where and are the starting and ending time of the event respectively, can be measured. For cutoff values small compared to the signal (i.e. , corresponding to the activity of 3-4 dislocations due to thermal creep), the result is insensitive to the cutoff. For each shearing rate, at least different realizations are run to obtain a statistically meaningful result. This results in about avalanche events for each shearing rate. Fig. 3 shows the event size distribution for different shearing rates. We find that the distribution follows a power law for small event sizes and cuts off at larger sizes, with the cutoff size depending on the shearing rate. The data is somewhat noisier towards the end of large event size because large events are rare.
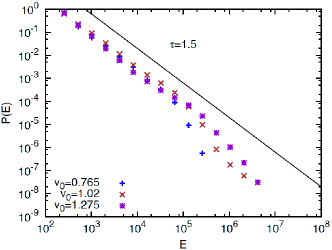
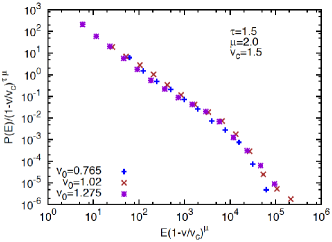
Scaling Behavior of the avalanches:- Analogous to the scaling behavior in models of crackling noise Sethna et al. (2001), we propose that there is a non-equilibrium critical point, , in the system and we expect, as , the data around the critical point to collapse in the form
| (6) |
where is the probability distribution of event energy, , is the reduced shearing rate with being the shearing rate and being the critical shearing rate. and are two critical exponents. As , tends to a power law . Fig. 4 shows an attempt to collapse the data, using the equivalent scaling form , with , and and universal scaling function shown in the collapse. Logarithmic binning is performed and singletons are ignored to obtain . We obtain a satisfactory data collapse over decades, with ranging from to . As , the collapse function approaches the power law , which agrees with in Eq. (6) for and . The collapse constrains the numerical exponent to the range . This agrees with the experimental result of Richeton et al. (2006). Similarly, for adiabatic stress increase in the pinned regime, Zaiser finds Zaiser (2006). Dimiduk reports in experiments at fixed compression stress that leads to shearing Dimiduk et al. (2006). In contrast to the universal distribution of time integrated avalanche signals discussed here (see eq.(5)), the signal amplitude statistics likely depend on details of the system: The distribution of energy amplitudes decays with the exponent Miguel et al. (2001) in simulations, and with in experiments Miguel et al. (2001). The accoustic emission intensity exponent is in simulations at fixed stress Koslowski (2007).
Studies at adiabatically slow shear rate have suggested analogies to the depinning transition of magnetic domain walls Zaiser (2006); Zapperi et al. (1998); Dahmen et al. (2009), although one exponent that may deviate in simulations is discussed in Miguel et al. (2002). The exponents found in our collapse are consistent with the domain wall depinning picture. As argued previously, mean field theory (MFT) is expected to give exact scaling results in this case. The MFT values for the exponent is Zaiser (2006); Dahmen et al. (2009). The MFT value for the exponent can be calculated from the MFT of Narayan (1996); Zapperi et al. (1998); Dahmen et al. (2009) to be . These MFT values for the exponents and lead to a satisfactory collapse of the numerical avalanche size distributions at different shear rates. At zero temperature the critical shear rate is . Our simulations, however, are performed at finite temperature . Temperature-induced dislocation creep causes the critical shear rate to appear to be nonzero, with the apparent as . It also causes the scaling collapse in Fig. 4 to be less precise than in zero temperature studies. We hope to report on a theoretical investigation of the temperature dependence and a comparison with experiments at finite shear rate in a future publication.
Acknowledgements: We thank C. Miguel and J.T. Uhl for helpful conversations. We acknowledge support from grants NSF DMR 03-25939 ITR (MCC) (GT and KD) and DOE subcontract 4000076535 (JD).
References
- Cottrell (1953) A. Cottrell, Dislocations and Plastic Flow in Crystals (Oxford University Press, 1953).
- Mendelson (1968) A. Mendelson, Plasticity: Theory and Application (Macmillan New York, 1968).
- Hosford (2005) W. Hosford, Mechanical Behavior of Materials (Cambridge University Press, 2005).
- Hirth and Lothe (1982) J. Hirth and J. Lothe, Theory of Dislocations. (John Wiley and Sons, Inc., 1982,, 1982).
- Nabarro (1987) F. Nabarro, Theory of crystal dislocations (Dover, 1987).
- Zaiser (2006) M. Zaiser, Advances in Physics 55, 185 (2006).
- Weiss (2003) J. Weiss, Surveys in Geophysics 24, 185 (2003).
- Weiss and Grasso (1997) J. Weiss and J. Grasso, J. Phys. Chem 101, 6113 (1997).
- Miguel et al. (2001) M. Miguel, A. Vespignani, S. Zapperi, J. Weiss, and J. Grasso, Nature 410, 667 (2001).
- Richeton et al. (2005) T. Richeton, J. Weiss, and F. Louchet, Nat. Mater. 4, 465 (2005).
- Bharathi et al. (2001) M. Bharathi, M. Lebyodkin, G. Ananthakrishna, C. Fressengeas, and L. Kubin, Phys. Rev. Lett. 87, 165508 (2001).
- Bharathi and Ananthakrishna (2002) M. Bharathi and G. Ananthakrishna, EPL 60, 234 (2002).
- Ódor (2004) G. Ódor, Rev. Mod. Phys. 76, 663 (2004).
- Sethna et al. (2001) J. Sethna, K. Dahmen, and C. Myers, Nature 410, 242 (2001).
- Goldenfeld (2006) N. Goldenfeld, Phys. Rev. Lett. 96, 044503 (2006).
- Narayan (1996) O. Narayan, Phys. Rev. Lett. 77, 3855 (1996).
- Dahmen et al. (2009) K. Dahmen, Y. Ben-Zion, and J. Uhl, Phys. Rev. Lett. 102, 175501 (2009).
- Elder et al. (2002) K. R. Elder, M. Katakowski, M. Haataja, and M. Grant, Phys. Rev. Lett. 88, 245701 (2002).
- Elder and Grant (2004) K. R. Elder and M. Grant, Phys. Rev. E 70, 051605 (2004).
- Singer and Singer (2006) H. M. Singer and I. Singer, Phys. Rev. E 74, 031103 (2006).
- Stefanovic et al. (2006) P. Stefanovic, M. Haataja, and N. Provatas, Phys. Rev. Lett. 96, 225504 (2006).
- Berry and Grant (2006) J. Berry and M. Grant, Phys. Rev. E 73, 031609 (2006).
- Chan et al. (2009) P. Y. Chan, N. Goldenfeld, and J. Dantzig, Phys. Rev. E (R) 79, 035701:1 (2009).
- Elder et al. (2007) K. Elder, N. Provatas, J. Berry, P. Stefanovic, and M. Grant, Phys. Rev. B 75, 64107 (2007).
- Majaniemi and Grant (2007) S. Majaniemi and M. Grant, Phys. Rev. B 75, 054301 (2007).
- Sack and Urrutia (2000) J. Sack and J. Urrutia, Handbook of computational geometry (North-Holland Publishing Co. Amsterdam, Netherlands, 2000).
- O’Rourke (1998) J. O’Rourke, Computational Geometry in C (Cambridge University Press, 1998).
- Richeton et al. (2006) T. Richeton, P. Dobron, F. Chmelik, J. Weiss, and F. Louchet, Mat.Sc.Eng. A 424, 190 (2006).
- Dimiduk et al. (2006) D. Dimiduk, C. Woodward, R. LeSar, and M. Uchic, Science 312, 1188 (2006).
- Koslowski (2007) M. Koslowski, Phil. Mag. 87, 11 (2007).
- Zapperi et al. (1998) S. Zapperi, P. Cizeau, G. Durin, and H. Stanley, Phys. Rev. B 58, 6353 (1998).
- Miguel et al. (2002) M. Miguel, A. Vespignani, M. Zaiser, and S. Zapperi, Phys. Rev. Lett. 89, 165501 (2002).