The orbital period in the supergiant fast X-ray transient IGR J16465–4507
Abstract
Timing analysis of the INTEGRAL-IBIS and Swift-BAT light curves of the Supergiant Fast X-ray Transient (SFXT) IGR J16465–4507 has identified a period of 30.320.02 days which we interpret as the orbital period of the binary system. In addition 11 outbursts (9 of which are previously unpublished) have been found between MJD 52652 to MJD 54764, all of which occur close to the region of the orbit we regard as periastron. From the reported flux outbursts, we found a dynamical range in the interval 30-80. Although in this regard IGR J16465–4507 cannot be considered a classical SFXT for which typical dinamical ranges are 100, still our reported values are significantly greater than that of classical persistent variable supergiant HMXBs (), supporting the idea that IGRJ16465–4507 is an intermediate SFXT system, much like few other similar cases reported in the literature.
keywords:
Gamma-rays: observations - X-rays: binaries - X-rays: individual: IGR J16465–45071 Introduction
During the last few years, the IBIS instrument (Ubertini et al., 2003) on board the INTEGRAL gamma-ray satellite (Winkler et al., 2003) has played a key role in discovering a previously unrecognized class of high mass X-ray binaries which display a very unusual fast X-ray transient behaviour and host a massive OB supergiant star as companion: the so-called Supergiant Fast X-ray Transients (SFXTs; in’t Zand 2005; Sguera et al. 2005, 2006; Negueruela et al. 2006). To date approximately 10 show clear characteristics of being a SFXT (plus the same number of candidates), characterized by long periods of low X-ray activity level (with luminosities or upper limits typically in the range 1032-1034 erg s-1), interspersed with short, strong, flares lasting from a few hours to no more than a few days and reaching peak luminosities of 1036-1037 erg s-1. The identification of periodicity in the SFXT outburst behaviour, most likely representing the orbital period, is a key diagnostic for studying the geometry of these systems and hence for understanding the still unknown physical mechanisms behind their very unusual behaviour (see Sidoli 2009 for a review). Because the fast outbursts from SFXTs are relatively rare occurrences, the discovery of such periodicities is a very challenging task which has been fulfilled only for an handful of SFXTs, mainly through long-term temporal monitoring by INTEGRAL (e.g. Clark et al. 2009; Bird et al. 2009; Jain et al. 2009; Zurita Heras et al. 2009; Sguera et al. 2007; Sidoli et al. 2007).
IGR J16465–4507 classification as an SFXT is debatable. Its initial discovery on 6 September 2004 was triggered by the INTEGRAL observation in the Norma region of a faint 9 mCrab source (18-60 keV) which produced a strong 28 mCrab flare on 7 September 2004 before returning to its undetectable pre-flare level (Lutovinov et al., 2004), demonstrating its fast X-ray transient nature. However since then, no more outburst activity has been reported from the source and its temporal and spectral behaviour above 20 keV is largely unknown. A XMM-Newton observation performed a few days after the source discovery allowed the detection of high intrinsic absorption (61023 cm-2) as well as a 228 s period which was interpreted as the spin period of a neutron star (Walter et al., 2006; Lutovinov et al., 2005). A single bright infrared object falls in the refined XMM-Newton position (Zurita Heras & Walter, 2004), optical and infrared spectroscopy classified it as a supergiant star located at a distance of kpc, although different spectral types have been proposed (O9.5Ia by Nespoli et al. 2008 or B0.5I by Negueruela et al. 2006; Rahoui et al. 2008). Walter & Zurita Heras (2007) reported a 22–50 keV quiescent flux of erg cm-2 s-1 and suggest that IGR J16465–4507 is not a classical SFXT (for which the dynamical range is 100, Chaty 2010) but a kind of intermediate SFXT still having a dynamic range greater than that of a classical persistent variable supergiant HMXB (for which the dynamic range is 20) such as Vela X-1 (Kreykenbohm et al., 2008). In comparison a very recent paper by La Parola et al. (2010) find no evidence of flaring activity from IGR J16465–4507 and inferred a dynamical range 10.
Here we report a comprehensive temporal study of IGR J16465–4507, based on long term INTEGRAL monitoring, which led to the discovery of 9 previously unpublished outbursts as well as the 30 days periodicity found by La Parola et al. (2010), which we interpret as the binary period.
2 Data Analysis
Archival IBIS data from MJD 52652 to MJD 54764, giving an on source exposure of Ms, were processed with the INTEGRAL Off-line Science Analysis (OSA Goldwurm et al. 2003) version 7.0. A light curve for IGR J16465–4507 was generated on science window timescales ( s) over the 18-60 keV energy range (fig. 1). The light curve was then searched iteratively for outbursts. The shortest timescale region of the light curve that produces the highest detection significance greater than 4 is found. This is the brightest outburst in the light curve. This section of the light curve is then removed from the total light curve and the next highest significant section is searched for.
| Activity | Sig | Start | Stop | Length | Peak Flux | Peak Luminosity | Orbital | ||||
|---|---|---|---|---|---|---|---|---|---|---|---|
| Period | MJD | MJD | Days | erg cm | erg s-1 | Phase | |||||
| 1 | 4. | 05 | 53081.12 | 53081.54 | 0.40 | 42. | 12 | 4. | 52 | 0.24 | |
| 2 | 5. | 27 | 53225.73 | 53226.56 | 0.83 | 33. | 27 | 3. | 57 | 0.02 | |
| 2 | 14. | 03 | 53226.59 | 53227.16 | 0.54 | 39. | 31 | 4. | 22 | 0.04 | |
| 2 | 4. | 69 | 53227.88 | 53229.90 | 1.99 | 20. | 49 | 2. | 20 | 0.11 | |
| 2 | 7. | 71 | 53231.89 | 53232.27 | 0.36 | 35. | 10 | 3. | 77 | 0.21 | |
| 3 | 16. | 97 | 53255.24 | 53255.67 | 0.42 | 63. | 18 | 6. | 79 | 0.98 | |
| 3 | 5. | 37 | 53259.19 | 53259.48 | 0.28 | 24. | 36 | 2. | 62 | 0.11 | |
| 4 | 4. | 01 | 53468.18 | 53471.82 | 3.63 | 25. | 41 | 2. | 73 | 0.06 | |
| 5 | 5. | 35 | 53617.27 | 53618.64 | 1.34 | 26. | 18 | 2. | 81 | 0.93 | |
| 5 | 4. | 47 | 53620.30 | 53620.91 | 0.59 | 23. | 93 | 2. | 57 | 0.02 | |
| 6 | 4. | 43 | 53648.85 | 53650.54 | 1.68 | 25. | 27 | 2. | 71 | 0.98 | |

In total 11 outbursts have been found in the light curve (Table 1). The outbursts range from short flares of 6.8 h to periods of flaring activity up to 87 hours. However, many of these outbursts are close together and if considered to be part of an overall period of flaring activity, only 6 periods of flaring remain. By folding the outburst times on different periods, an estimation of the duty cycle required over the orbit to explain all the outbursts can be made. This Phase Dispersion Minimization (PDM) technique produces a minimum of 23% duty cycle at a period of 29.88 days in our data (Fig. 2), which could indicate the orbital period and that outbursts occur over 23% of the orbital phase. A Monte-Carlo simulation of the PDM performed by randomising the outburst time used 200,000 times within the length of the outburst provides an error estimate of 0.46 d. This is in aggreement with the recent period found in the Swift-BAT light curve (La Parola et al., 2010).


3 Periodicity and Spectral Analysis

The science window light curve (containing 2911 independent data points) was searched for signs of periodicity using the Lomb-Scargle periodogram method (Lomb, 1976; Scargle, 1982, 1989). The Lomb-Scargle periodogram is shown in Figure 3 with a clear peak evident at a frequency of 0.033 days-1, corresponding to a period of 30.32 days, agreeing with the value determined by the PDM. The significance of the peak was confirmed by performing a randomization test (Hill et al., 2005); the flux points of the light curve are randomly re-ordered and a new Lomb-Scargle periodogram generated, the distribution of the power of the largest peak is an indicator of the significance of detection. From 200,000 simulations we estimate the 99.9%, 99.99% and the 99.999% significance levels which are shown in Figure 3; note that the maximum power achieved in any of the randomized light curves was 22.
The error on the identified period was estimated using a Monte-Carlo simulation. Each flux measurement was adjusted using Gaussian statistics within its individual error estimate to generate a simulated light curve of the source. The corresponding periodogram was produced and the location of the maximum peak near the frequency of 0.033 days-1 was recorded. From 200,000 simulations we estimate the period and its error to be 30.320.02 (1) days.
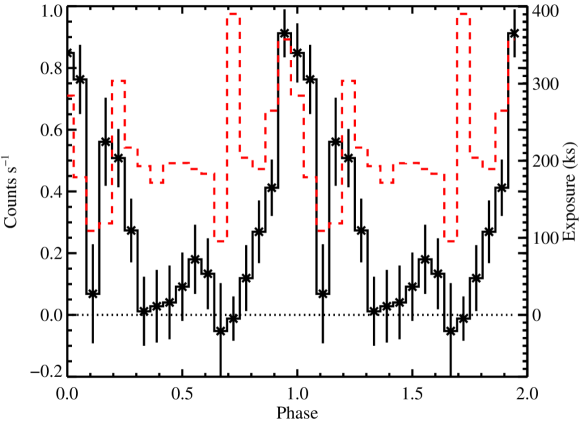
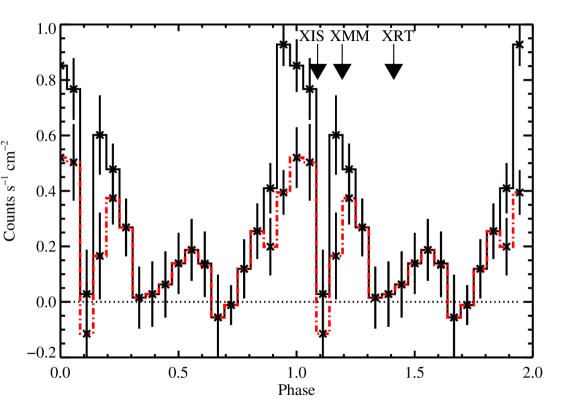
Figure 4 shows the phase folded light curve using a period of 30.32 days and using an ephemeris of MJD 53736.2 to centre the fold at phase 0.0. Assuming any enhancement to the emission to coincide with the neutron stars closest approach to the donor, we consider phase 0.0 to be periastron. To see the effect of the outbursts on the phase folded curve a new fold was performed excluding all of the outbursts from Table 1. This second phase folded light curve is shown in Figure 5, and shows no substantial difference in shape, demonstrating that there is an underlying periodicity in the flux aside from the outbursts when the entire light curve is considered. The public light curves for IGR J16465–4507 from the Swift-BAT mission were also analyzed using the Lomb-Scargle periodogram with the same tests used on the INTEGRAL light curve to see if there was any indication of the 30.32 day periodicity. The Swift orbit light curve showed a period of 30.230.04 d with a power of 22.43 (Fig. 6), compatible with the period found in the INTEGRAL light curve.
There is some evidence for an eclipse (Fig. 4) in the phase folded INTEGRAL light curve. However, this cannot be completely disentangled from low exposure in the relevant phase bins and the statistical significance of this dip is low. The feature is also not apparent in the Swift phase folded light curve leading to the conclusion that this is an exposure artifact and not a real feature.
The two outbursts with the highest significance in Table 1 (2 and 3) are shown in the inset of Figure 1. Such IBIS data have been unsuccessfully searched for pulsations. The brightest flares cannot be seen by JEM-X either on science window timescales or in deep mosaics in the 4-20 keV energy range, where the science windows exposure of 2.8 ks was not sufficiently long to detect the source. This results in an upper limit for the flux during the outburst of 8 erg cms-1. Only one Swift-XRT observation is available with only 69 events in 2 ks and so it has not been possible to extract a meaningful spectrum and to search for pulsations. However this does give an estimated 0.2-10 keV absorbed (unabsorbed) flux of 9.1 erg cm-2 s-1 (4.9 erg cm-2 s-1), based on a power law index of 1.0, a Galactic n 2.121022 and an intrinsic n 61023. The flux has also been measured by XMM-Newton as 31 erg cms-1 in the 4-10 keV energy range (Zurita Heras & Walter, 2004) and as erg cms-1 in the 0.2-10 keV energy range using Suzaku-XIS (Morris et al., 2009). These measurements approximately follow the drop in flux in the phase folded light curve (Fig. 5).
Spectra for the two outbursts with the highest significance detection (n. 2 and 3 in table 1) have been extracted from the IBIS data. The 18–60 keV spectrum of the discovery outburst (n.3) is reasonably fit by a bremsstrahlung model (=0.6, 15 d.o.f., kT=18.6 keV, flux equal to 1.2 erg cm-2 s-1) or alternatively by a power law (=0.7, 15 d.o.f, = 3.00.3). Similarly, the newly discovered outburst (n.2) is also reasonably fit by a bremsstrahlung (=1.2, 15 d.o.f., kT=29 keV, flux equal to 9.5 erg cm-2 s-1) or by a power law (=1.24, 15 d.o.f., = 2.50.3). It is evident that both outbursts have a similar soft spectrum and a comparable average flux of activity, furthermore the reported spectral shapes are very similar to those seen during outburst activity of other SFXTs (e.g. Sguera et al. 2008, 2007).
Taking into account the 18–60 keV bremsstrahlung spectral shape of both previous outbursts, we extrapolated their 0.2–10 keV soft X-ray flux obtaining a value of 3 erg cm-2 s-1. To date the lowest and highest measured unabsorbed soft X-ray fluxes are equal to 3.6 erg cm-2 s-1 (Zurita Heras & Walter, 2004) and 4.9 erg cm-2 s-1 (this paper) so the source displays a dynamical range from 6 to 83. As for the hard X-ray band, if we compare the 22–50 keV quiescent flux ( erg cm-2 s-1, Walter & Zurita Heras (2007)) to the outbursts’ fluxes as listed in table 1, then the dynamical range is from 27 to 82. We note that such values are significantly higher than that recently reported (10) by La Parola et al. (2010) as based on 54 months BAT monitoring (15–50 keV) during which no evidence for flaring activity was found. However, we point out that such apparent dynamical range incongruences can be explained by the different BAT and IBIS instrumental capabilities. IBIS is particularly suited to detect short outbursts and so to reveal the dynamic range of fast X-ray transient sources, such as IGR J16465–4507, thanks to its higher instantaneous sensitivity for shorter observation lengths (i.e. science windows, 2000 s duration) which match very well the duration of the flares. BAT is more suited to long-term monitoring thanks to its more continuous coverage but could eventually miss the detection of short flares which, if close to the IBIS sensitivity, are very likely not detectable by BAT due to its poorer instantaneous sensitivity. It is worth noting that IBIS and BAT show to be complementary and their combination is important in investigating the properties of SFXTs.
In order to test the recurrence of emission at periastron we carry out a recurrence analysis (Bird et al., 2009). For this test we calculate the light curve significance for a region of 4 days either side of the points considered as periastron and apastron (approximately 25% of the orbit). This will highlight if we see a low level emission at periastron passages compared to apastron. Comparing the distributions of significances for apastron and periastron using a Kolmogorov-Smirnov test we find a probability of 74% that they have been drawn from different distributions.
4 Discussion
The orbital characteristics and stellar properties for IGR J16465–4507 are very similar to those of SAX J1818.6–1703 (Bird et al., 2009; Zurita Heras et al., 2009). The peak flux from the phase folded light curve with the outburst removed of SAX J1818.6–1703 as determined by Bird et al. (2009) is 2.2 c s-1 in the ISGRI 18-60 keV band. Comparing this to the peak flux of 0.55 c s-1 from the same light curve for IGR J16465–4507 shows that IGR J16465–4507 is 4 times weaker if we assume that these systems are very similar. The difference in flux is compatible with the known distance measurements for both sources. However, SAX J1818.6–1703 shows much less absorption with cm-2 compared to cm-2 for IGR J16465–4507.
Since masses and periods are known from the spectral type (Drilling & Landolt, 2000) and assuming that the compact object is a neutron star of mass 1.4, Kepler’s third law gives the semi-major axis for the system of 121.9-126.3. As we see no evidence for Roche-lobe overflow in the system the eccentricity of the system must be 0.8 for the smallest possible donor star size and 0.6 for the largest donor star size of 26.
It is important to point out that whereas classical SFXTs have a remarkable dynamical range (100), we found for IGRJ16465–4507 significantly lower values (in the range 30-80). Although in this regard IGR J16465–4507 cannot be considered a classical SFXT, still its dynamical range deserves some attention since it is greater than that of classical persistent variable supergiant HMXBs (20). Our findings on the source temporal behaviour and its dinamical range are in agreement with the results reported by Walter & Zurita Heras (2007) and strongly support their idea that IGRJ16465–4507 is an intermediate SFXT system, much like few other similar cases reported in the literature (Walter & Zurita Heras, 2007).
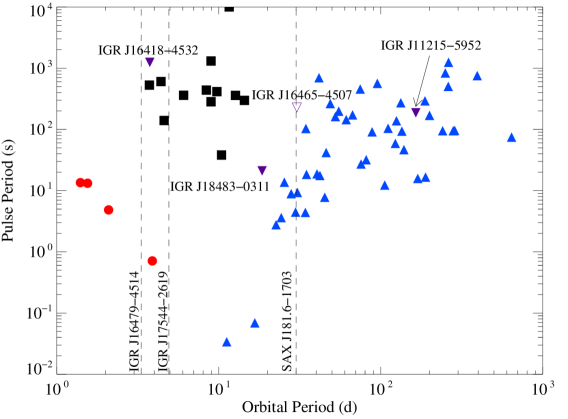
As this system has both the orbital period and spin period known then it may be plotted on the Corbet diagram (Fig. 7). This system resides between the regions dominated by wind accreting systems and Be X-ray transient systems, much like IGR J18483–0311 (Sguera et al., 2007) and SAX J1818.6–1703. When looked at in the context of the other SFXTs, IGR J16465–4507 sits in the middle of the class. This implies a longer orbit than typical wind accreting supergiant systems, but without evidence for accretion from a circumstellar disk, as in Be X-ray binaries. Our measurement of the orbital period in this system, combined with bursting behaviour of the source and constraints on the eccentricity of the orbits support the picture of accretion from a clumpy wind (Negueruela et al., 2006; Ducci et al., 2009). The underlying modulation in the phase folded light curve can be explained by the eccentricity of the system as with IGR J17544–2619 (Clark et al., 2009). However, as shown in figure 5, an underlying periodic emission, around periastron, does appear to be present in the phase folded light curve even when bright outbursts have been subtracted.
5 Conclusions
IGR J16465–4507 has been shown to exhibit an 30 day periodicity in both the INTEGRAL-IBIS and Swift-BAT light curves. This period is attributed to the orbital period of the system and corresponds to a semi-major axis of 121.9-126.3. This system is remarkably similar to SAX J1818.6–1703, except that IGR J16465–4507 is known to be further away, helping explain the lack of underlying emission that can only be seen in the phase-folded light curve of the entire INTEGRAL data set and not in the recurrence analysis. A low dynamic range is observed, which is higher than that of a typical supergiant HMXB. This would suggest that IGR J16465–4507 is an intermediate SFXT and that these may form a continuum ranging from typical supergiant HMXBs to the extreme SFXTs.
Acknowledgments
Based on observations with INTEGRAL, an ESA project funded by member states (especially the PI countries: Denmark, France, Germany, Italy, Switzerland, Spain), Czech Republic and Poland, and with the participation of Russia and the USA. A. B. Hill acknowledges support from the European Community via contract ERC-StG-200911. A. Bazzano and V. Sguera acknowledge support vai A.S.I. contract I/008/07. Swift-BAT transient monitor results provided by the Swift-BAT team.
References
- Bird et al. (2009) Bird A. J. et al, 2009, MNRAS, 393, L11
- Chaty (2010) Chaty, S. 2010, arXiv:1005.1995
- Clark et al. (2009) Clark, D. J., Hill, A. B., Bird, A. J., McBride, V. A., Scaringi, S., & Dean, A. J. 2009, MNRAS, 399, L113
- Corbet et al. (2006) Corbet, R., et al., 2006, Astron. Telegram, 779, 1
- Drilling & Landolt (2000) Drilling, J. S., & Landolt, A. U. 2000, Allen’s Astrophysical Quantities, 381
- Ducci et al. (2009) Ducci L. et al., 2009, arXiv:0906.3185
- Goldwurm et al. (2003) Goldwurm, A., et al., 2003, A&A, 411, L223
- Hill et al. (2005) Hill A. B. et al, 2005, A&A, 439, 255
- in’t Zand (2005) in’t Zand J. J. M., 2005, A&A, 441, L1
- Jain et al. (2009) Jain, C., Paul, B., & Dutta, A. 2009, MNRAS, 397, L11
- Kreykenbohm et al. (2008) Kreykenbohm, I., et al. 2008, A&A, 492, 511
- La Parola et al. (2010) La Parola, V., Cusumano, G., Romano, P., Segreto, A., Vercellone, S., & Chincarini, G. 2010, MNRAS, L63
- Lomb (1976) Lomb N. R., 1976, Ap&SS, 39, 447
- Lutovinov et al. (2004) Lutovinov, A., et al., 2004, The Astronomer’s Telegram, 329, 1
- Lutovinov et al. (2005) Lutovinov, A., et al., 2005, A&A, 444, 821
- Morris et al. (2009) Morris, D. C., et al., 2009, ApJ, 699, 892
- Negueruela et al. (2006) Negueruela I. et al, 2006, ESA SP-604, pp 165–170
- Nespoli et al. (2008) Nespoli, E., Fabregat, J., & Mennickent, R. E. 2008, A&A, 486, 911
- Rahoui & Chaty (2008) Rahoui, F., & Chaty, S. 2008, A&A, 492, 163
- Rahoui et al. (2008) Rahoui F. et al, 2008, A&A, 484, 801
- Scargle (1982) Scargle J. D., 1982, ApJ, 263, 835
- Scargle (1989) Scargle J. D., 1989, ApJ, 343, 874
- Sguera et al. (2005) Sguera V. et al, 2005, A&A, 444, 221
- Sguera et al. (2006) Sguera V. et al, 2006, ApJ, 646, 452
- Sguera et al. (2007) Sguera, V., et al. 2007, A&A, 467, 249
- Sguera et al. (2008) Sguera, V., et al. 2008, A&A, 487, 619
- Sidoli et al. (2007) Sidoli, L., Romano, P., Mereghetti, S., Paizis, A., Vercellone, S., Mangano, V., Götz D. 2007, A&A, 476, 1307
- Sidoli (2009) Sidoli, L., 2009, Advances in Space Research, 43, 1464
- Ubertini et al. (2003) Ubertini P. et al, 2003, A&A, 411, L131
- Walter et al. (2006) Walter R. et al, 2006, A&A, 453, 133
- Walter & Zurita Heras (2007) Walter R., Zurita Heras J., 2007, A&A, 476, 335
- Winkler et al. (2003) Winkler C. et al, 2003, A&A, 411, L1
- Zurita Heras & Walter (2004) Zurita Heras, J. A., & Walter, R. 2004, The Astronomer’s Telegram, 336, 1
- Zurita Heras et al. (2009) Zurita Heras, J. A., & Chaty, S. 2009, A&A, 493, L1