Hydrodynamic Models of Type I X-Ray Bursts: Metallicity Effects
Abstract
Type I X-ray bursts are thermonuclear stellar explosions driven by charged-particle reactions. In the regime for combined H/He-ignition, the main nuclear flow is dominated by the rp-process (rapid proton-captures and -decays), the -reaction, and the p-process (a suite of (,p) and (p,) reactions). The main flow is expected to proceed away from the valley of stability, eventually reaching the proton drip-line beyond A = 38. Detailed analysis of the relevant reactions along the main path has only been scarcely addressed, mainly in the context of parameterized one-zone models. In this paper, we present a detailed study of the nucleosynthesis and nuclear processes powering type I X-ray bursts. The reported 11 bursts have been computed by means of a spherically symmetric (1D), Lagrangian, hydrodynamic code, linked to a nuclear reaction network that contains 325 isotopes (from 1H to 107Te), and 1392 nuclear processes. These evolutionary sequences, followed from the onset of accretion up to the explosion and expansion stages, have been performed for 2 different metallicities to explore the dependence between the extension of the main nuclear flow and the initial metal content. We carefully analyze the dominant reactions and the products of nucleosynthesis, together with the the physical parameters that determine the light curve (including recurrence times, ratios between persistent and burst luminosities, or the extent of the envelope expansion). Results are in qualitative agreement with the observed properties of some well-studied bursting sources. Leakage from the predicted SbSnTe-cycle cannot be discarded in some of our models. Production of 12C (and implications for the mechanism that powers superbursts), light p-nuclei, and the amount of H left over after the bursting episodes will also be discussed.
1 Introduction
Type I X-ray bursts (hereafter, XRBs) are cataclysmic stellar events. They are powered by thermonuclear runaways (TNR) in the H/He-rich envelopes accreted onto neutron stars in close binary systems (see reviews by Bildsten 1998; Lewin et al. 1993, 1995; Psaltis 2006; Schatz & Rehm 2006; Strohmayer & Bildsten 2006). These events constitute the most frequent type of thermonuclear stellar explosion in the Galaxy (the third, in terms of total energy output after supernovae and classical novae), in part because of their short recurrence period (hours to days). About Galactic low-mass X-ray binaries exhibiting such bursting behavior (with burst durations of 10 - 100 s) have been found since the discovery of XRBs by Grindlay et al. (1976), and independently, by Belian et al. (1976). Type I X-ray bursts and their associated nucleosynthesis have been extensively modeled by different groups (see pioneering work by Woosley & Taam 1976, Maraschi & Cavaliere 1977, and Joss 1977), reflecting the astrophysical interest in determining the nuclear processes that power the explosion, the light curve, as well as in providing reliable estimates for the chemical composition of the neutron star surface (see Schatz et al. 1999, Parikh et al. 2008, and references therein).
With a neutron star hosting the explosion, temperatures and densities in the accreted envelope reach high values: T K, and g cm-3. As a result, detailed nucleosynthesis studies require the use of hundreds of isotopes, linked by thousands of nuclear interactions, extending all the way up to the SnSbTe-mass region (Schatz et al. 2001) or beyond (the extent of the nuclear activity111The nuclear activity reflects the changes in composition driven by different nuclear processes (i.e., p- and -capture reactions, -decays, …) that take place in the envelope at different stages of the burst. In this work, the extent of the nuclear activity is arbitrarily defined by the heaviest nucleus that achieves a mass fraction . in the XRB nucleosynthesis study of Koike et al. 2004 reaches 126Xe). Indeed, the extent of the rp-process in XRBs is still not clear: recent experimental work now shows that it will be more difficult to reach the SnSbTe-mass region (Elomaa et al. 2009). Because of computational constraints, XRB nucleosynthesis studies have been traditionally performed using limited nuclear reaction networks, truncated near Ni (Woosley & Weaver 1984; Taam et al. 1993; Taam, Woosley, & Lamb 1996 –all using a 19-isotope network), Kr (Hanawa, Sugimoto, & Hashimoto 1983 –274-isotope network; Koike et al. 1999 –463 nuclides), Cd (Wallace & Woosley 1984 –16-isotope network), or Y (Wallace & Woosley 1981 –250-isotope network). On the other hand, Schatz et al. (1999, 2001) have carried out very detailed nucleosynthesis calculations with a network containing more than 600 isotopes (up to Xe, in Schatz et al. 2001), but using a one-zone approach. Koike et al. (2004) have also performed detailed one-zone nucleosynthesis calculations, with temperature and density profiles obtained from a spherically symmetric evolutionary code, linked to a 1270-isotope network extending up to 198Bi.
Until recently, it has not been possible to couple hydrodynamic stellar calculations (in 1-D) and detailed networks. Recent efforts include Fisker et al. (2004, 2006, 2007, 2008), and Tan et al. (2007) ( 300 isotopes, up to 107Te), José & Moreno (2006) (2640 reactions and 478 isotopes, up to Te), or Woosley et al. (2004) and Heger et al. (2007) (up to 1300 isotopes with an adaptive network). This has prompted a detailed analysis of the nuclear activity powering the bursts. The most detailed work to date is that of Fisker et al. (2008), in the context of the 1-D general relativistic hydrodynamic code AGILE (Liebendörfer et al. 2002), linked to a nuclear reaction network containing 304 isotopes: a thorough analysis of the main nuclear activity in one characteristic burst is reported (although details for a sequence of 5 consecutive, ’representative’ bursts are also outlined). However, because of the specific choice of metallicity (Z = , for the accreted matter) and mass-accretion rate ( g s-1) adopted, the nuclear activity does not extend much beyond mass , as a result of compositional inertia effects, that quench further extension of the nuclear path. Hence, the flow does not reach the SnSbTe-mass region, which was suggested as a natural endpoint in XRB nucleosynthesis studies (see Schatz et al. 1999,2001).
Clearly, the identification of the most relevant reactions in the mass region remains to be addressed in detail in the framework of hydrodynamic simulations. This is particularly relevant since, as first pointed out by Hanawa et al. (1983), proton captures on heavy nuclei (i.e., the rp-process) have a dramatic effect on the shape of XRB light curves. To this end, a new set of type I X-ray bursts have been computed with SHIVA, a 1-D, spherically symmetric, hydrodynamic, implicit, Lagrangian code, used extensively in the modeling of classical nova outbursts (see José & Hernanz 1998). The code has been linked to a fully updated nuclear reaction network containing 324 nuclides and 1392 nuclear processes, a subset of that used in Parikh et al. (2008), and includes the most relevant charged-particle induced reactions occurring between 1H and 107Te, as well as their corresponding reverse processes. It is worth noting that the size of this network is similar (though slightly larger) to that adopted by Fisker et al. (2008). In order to set up the reaction rate library for our study, we started by adopting the proton drip line predicted by Audi et al. (2003a, 2003b). Experimental rates are available for a small subset of reactions (adopted from Angulo et al. 1999, Iliadis et al. 2001, and some recent updates for selected reactions). For all other reactions for which experimental rates are not available, we used the rates from the Hauser-Feshbach codes MOST (Goriely 1998; Arnould & Goriely 2006) and NON-SMOKER (Rauscher & Thielemann 2000; for details see Parikh et al. 2008). Neutron captures are disregarded since our early test calculations revealed that they play a minor role in XRB nucleosynthesis. All reaction rates incorporate the effects of thermal excitations in the target nuclei (Rauscher & Thielemann 2000). Screening factors are taken from Graboske et al. (1973) and DeWitt, Graboske, & Cooper (1973). For the weak interactions, -delayed nucleon emission and laboratory decay rates (Audi et al. 2003a) have been adopted. For a discussion of employing stellar versus laboratory decay rates, see Woosley et al. (2004). It is worth noting, however, that many computed stellar decay rates ( Fuller et al. 1982a, 1982b; Langanke & Martinez-Pinedo 2000) do not converge to their laboratory values at lower temperatures and densities, calling into question the model used for these calculations. Studies employing properly converging stellar decay rates for all isotopes relevant to XRB nucleosynthesis have not been performed by any group yet, and would certainly be interesting, although the results presented in this work would not be dramatically affected by their inclusion.
SHIVA uses a time-dependent formalism for convective transport whenever the characteristic convective timescale becomes larger that the integration time step. Partial mixing between adjacent convective shells is treated by means of a diffusion equation (Prialnik, Shara, & Shaviv 1979). No additional semiconvection or thermohaline mixing is considered. Models make use of Iben’s (1975) opacity fits, better suited than the OPAL opacities for astrophysical environments that exhibit strong variations in metallicity, as in XRB nucleosynthesis. However, plans to incorporate these more realistic opacities are currently underway. The adopted equation of state includes contributions from the electron gas (with different degrees of degeneracy; Blinnikov et al. 1996), a multicomponent ion plasma, and radiation; Coulomb corrections to the electronic pressure are also taken into account.
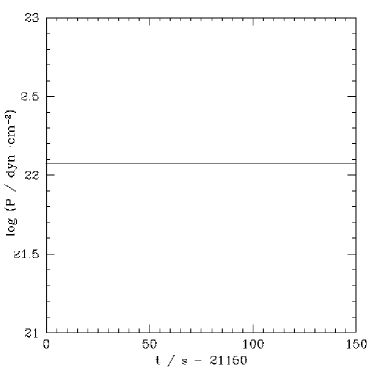
Accretion is computed by redistributing material through a constant number of envelope shells (see Kutter & Sparks 1980, for details). To handle this, a tiny envelope, containing g of material (less than 1 permil of the total envelope mass accreted during the first bursting episode), distributed through all the envelope shells, is put initially in place(the influence of the number of envelope shells on burst properties will be discussed in Section 3). The model is then relaxed using a few, very large timesteps, to guarantee hydrostatic equilibrium. The temperature at the bottom of the envelope barely reaches K, whereas the density is just g cm-3 (corresponding to a pressure of dyn cm-2). Mass accretion and nuclear reactions are then initiated.
Special emphasis is placed on the effect of the initial metallicity of the accreted matter on the main nuclear path, which in turn, will affect the final post-burst envelope composition and the shape of the light curves.
The structure of the manuscript is as follows: in Section 2, we analyze the main features (nuclear path, nucleosynthesis, light curves, etc) of a series of 4 bursts computed in a model with solar-like accreted material. The effect of the resolution adopted in this model is discussed in Section 3. A detailed analysis of the impact of the metallicity of the accreted material on burst properties is given in Section 4. Finally, a comparison with previous work, together with a thorough analysis of the corrections posed by general relativity, are discussed in Section 5.
2 Model 1
We summarize the gross properties of a series of thermonuclear bursts driven by mass accretion onto a 1.4 M⊙ neutron star (Lini = erg s-1 = 4.14 L⊙), at a rate acc = M⊙ yr-1 (corresponding to 0.08 Edd). The composition of the accreted material (see Table 1) is assumed to be solar-like (X=0.7048, Y=0.2752, Z=0.02). All metals are initially assumed to be in the form of 14N, following the rapid rearrangement of CNO isotopes that naturally occurs early in the burst (see Woosley et al. 2004). This model is qualitatively similar to model ZM, computed by Woosley et al. (2004) in the framework of the 1-D, hydrodynamic, implicit code KEPLER. This choice is made intentionally to compare with previous hydrodynamic studies. Notice, however, that Woosley et al. assume a value of 10 km for the neutron star radius. In contrast, our model yields a value of 13.1 km, following the integration of the neutron star structure222The Harrison-Wheeler equation of state (see Shapiro & Teukolsky 1983) has been adopted to build up the initial neutron star configuration in hydrostatic equilibrium conditions. Although this equation of state is a rather crude approximation to the physical conditions in the very deep interior of a neutron star, the radius obtained is in good agreement with the values derived with more accurate equations of state (Lattimer 2009). from the core to its surface, in hydrostatic equilibrium. Differences in the neutron star size (and in turn, in surface gravity) may effect the strength of the explosion (mass accreted, peak temperature, nucleosynthesis, etc).
2.1 First burst
The piling up of solar-like material on top of the neutron star during the accretion stage progressively compresses and heats the envelope (consisting of 60 shells). Indeed, only 145 seconds since the beginning of accretion, the temperature at the base of the envelope reaches T K (with exceeding g cm-3).
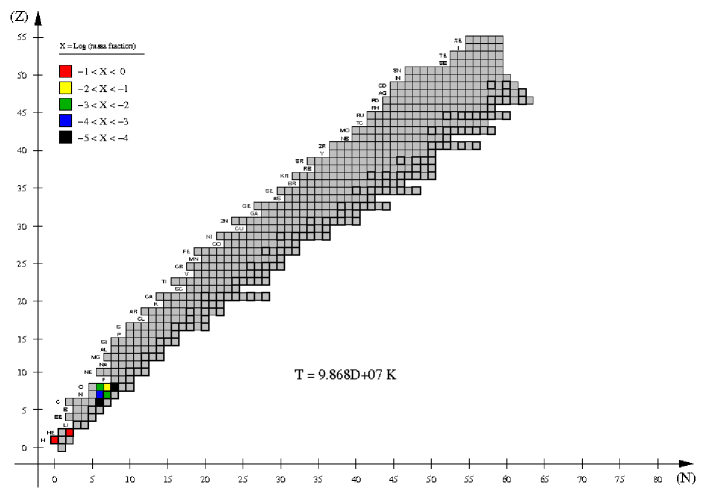
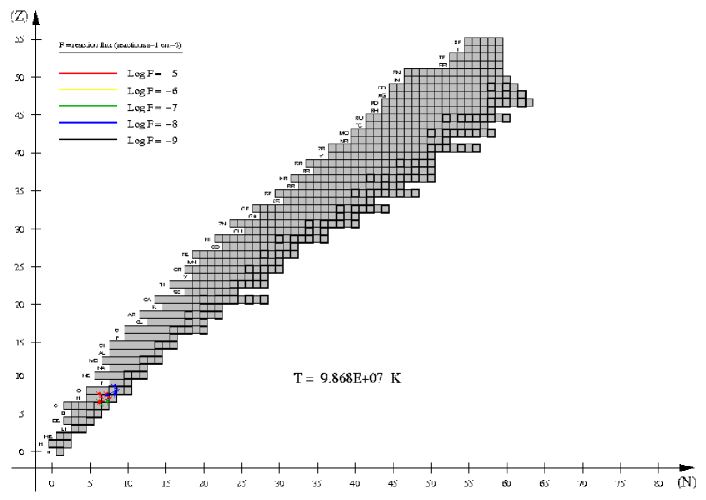
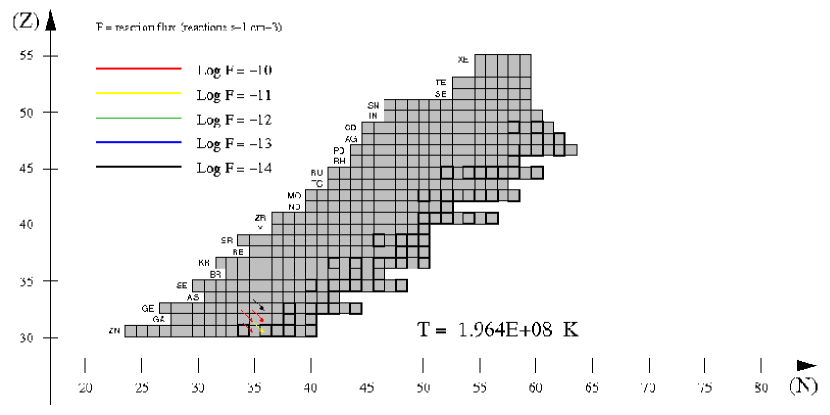
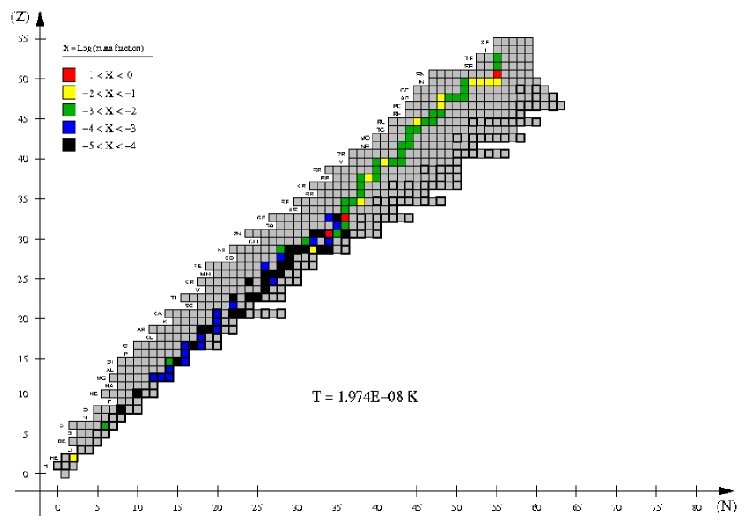
The early nuclear activity is fully dominated by H-burning through hot CNO-cycle reactions, initiated by proton-captures on 14N nuclei. At this stage (t=2327 s), the envelope achieves T K ( g cm-3), with an energy generation rate of erg g-1 s-1. The main reaction path (see Fig. 1) is led by 15N(p, )12C, which powers 12C(p, )13N(p, )14O()14N(p, )15O()15N. This suite of nuclear processes competes with 13N()13C(p, )14N, and to a lesser extent, with 15N(p, )16O(p, )17F()17O(p, )14N. Besides H (X=0.689) and 4He (Y=0.290), the next most abundant species in the envelope is now 15O (). The amount of unburned 14N has dropped to (in the following, when discussing the nucleosynthesis, we will refer to abundances by mass, i.e., mass fractions). Other CNO-group nuclei, such as 12C (), 13N (), 14O (), or 16O (), have already achieved an abundance .
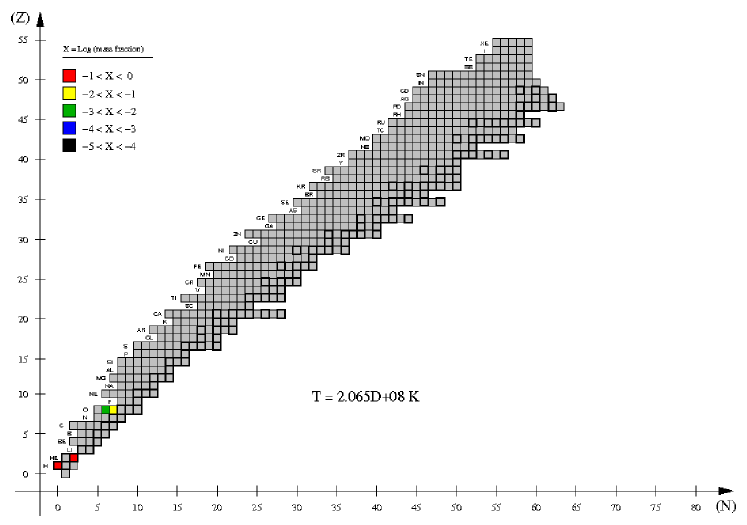
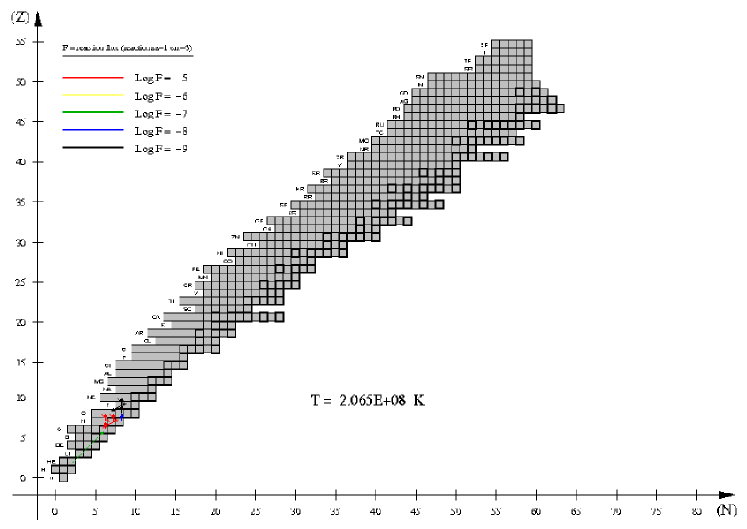
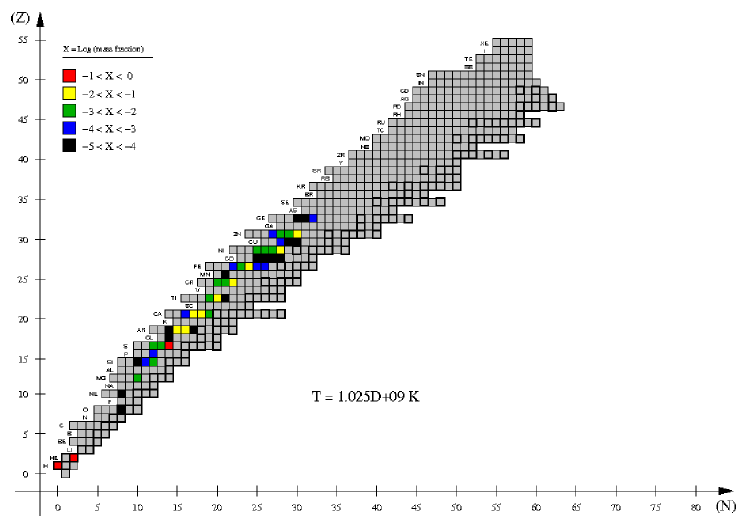
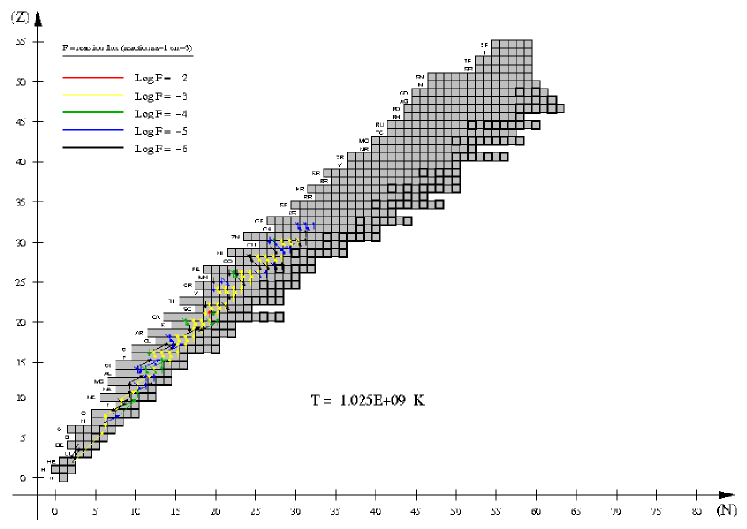
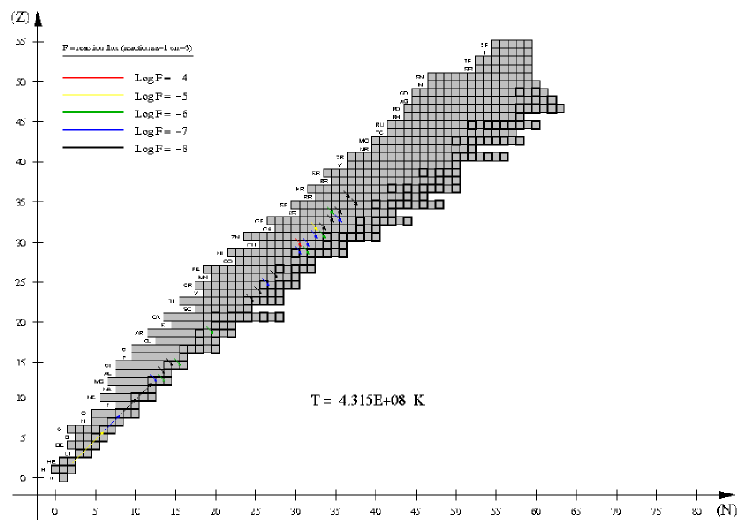
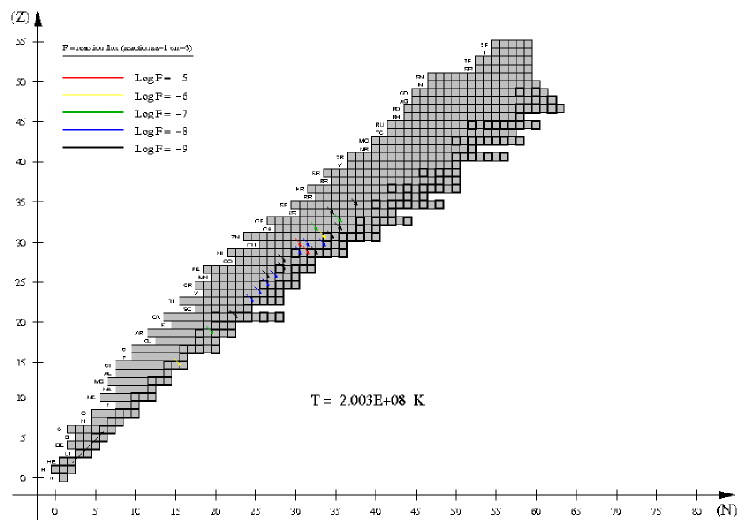
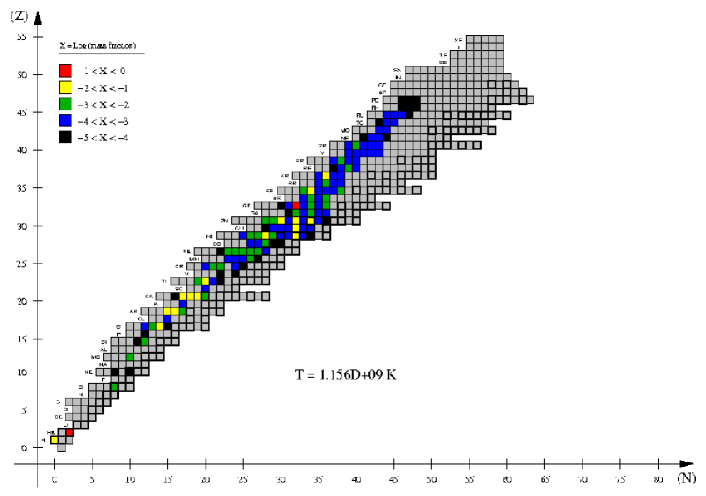
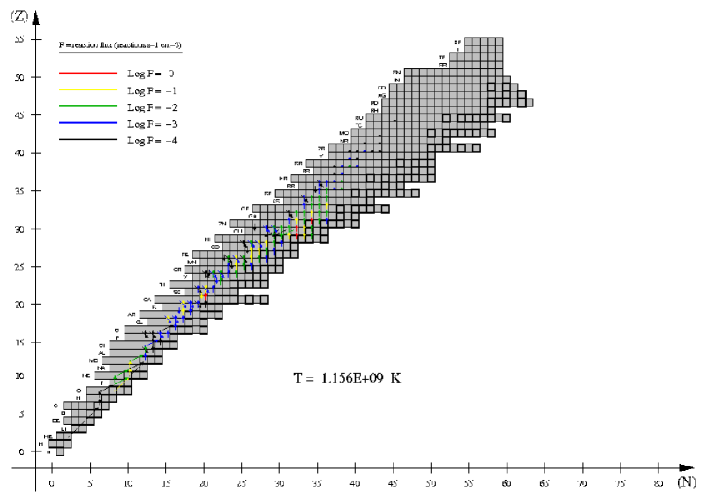
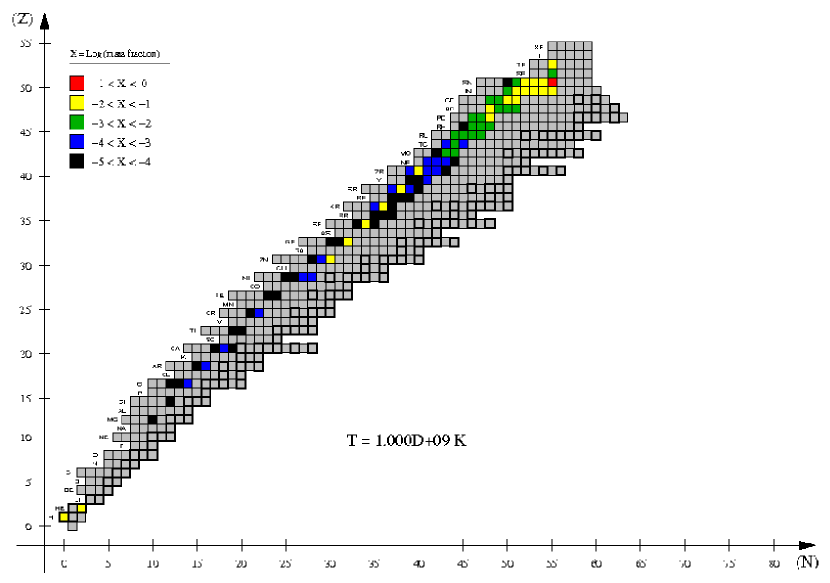
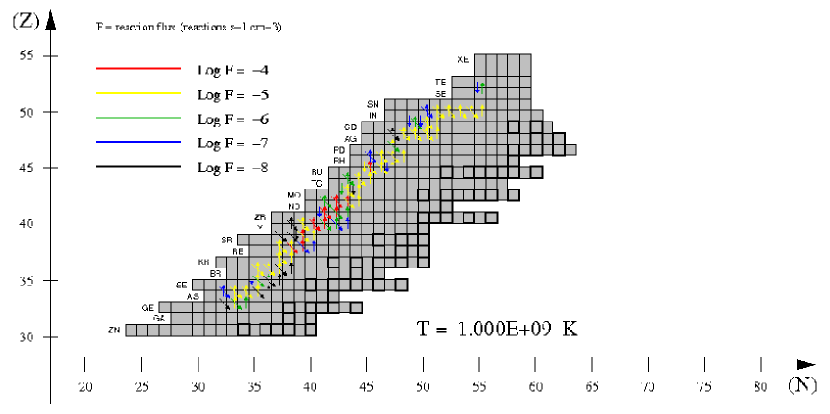
4.49 hours (16,163 s) after the beginning of accretion, Tbase reaches K. Mass accretion in highly degenerate conditions has compressed the envelope base to a density of g cm-3 (P dyn cm-2). The total luminosity of the star has now increased to a value of erg s-1. The main nuclear activity333Equilibrium (p,)-(),p) pairs have been removed from the accompanying plots to highlight those reactions of lower flux that directly lead to the production of heavier species during the burst. (Fig. 2) is still dominated by proton-captures and -decays, characteristics of the hot CNO-cycle, now supplemented by 15N(p, )16O(p, )17F(p, )18Ne()18F(p, )15O, and by the 3 reaction. The numerous p-captures have reduced the hydrogen content to 0.408. In turn, 4He has increased to 0.570, becoming now the most abundant species at the base of the envelope (followed by the short-lived species 14O [] and 15O []), while most of the CNO nuclei have been reduced to , by mass). The extension of the main nuclear activity reaches 40Ca. Indeed, 32S and 40Ca are the only species in the Ne-Ca mass region with abundances exceeding .
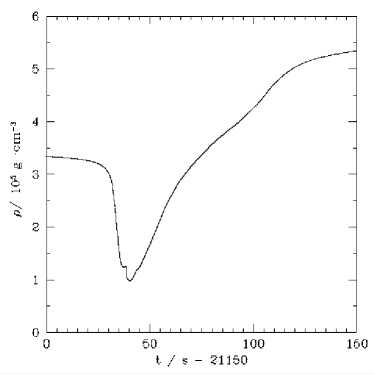
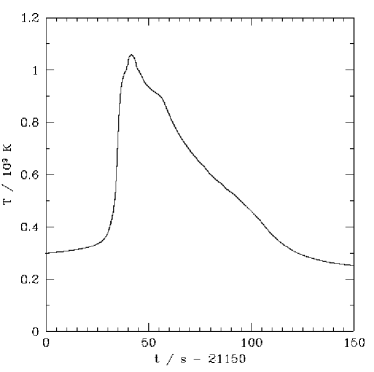
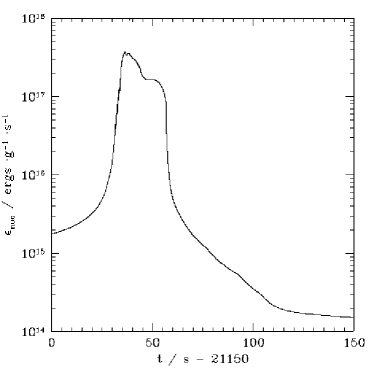
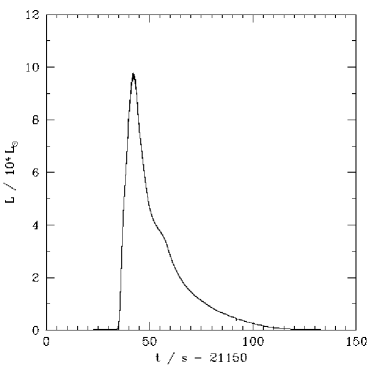
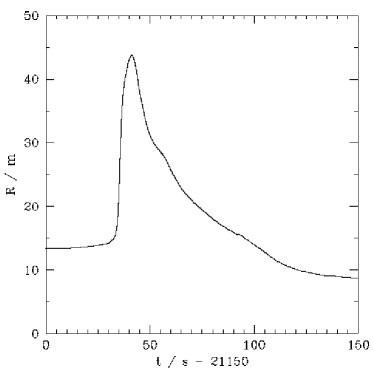
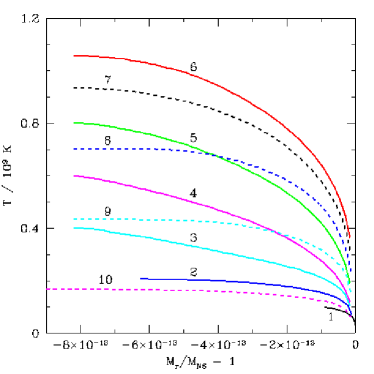
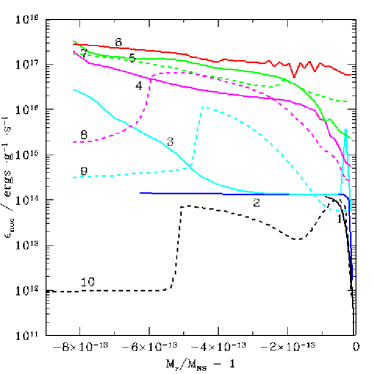
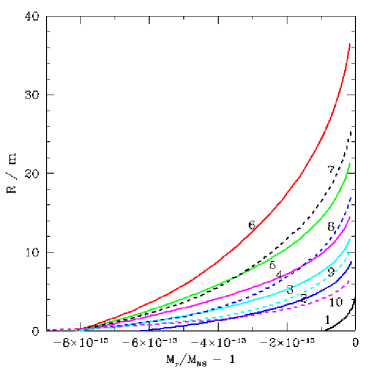
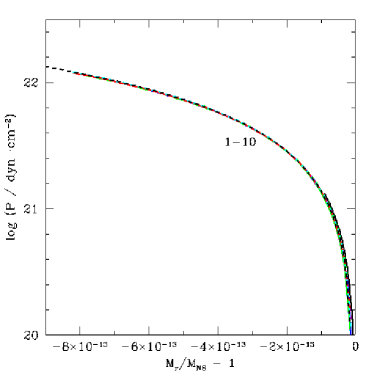
Convection sets in erratically, at m above the core-envelope interface (the overall envelope size, , is 14 m), when Tbase reaches K, and progressively extends throughout the whole envelope. Time evolution of density, temperature, pressure, and rate of nuclear energy generation, at the innermost envelope shell, as well as of the overall neutron star luminosity and envelope size, are shown in Figs. 7 and 8.
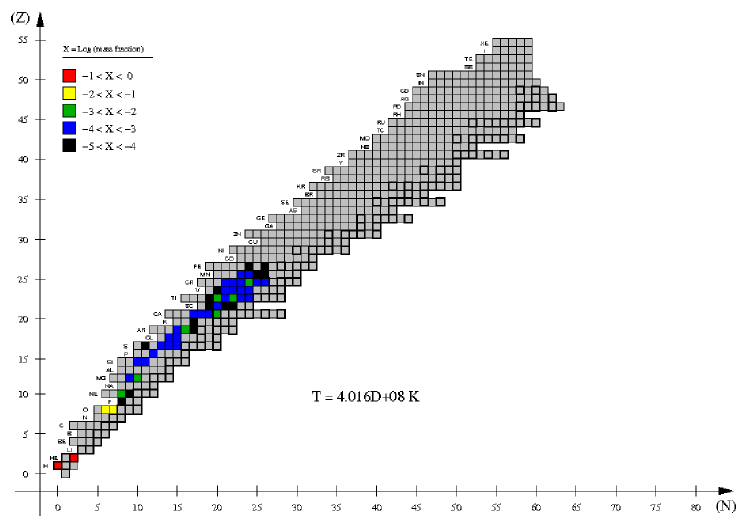
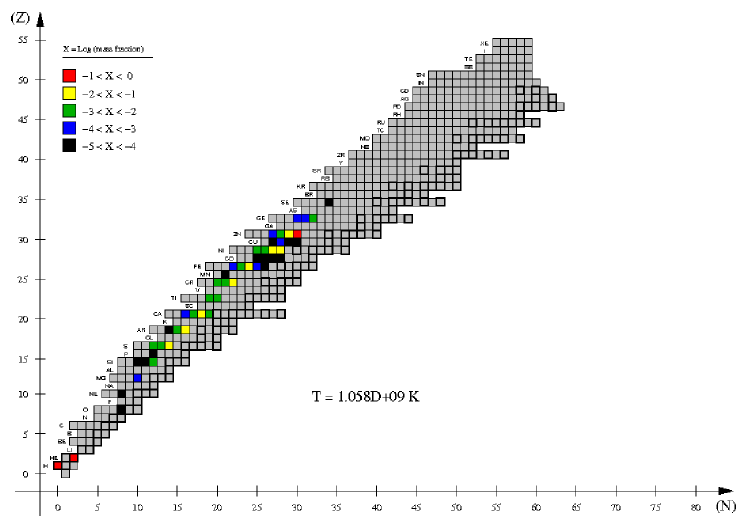
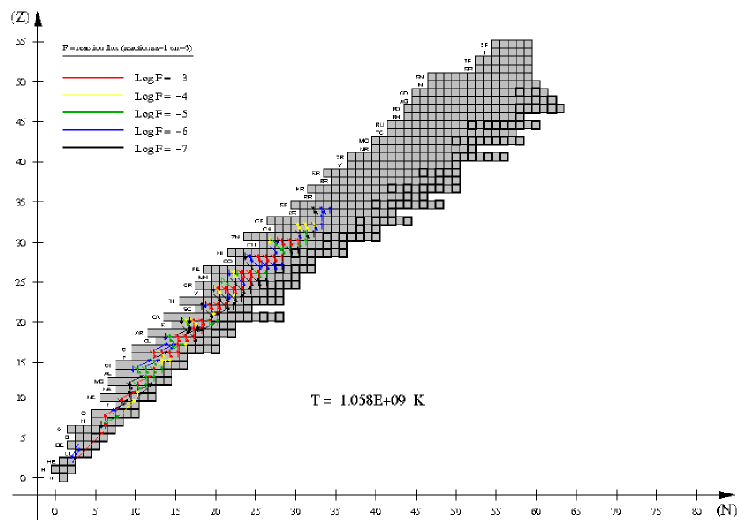
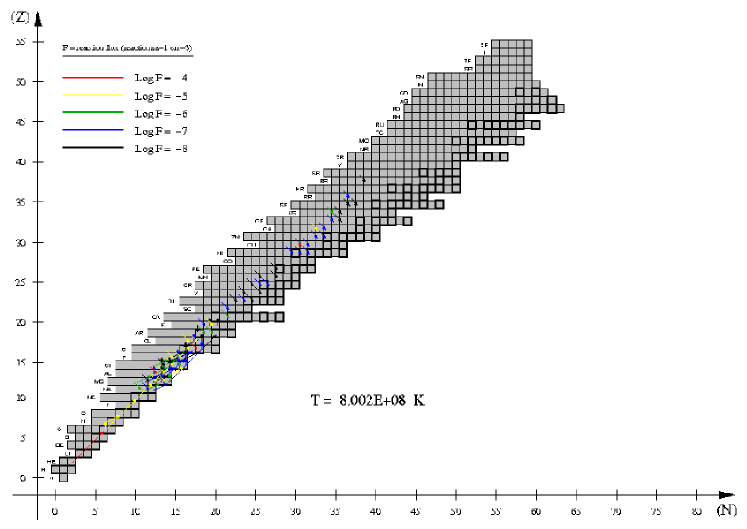
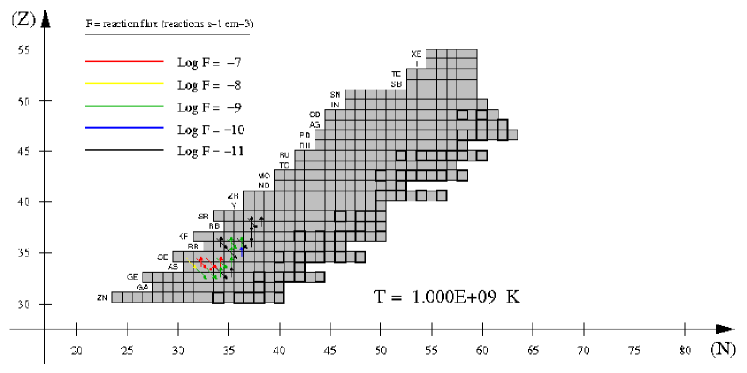
Shortly after, at t=5.88 hours (21,181 s), Tbase reaches K (with g cm-3, and P dyn cm-2). The hydrogen content has dropped to 0.209, whereas 4He achieves 0.625. In turn, the rate of nuclear energy generation has increased to a value of erg g-1 s-1. The metallicity of this innermost envelope shell has increased from an initial value of 0.02 to 0.17, due to leakage from CNO cycle (mainly powered by 15O(, )). As before, the next most abundant species are 14O (), and 15O (), but the number of isotopes with moderately large abundances has now increased. Indeed, 40Ca, 22Mg, 18Ne, 34Ar, 48Cr, and 42,44Ti, have achieved mass fractions of the order of . The nuclear activity extends as far as 53Co. The largest reaction fluxes (number of reactions per unit time and volume) correspond to the equilibrium processes 21Mg(p, )22Al(, p)21Mg, 30S(p, )31Cl(, p)30S, and 25Si(p, )26P(, p)25Si. Additional activity is powered by 3C(p, )13N(p, )14O, followed by 14O(, p)17F(p, )18Ne. The suite of secondary nuclear paths is rich and complex (see Fig. 3), and is mainly dominated by p-capture reactions and -decays, as well as by the CNO-breakout reaction 15O(, )19Ne. It is worth noting that the main nuclear path above Ca begins to move away from the valley of stability, towards the proton-drip line (see Fig. 3, lower panel).
Just 2.3 seconds later (t = 21,183 s), Tbase achieves K. has slightly decreased to g cm-3 because of a mild envelope expansion ( m). Notice, however, that P dyn cm-2. Hence, the TNR is taking place nearly at constant pressure. A time-dependent, convective mixing with adjacent shells, with a characteristic timescale of s ( cm s-1), causes a slight increase in the H abundance at the base of the envelope. Indeed, the H abundance is now 0.288, by mass, whereas the 4He content has slightly decreased to 0.563 (due to the high temperatures, favoring -captures). The next most abundant species is now 18Ne (), together with 14,15O (, and , respectively). Several isotopes, such as 21,22Mg, 29,30S, 50,52Fe, 27P, 24,25Si, 49,50,51Mn, and 34Ar, have achieved abundances an order of magnitude lower (). The nuclear activity extends up to 57Cu now, powering an energy generation rate of erg g-1 s-1, and an overall luminosity of erg s-1. The largest fluxes still correspond to the forward and reverse reactions 30S(p, )31Cl(, p)30S, 21Mg(p, )22Al(, p)21Mg, and 25Si(p, )26P(, p)25Si, together with 14O(, p)17F(p, )18Ne. 14O+ becomes the most important -capture reaction, overcoming 15O(, ), or the 3. Additional activity is driven by 18Ne()18F(p, )15O, 19Ne(p, )20Na(p, )21Mg, 21Na(p, )22Mg(p, )23Al, 12C(p, )13N(p, )14O, and 26Si(p, )27P.
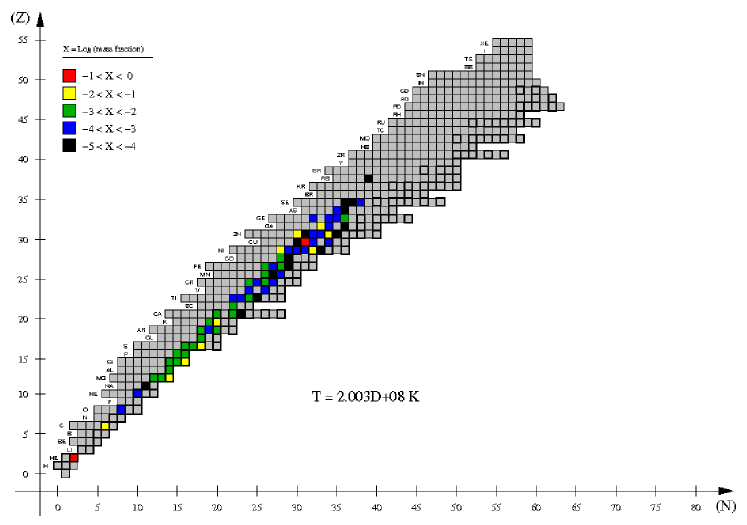
A qualitatively similar picture is found when Tbase achieves K (t = 21,185 s), with the most abundant species at the envelope base being H (0.308), 4He (0.507), 18Ne (), 22Mg (), 29,30S (, and , respectively), and 24,25Si ( and , respectively). The number of species with abundances of the order of includes now 54,55,56Ni, 15O, 28S, 52Fe, 27P, 38Ca, and 33,34Ar, with the main nuclear activity (see Fig. 4) extending all the way up to 60Zn. The largest reaction fluxes are achieved by the equilibrium processes described before, supplemented now by 26Si(p, )27P(, p)26Si, 22Mg(p, )23Al(, p)22Mg, 29S(p, )30Cl(, p)29S, and 16O(p, )17F(, p)16O, followed by p-capture reactions (and -decays) on Ne-Mg nuclei, such as 19Ne(p, )20Na(p, )21Mg()21Na(p, )22Mg, or 17F(p, )18Ne()18F(p, )15O, and by the -capture reactions 15O(, )19Ne, 14O(, p)17F, and the 3.
One second later (t = 21,186 s), Tbase achieves K. The hectic nuclear activity, which at this stage releases erg g-1 s-1, has reduced the H and 4He abundances down to 0.262 and 0.457, respectively. The next most abundant species are now 22Mg, 25Si, 28,29,30S, 33,34Ar, and 60Zn, all with mass fractions . The main nuclear activity has extended up to 68Se. Aside from equilibrium (p, ) and (, p) pairs (that involve 16O-17F and a handful of species in the mass range Mg-Zn), the largest reaction fluxes correspond to a suite of p-captures and -decays (see Fig. 5, lower panel), mainly 25Al(p, )26Si, and 27,28,29P(p, )28,29,30S. Moreover, the most important -capture reactions, 22Mg(, p)25Al, the 3, 18Ne(, p)21Na, and 14O(, p)17F, have fluxes of the order of log F -3 (notice the moderate extension of -captures towards heavier species as a result of the higher temperatures). A very limited nuclear activity in the A=65-100 mass region is, at this stage, driven by 65Ge(p, )66As(p, )67Se()67As(p, )68Se (with log F -8), and 66As()66Ge(p, )67As (log F -9).
At t = 21,188 s, when Tbase achieves K, the energy generation rate by nuclear reactions reaches its maximum value: erg g-1 s-1. Two seconds later, the envelope will attain maximum expansion, with a size m.
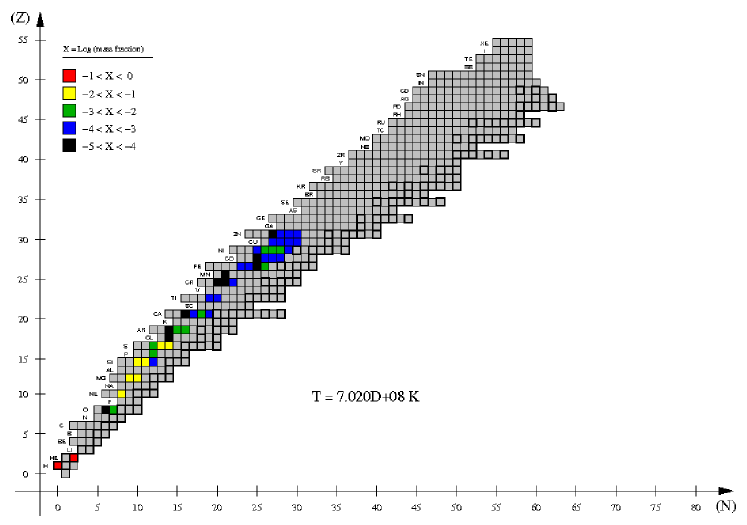
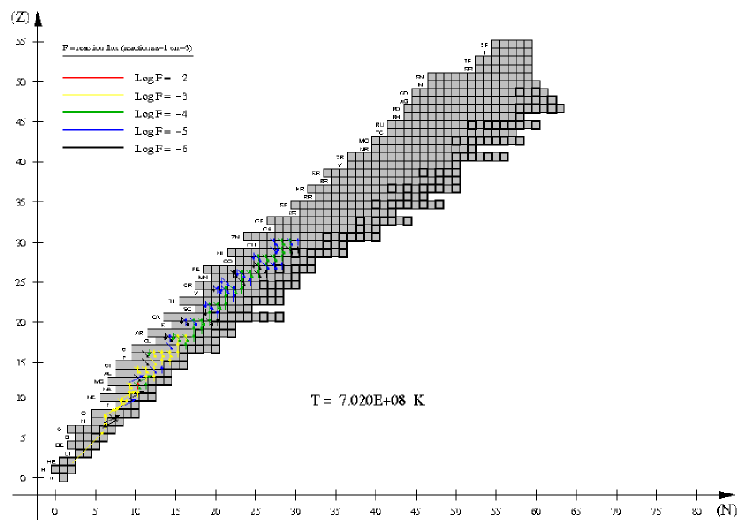
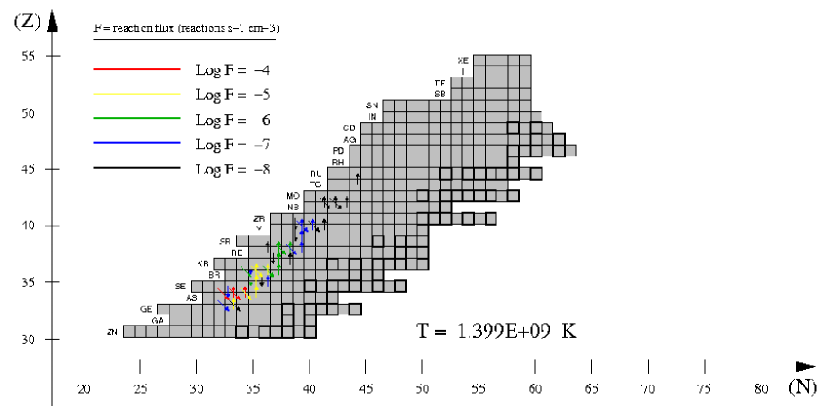
Proton and -captures continue to reduce the overall H and He abundances at the envelope base (0.191 and 0.400, respectively). The next most abundant species is now 30S (0.103) -a waiting point for the main nuclear path-, followed by 33,34Ar, 37,38Ca, 42Ti, 46Cr, 50Fe, 56Ni, and 60Zn (all with X). The nuclear activity has reached 76Sr (see Fig. 6). In the A=65-100 mass region, in particular, the nuclear activity is now dominated by the chains 65Ge(p, )66As(p, )67Se()67As(p, )68Se (with log F -7), 66As()66Ge(p, )67As (log F -8), 65As(p, )66Se()66As, and 68Se()68As(p, )69Se(p, )70Br(p, )71Kr()71Br(p, )72Kr (log F -9). In terms of energy production, the most important contributions come from 39Ca(p, )40Sc (log F -2), multiple (p, )-reactions involving species in the mass range A 20-60, and a handful of -capture reactions, such as 22Mg(, p)25Al, 18Ne(, p)21Na, the 3, and 14O(, p)17F (log F -3).
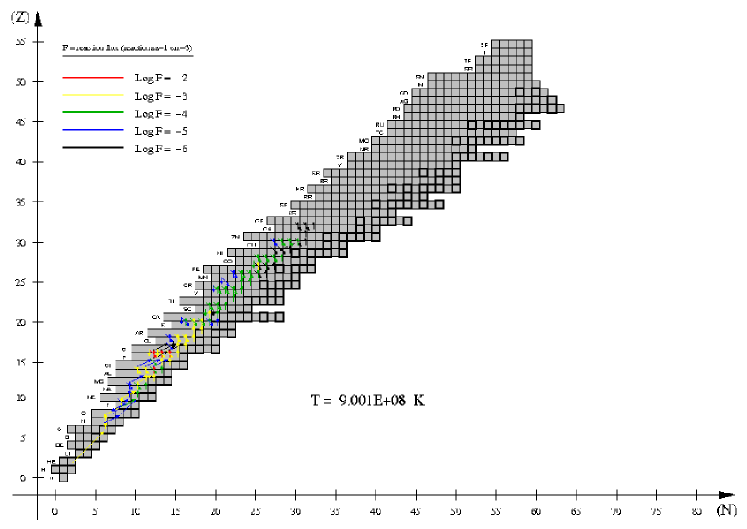
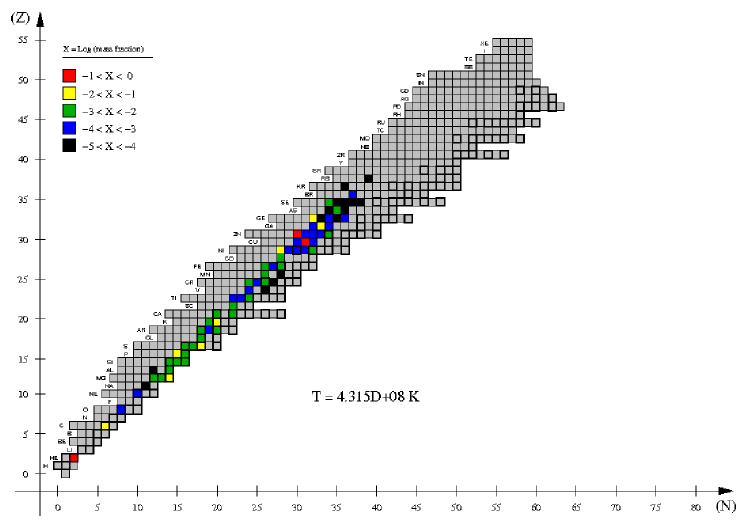
Four seconds later, the envelope base achieves a maximum temperature of K (similar values are reported in the simulations by Fisker et al. 2008). Besides H (0.220) and 4He (0.370), the next most abundant isotope is now 60Zn (0.159) -another waiting point for the nuclear flow-, followed by 30S (), 34Ar (), 38Ca (), 46Cr (), 50Fe (), 55,56Ni (, and , respectively), and 59Zn (). As shown in Fig. 9, the extension of the main nuclear path reaches 80Zr. The nuclear activity in the A=65-100 mass region is now dominated by 65Ge(p, )66As(p, )67Se()67As(p, )68Se (log F -6), 65As(p, )66Se()66As (log F -7), and 66As()66Ge(p, )67As, 68Se()68As(p, )69Se(p, )70Br(p, )71Kr()71Br(p, )72Kr (log F -8). Energy production is due to dozens of (p, )-reactions involving species in the mass range A 20-60, plus some -capture reactions, such as the 3, 14O(, p)17F, 22Mg(, p)25Al, and 18Ne(, p)21Na (log F -3). Less than a second later (t = 21,192.3 s), the neutron star reaches maximum luminosity, Lmax = erg s-1 ( L⊙).
The numerous proton-captures on many species during the decline from Tpeak reduce dramatically the H content in the innermost shell. Indeed, when Tbase achieves K (t = 21,200 s), the H abundance drops below 0.1, while X(4He) = 0.283. Actually, the most abundant species in this shell is now 60Zn (0.43 by mass), followed by 30S (), 34Ar (), 38Ca (), 56Ni (), and 64Ge (). The nuclear activity reaches 90Ru.
Five seconds later (t = 21,205 s), when Tbase drops to K, 60Zn achieves a maximum abundance of 0.519, by mass. H has been reduced to (X(4He)=0.226). The next most abundant species are now 26Si, 30S, 34Ar, 38Ca, 56Ni, and 64Ge (all with mass fractions ). The nuclear activity has not progressed beyond 90Ru. The largest reaction fluxes correspond to proton-captures and reverse photodisintegration reactions at equilibrium. Many other nuclear processes (-decays and -induced reactions like the triple-, 14O(, p)17F, or 22Mg(, p)) contribute to the overall nuclear activity (see Fig. 10). In the A=65-100 mass region, this is driven by 65Ge(p, )66As (followed either by 66As(p, )67Se()67As, or by 66As()66Ge(p, )67As), 67As(p, )68Se()68As(p, )69Se (log F -5), 69Se(p, )70Br()70Se(p, )71Br()71Se, 74Rb()74Kr (log F -6), and 70Br(p, )71Kr()71Br, 72Kr()72Br(p, )73Kr(p, )74Rb, 74Kr(p, )75Rb(p, )76Sr (log F -7). Energy production is due to (p, )-reactions involving species in the mass range A 20-55, and also to two -capture reactions, 14O(, p)17F, and 22Mg(, p)25Al (log F -3).
Following the fast decline in temperature, when T K (t = 21,212 s), the 60Zn abundance has dropped to 0.509, due to -decays. H has been heavily depleted (), whereas 4He has been slightly reduced to an abundance of 0.190. The next most abundant species are 12C, 30P, 39K, 56Ni, 60Cu, and 64Ge. The extent of the nuclear activity (Fig. 11) is still restricted to 90Ru; it will not proceed beyond this endpoint, first because of the heavy H depletion, and second, because the temperature is already too low to allow proton- or -captures on heavier species due to their large Coulomb barriers. At this stage, the single, most important reaction, in terms of reaction fluxes, is the triple-, followed by a suite of -decay reactions, such as 26Si()26mAl()26Mg, 34Cl()34S, 60Zn()60Cu, or 27Si()27Al. Several -captures follow the triple- reaction as a chain: 12C(, )16O(, )20Ne(, )24Mg(, )28Si(, )32S, or through alternative paths, proceeding close to the valley of stability, up to Ar, such as 13N(, p)16O, 25,27Al(, p)28,30Si, 22Mg(, p)25Al, 22Na(, p)25Mg, or 26,27Si(, p)29,30P, to quote some representative cases (see Fig. 11). has already declined to a value of erg g-1 s-1.
When Tbase drops to K (t = 21,254 s), the nuclear energy generation rate has declined to a value of erg g-1 s-1. As shown in Fig. 12, the nuclear activity is dominated by 60Zn()60Cu, because of its very large abundance (X(60Zn)=0.416), and is followed by the triple- reaction (X(4He)=0.137), and by a suite of -decays of very abundant isotopes, such as 64Ge, 30P, 64Ga, or 60Cu (all with mass fractions , except 60Cu [0.104]), followed by those of 38K, 26mAl, 68Se, 25Al, 68As, 63Ga, 59Cu, and 61Zn. Other species, such as 12C, 26Mg, 34S, 39K, or 56Ni, have achieved an abundance of by mass at this stage. The envelope has already shrunk to a size m, whereas the overall luminosity of the star has decreased to LNS = erg s-1.
When Tbase reaches K (t = 21,618 s), 60Zn has remarkably decayed into 60Cu, which now constitutes the most abundant species (with 0.393) at the base of the envelope. Because of the relatively low temperatures, the 4He abundance is kept constant, at about 0.136. The next most abundant species are now 12C, 26Mg, 30Si, 34S, 39K, 56Ni, 60Ni, 64Ga, and 64Zn. With the exception of the limited contribution of the triple- reaction, the main nuclear path (Fig. 13) is fully dominated by a suite of -decays on numerous species, all the way up to 72Br.
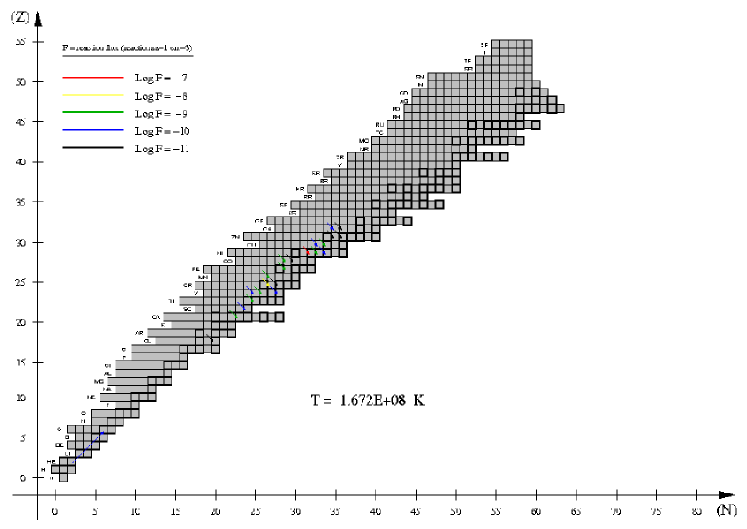
When t = 28,250 s, Tbase reaches a minimum value of K, which we consider to mark the end of the first burst in our simulations. 60Cu has decayed already into 60Ni, now the most abundant species at the envelope base with a mass fraction of 0.504, followed by 4He (0.136, not fully consumed during the TNR), and by 12C, 26Mg, 30Si, 34S, 39K, 56Ni, 60Cu, and 64Zn (see Fig. 14). The marginal nuclear activity played by a suite of -decays powers a rate of nuclear energy generation of erg g-1 s-1. At this stage, the size of the envelope has shrunk to m, whereas the overall luminosity of the star has decreased to LNS = erg s-1.
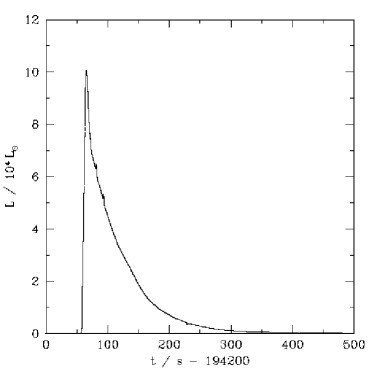
Profiles of density, temperature, rate of energy generation, pressure, and size, along the accreted envelope, for different snapshots during the first bursting episode computed in this model, are shown in Figs. 15 and 16.
It is worth noting that the main nucleosynthetic activity takes place at the innermost, hottest envelope shell. Because of their lower temperatures and densities, all layers above the ignition shell show a similar nucleosynthetic pattern but somewhat diluted, limiting the extent of the nuclear activity to lower masses. Even though the specific reaction sequences have a clear dependence with depth (see Fisker et al. 2008, for the corresponding analysis in one bursting episode), it is clear that the identification of the main nuclear processes responsible for the nucleosynthesis in XRBs can rely on an accurate account of the activity at the ignition shell, at different stages of the TNR, as performed in this paper. However, we would like to outline schematically how depth influences the extent of the nuclear activity throughout the envelope: while in the innermost shells of our computational domain (encompassing g) the nuclear activity reaches 90Ru, at g above the core-envelope interface, the activity stops around 78Sr (the final mass fraction of 90Ru barely reaches , by mass), while close to the surface ( g), the nuclear activity does not extend beyond 72Se (X(90Ru) ). Moreover, the purely nucleosynthetic imprint in these shells is difficult to assess since it is partially poisoned by changes in the chemical composition driven by convective mixing.
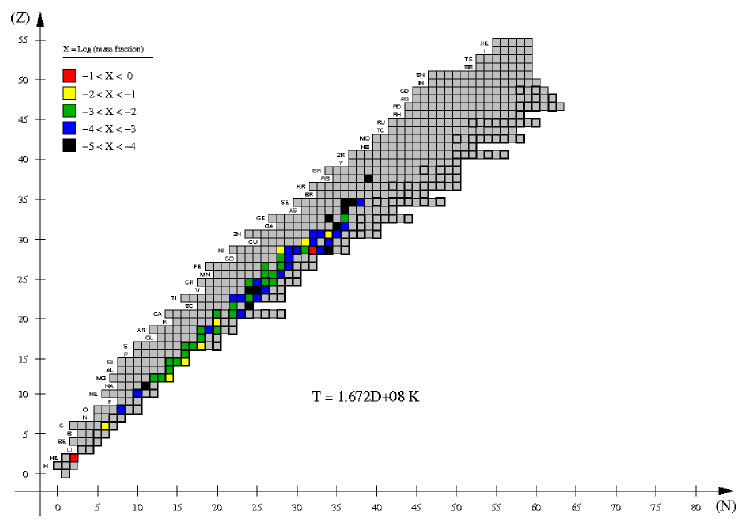
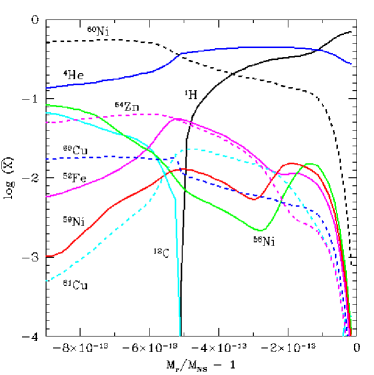
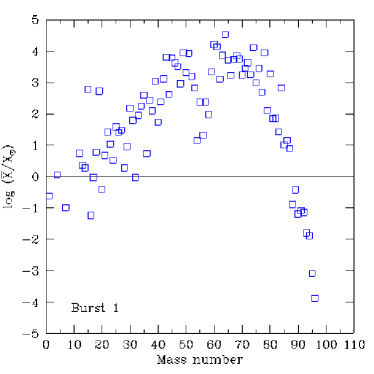
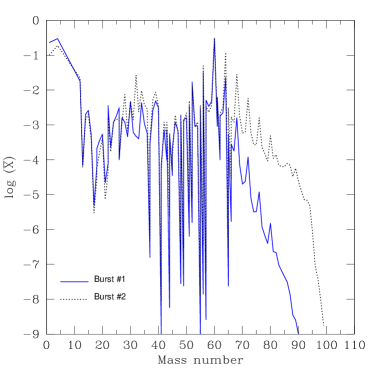
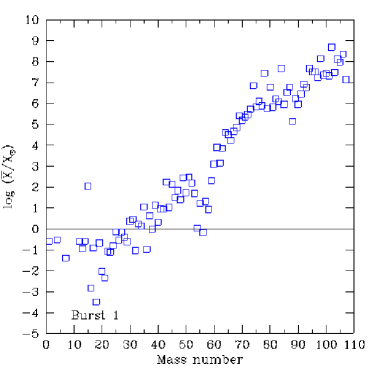
All in all, the mean, mass-averaged chemical composition of the envelope at the end of this first burst, is mainly dominated by the presence of intermediate-mass elements (far below the SnSbTe-mass region). This includes 60Ni (0.32), 4He (0.31), 1H (0.17), 64Zn (0.03), 12C (0.02), 52Fe (0.02), or 56Fe (0.02) (see Table 2, for the mean composition of all species -stable or with a half-life hr- which achieve X), with a nucleosynthesis endpoint (defined by the heaviest isotope with X) around 89Nb (in agreement with the results reported by Fisker et al. 2008). In terms of overproduction factors, (ratio of the mass-averaged composition of a given isotope over its solar abundance; see also Figs. 17 and 19), 43Ca, 45Sc, 49Ti, 51V, 60,61Ni, 63,65Cu, 64,67,68Zn, 69Ga, 74Se, and 78Kr achieve a value of .
It is important to stress that the presence of unburned H and 4He in the envelope, at the end of the first burst, will have consequences for the subsequent eruptions (see Section 1.2). Notice, however (Fig. 17), that since the innermost envelope is devoid of H, the next burst will likely initiate well above the core-envelope interface. Moreover, the presence of unburned 12C, particularly in the inner envelope layers, has important implications for studies of the physical mechanism that powers superbursts (see Sect. 2.2).
2.2 Second, third, and fourth bursts
For conciseness, we will focus here on the main differences between the first and successive bursts computed for model 1. A first, remarkable difference is due to the so-called compositional inertia (Taam 1980; Woosley et al. 2004), which accounts for differences in the gross properties of the bursts driven by changes in the chemical content of the envelope. Indeed, after the first burst, the accreted matter will pile up on top of a metal-enriched envelope (the initial metallicity, Z, has risen to a mass-averaged value of Z 0.52, at the end of the first burst) that is devoid of H at its innermost layers. This will cause a shift in the location of the ignition region, progressively moving away from the core-envelope interface in successive flashes (see Fig. 18, right panel).
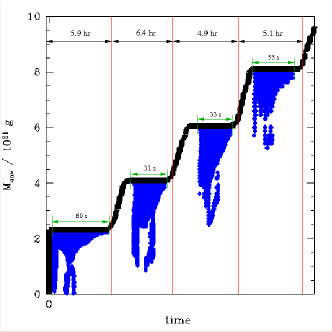
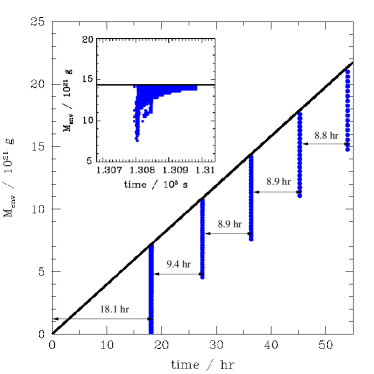
This is schematically shown as well in Fig. 18 (left panel), which depicts the mass above the neutron star core, as well as the extension of the convective regions throughout the envelope, for the four bursting episodes computed in this model: the peaks of the explosions ( s) correspond to the flat regions of the diagram, whereas the stages of steady accretion ( hr) are indicated by the steep slopes. Notice that, in agreement with previous work (Woosley et al. 2004, Fisker et al. 2008), convection mainly develops around the peak of the bursts (during most of the explosion, energy transport is carried by radiation only). Notice also that because of fuel consumption (H, He), the location of the ignition shell (and the extent of the convective regions) moves progressively away in mass from the neutron star core.
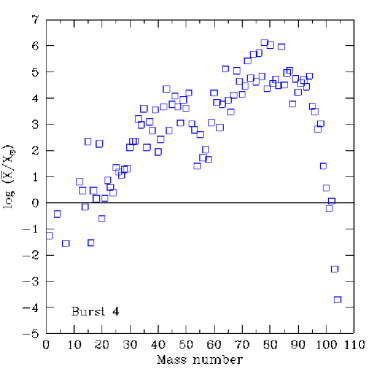
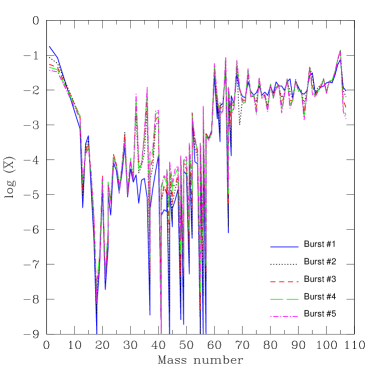
From the nucleosynthesis viewpoint (Table 2 and Figs. 17 and 19), the nuclear activity extends progressively towards heavier species, reaching endpoints (X) around 89Nb (1st burst), 97Ru (2nd burst), 99Rh (3rd burst), and 100Pd (4th burst). The main nuclear activity and the dominant reaction fluxes at peak temperature, for the 4th burst computed in this model, are shown in Fig. 21. The overall mean metallicity of the envelope at the end of each burst is 0.52 (1st burst), 0.71 (2nd burst), 0.80 (3rd burst), and 0.86 (4th burst). This increase in Z reflects both the nuclear activity during each individual burst and the accumulated ashes from previous bursts. A similar mass-averaged 12C yield of is systematically obtained at the end of each of the 4 bursts computed. This is not enough to power a superburst, which requires X(12C), at the envelope base (see Cumming & Bildsten 2001, Strohmayer & Brown 2002, Brown 2004, Cooper & Narayan 2004, 2005, Cumming 2005, or Cooper et al. 2006). With respect to overproduction factors, the increase in nuclear activity reported for successive bursts translates also into larger values, as high as , for 76Se, 78,80Kr, and 84Sr, or , for species such as 64,68Zn, 72,73Ge, 74,77Se, 82Kr, 86,87Sr, 89Y, and 94Mo, for the 4th bursting episode (see Figs. 17 and 19).
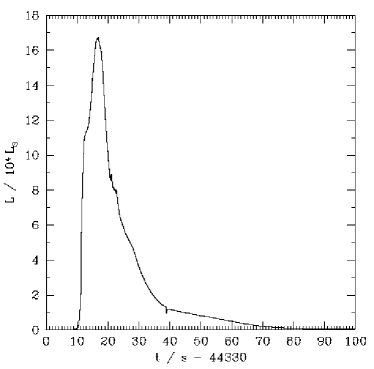
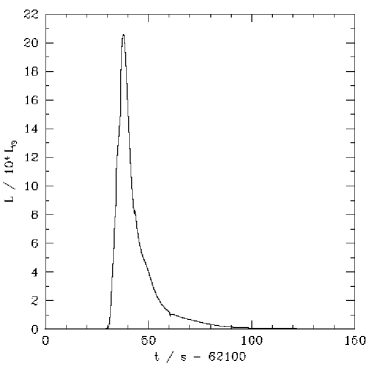
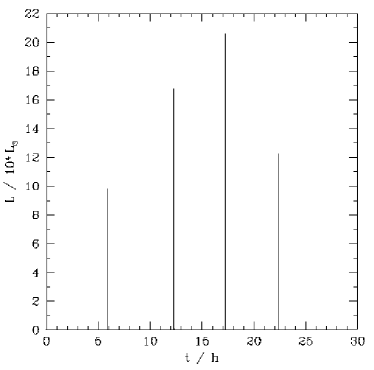
A summary of the gross properties of the four bursts computed in this model is given in Table 3. Peak temperatures and luminosities amount to K, and , respectively. Recurrence times between bursts of hr and ratios between persistent444We define /, with the latter term integrated over the time during which the burst exceeds 1% of its peak luminosity, . Notice that during the interburst period, the accretion luminosity, , will hide the thermal emission from the cooling ashes, as shown in Figs. 8 and 20. and burst luminosities of (except for the first burst) have been obtained. These values are in agreement with those inferred from some observed XRB sources (see Galloway et al. 2008) such as the textbook burster GS 1826-24 [ hr, ], 4U 1323-62 [ hr, ], or 4U 1608-52 [ hr, ]. As reported by Woosley et al. (2004), there is also some trend towards stabilization of these values with increasing burst number.
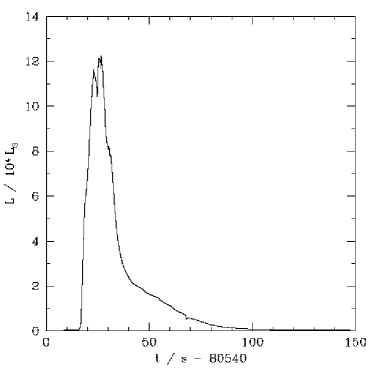
Fig. 20 depicts the corresponding light curves from the second to the fourth burst. A quite interesting feature, observed in some XRBs such as 4U 1608-52 (Penninx et al. 1989), 4U 17+2 (Kuulkers et al. 2002), or 4U 1709-267 (Jonker et al. 2004), is the appearance of a double-peaked burst in Fig. 20 (lower left panel). Double (or triple) peaked bursts can be classified in two categories (Watts & Maurer 2007): the first one corresponds to the so-called photospheric radius expansion bursts, which exhibit multi-peaked bursts in the X-ray band but not in the bolometric luminosity. The second type of multi-peaked events are also visible in the bolometric light curves, and have been attributed to different causes, such as a stepped release of thermonuclear energy caused either by mixing induced by hydrodynamic instabilities (Fujimoto et al. 1988) or driven by a nuclear waiting-point impedance in the thermonuclear reaction flow (Fisker et al. 2004). A preliminary analysis of the 4th burst reported for model 1 suggests a likely nuclear physics origin (waiting-point impedance) for this double-peaked feature (see José & Moreno 2010).
3 Model 2
In the previous Section, we have reported results from a sequence of type I X-ray bursts computed with a coarse resolution, in which the accreted envelope was discretized in 60 shells. We have checked the influence of the adopted number of envelope shells on the gross properties of the bursts by performing another simulation, identical to model 1, but computed with a finer resolution: 200 shells (hereafter, model 2).
A summary of the main properties of the two bursts computed for model 2 is given in Table 4: the recurrence times obtained are in the same range as those reported for model 1 (4 - 6 hr). The same applies to the ratios between persistent and burst luminosities, as well as to peak temperatures and luminosities. Similar light curves have also been obtained.
There is also good agreement from the nucleosynthesis viewpoint, with only minor differences in the final, mass-averaged abundances, as shown in Table 5 (particularly, for the heavier species of the network, since their low abundances are very sensitive to the specific thermal history of the explosion; see also Fig. 19). It is worth noting that both models reach almost identical nucleosynthesis endpoints (): 89Nb, for the first burst computed in both models, and 97Ru (model 1) and 99Rh (model 2), for the second burst. Furthermore, the amounts of unburned H, 4He, and 12C are very similar in both models. As expected from the abovementioned similarities, there is also good agreement in terms of overproduction factors, dominated by 64Zn and 60Ni (with ) in the first burst, and by 64Zn, 72Ge, 74,76Se, 78,80Kr, and 84Sr (), in the second, for both models.
All in all, we conclude that the resolution adopted in model 1 is appropriate for XRB simulations. This is in agreement with the studies performed by Fisker et al. (2004), who concluded that the minimum discretization of the envelope, in 1-D hydrodynamic simulations of X-ray bursts, is about 25 shells.
4 Model 3
To test the impact of the metallicity of the accreted material (which reflects the surface composition of the companion star) on the overall properties of the bursts, we have computed another series of bursts (hereafter, model 3), driven by accretion of metal-deficient material (Z /20) onto a 1.4 M⊙ neutron star (Lini = erg s-1 = 4.14 L⊙), at a rate acc = M⊙ yr-1. The composition of the accreted material is assumed to be X=0.759, Y=0.240, and Z=10-3, and as for model 1, all metals are initially added up in the form of 14N. This model is indeed qualitatively similar to model zM, from Woosley et al. (2004) (see also Fisker et al. 2008, and Schatz et al. 2001). Both the envelope zoning and the initial relaxation phase are identical to those described for model 1.
4.1 First burst
The piling up of matter on top of the neutron star during the accretion stage progressively compresses and heats the envelope.
At t=4337 s, the envelope achieves T K ( g cm-3). The nuclear activity is fully dominated by the CNO-cycle. In contrast to model 1, the smaller metallicity of this model limits substantially the role of proton captures. Indeed, at this stage, H has only been reduced to 0.757 at the envelope base. The main reaction fluxes are actually an order of magnitude lower than those reported from model 1, for the same temperature, powering an energy generation rate of erg g-1 s-1. Because of the lower metallicity of this model, the time required to achieve T K is about twice the value reported for model 1, resulting in a thicker, more massive envelope which will affect the forthcoming explosion. Besides H and He (0.242), by far the most abundant nuclei in the envelope, the nuclear activity in the CNO region increases the chemical abundances of many species in this mass range, with 15O () being the most abundant CNO-group nucleus at the envelope base.
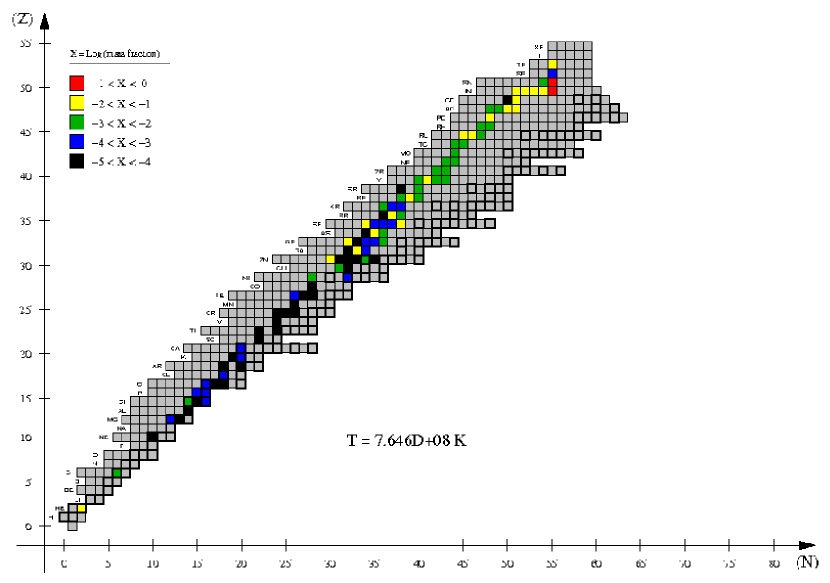
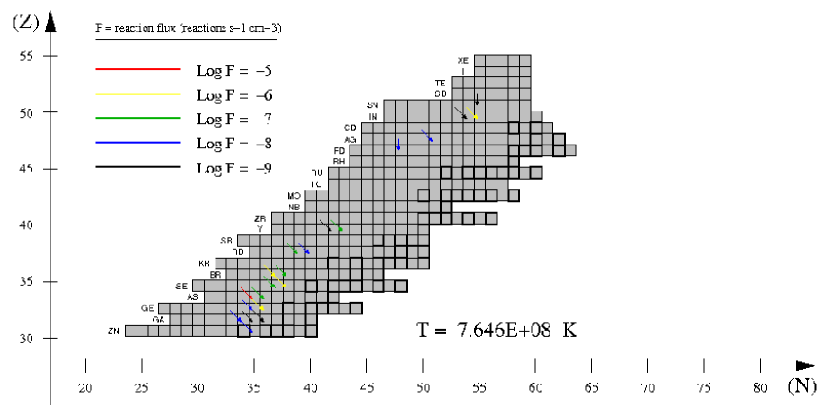
16.8 hours (60,347 s) after the beginning of accretion, Tbase has reached K (with = g cm-3, and P dyn cm-2). The total luminosity of the star is only erg s-1. The main nuclear activity is governed by 15N(p, )12C and other reactions of the CNO cycle. 7Be(p, )8B is at equilibrium with its reverse photodisintegration reaction 8B(, p)7Be. Because of the limited number of CNO-catalysts in this low-metallicity model, some proton-proton chain reactions, such as the pep, 3He(, )7Be, or 8Be 24He, are relatively frequent. In terms of chemical abundances, the now frequent p-captures have reduced the hydrogen content down to a value of 0.695 (while X(4He) = 0.303). The next most abundant isotopes in the network are the short-lived species 15O () and 14O (). The nuclear activity () reaches 40Ca at this stage.
18.1 hours (65,081 s) from the onset of accretion, Tbase reaches K. Hydrogen continues to decrease smoothly (X(H) = 0.689), whereas the 4He abundance reaches 0.280. The next most abundant nuclei are 14O (), and 15O, now followed by 52Fe and 18Ne, with mass fractions of the order of . The nuclear activity extends up to 58Cu. The largest reaction fluxes correspond to different processes that operate almost at equilibrium with their inverse photodisintegration reactions, such as 21Mg(p, )22Al(, p)21Mg, 30S(p, )31Cl(, p)30S, 25Si(p, )26P(, p)25Si, and 7Be(p, )8B(, p)7Be.
6 seconds later (t = 65,087 s), Tbase achieves K. has slightly decreased to g cm-3 because of a mild envelope expansion ( m). 4He has slightly decreased to 0.267, as a result of the frequent -captures driven by the high temperatures achieved. The next most abundant species are now 18Ne (), together with 14,15O ( and , respectively), 52Fe (), and 34Ar (). The nuclear activity reaches 61Ga, powering an energy generation rate of erg g-1 s-1. The overall stellar luminosity is now erg s-1.
A qualitatively similar picture is found when Tbase achieves K (at t = 65,090 s), with the nuclear activity extending all the way up to 68Se.
One second later (t = 65,091 s), Tbase achieves K. The nuclear activity (with erg g-1 s-1; see Fig. 22) continues to reduce the H and 4He abundances down to 0.680 and 0.224, respectively. The next most abundant species are now 28,29,30S, 33,34Ar, 25Si, 60Zn, and 38Ca (all with mass fractions ), with the main nuclear path reaching 72Kr. The largest absolute fluxes are achieved by nuclear interactions between equilibrium (p, )-(, p) pairs, which do not contribute to the net energy balance. Instead, the most important contributors to the energy production at this stage are 25Al(p, )26Si, 27,29,30P(p, )28,30,31S, 28Si(p, )29P, 32,33Cl(p, )33,34Ar, 32,33Cl(p, )33,34Ar, 35Ar(p, )36K, 35,36,37K(p, )36,37,38Ca, the chain 3 12C(p, )13N(p, )14O(, p)17F(p, )18Ne(, p)21Na(p, )22Mg, and a suite of -decays, such as 25Si()25Al, 28,29,30S()28,29,30P, and 33Ar()33Cl. The activity in the A=65-100 mass region is dominated by the suite of reactions depicted in Fig. 22, lower panel, mainly 65Ge(p, )66As, 67Se()67As(p, )68Se, 65As(p, )66Se()66As (with log F -7), and 65Se()65As (log F -8).
In contrast to model 1, which achieved a peak temperature of K, model 3 reaches relatively higher values. Hence, at t = 65,093 s, Tbase achieves K. The H and 4He abundances have been reduced to 0.648 and 0.205, respectively. The next most abundant nucleus is still 30S (), followed by 38Ca (), and by a large number of species with abundances of the order of , such as 36,37Ca, 28,29S, 32,33,34Ar, 58,59,60Zn, 62,63,64Ge, 48,49,50Fe, 53,54,55Ni, 41Ti, and 44,45,46Cr. At this stage, the main nuclear path reaches 76Sr.
One second later, at t = 65,094 s, the rate of nuclear energy generation achieves a maximum value of erg g-1 s-1.
At t = 65,095 s, while Tbase = K, the main nuclear path reaches 80Zr. Because of the large temperature achieved, the number of proton- and -captures increases, which in turn efficiently reduces the H (0.621) and 4He (0.197) abundances. The next most abundant nucleus is 60Zn (), followed by 64Ge, 38Ca, 30S, 55Ni, and 59Zn (with X, see Fig. 23). The nuclear activity in the A=65-100 mass region is now dominated by 65As(p, )66Se()66As(p, )67Se (log F -4), 65Ge(p, )66As, and 67Se()67As(p, )68Se (log F -5; see Fig. 23). Energy production is mainly due to suite of (p, ) reactions and -decays involving nuclear species in the mass range A=30-62.
Shortly after, at t = 65,098 s, a peak temperature of Tpeak = K is achieved at the envelope base. This is followed, less than a second later, by a maximum expansion of the envelope, 73.9 m, and by a maximum luminosity, Lmax = erg s-1 ( L⊙). The main nuclear path reaches 93Pd (already beyond the nucleosynthesis endpoint achieved in model 1). With respect to the chemical abundances, the envelope base is still dominated by H (0.560) and 4He (0.175), with 60Zn reaching a mass fraction of 0.111. The next most abundant species are 64Ge (), and 68Se (). Regarding the activity in the A65 mass region, at this stage is dominated by 66Se()66As(p, )67Se()67As(p, )68Se (log F -4), 65Ge(p, )66As, and 68Se()68As(p, )69Se(p, )70Br(p, )71Kr()71Br(p, )72Kr (log F -5; see Fig. 24, for additional processes down to log F -8). The most important contributors to the energy production are at this stage 44,45V(p, )45,46Cr, 49Mn(p, )50Fe()50Mn(p, )51Fe, 52Co(p, )53Ni, 53Co(p, )54Ni()54Co(p, )55Ni()55Co(p, )56Ni, and 58Zn()58Cu(p, )59Zn()59Cu(p, )60Zn (log F -3).
At t=65,110 s, following the decline from peak temperature, the envelope base achieves K (Fig. 25). At this stage, the main nuclear activity has already reached the SnSbTe-mass region (104Sn, in particular). The chemical abundances at the envelope base are still dominated by H (0.471), now followed by 64Ge (0.162), and 68Se (0.161), while 4He has dropped to 0.131. The next most abundant species shift to 60Zn (), and 72Kr (), with a suite of nuclei reaching (30S, 67Se, 37,38Ca, 76Sr, 62,63Ge, 59Zn, 55Ni, 34Ar, or 50Fe). The nuclear activity in the A65 mass region is now powered by 65As(p, )66Se()66As(p, )67Se()67As(p, )68Se()68As(p, )69Se(p, )70Br(p, )71Kr()71Br(p, )72Kr (log F -4), 65Ge(p, )66As, 69Br(p, )70Kr()70Br, 72Kr()72Br(p, )73Kr(p, )74Rb(p, )75Sr()75Rb(p, )76Sr, 78Y(p, )79Zr, and 86Tc(p, )87Ru (log F -5; see Fig. 25). Energy production is not due to a handful of nuclear processes but to dozens of different reactions (from 3 12C all the way to 71Br(p, )72Kr).
Twenty-two seconds later (t=65,132 s), the temperature at the envelope base has decreased to K (Fig. 26). The H content has been slightly reduced to 0.370, whereas 4He reaches . Indeed, after H, the most abundant species at the envelope base are now 68Se (0.270), and 64Ge (0.104), followed by 72Kr (), 76Sr (), and 80Zr (). At this stage, some of the heaviest species of the network have already achieved an abundance of (such as 88,89Ru, 92,93Pd, 96Cd, 99In, or 101,102Sn, together with the lighter nuclei 30S, 38Ca, 59,60Zn, and 67Se), with the nuclear activity extending all the way up to 107Te. The nuclear activity in the A=65-100 mass region is similar to that described above for K, and is depicted in Fig. 26, lower panel.
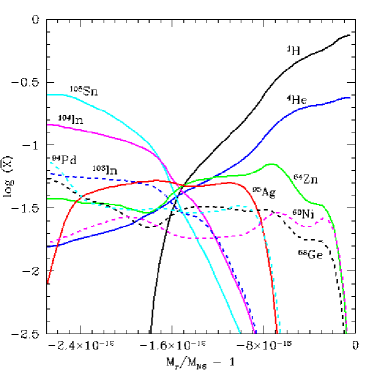
At t=65,264 s, the envelope base achieves K (Fig. 27). Now, the most abundant element at the envelope base is 105Sn (0.228). This is followed by a large number of species with abundances , such as 104Sn, 68Se, 72Kr, 104In, 94Pd, 64Ge, 103In, 76Sr –all more abundant than H () and 4He (), at this stage–, together with 102,103Sn, 95Ag, 107Te, 100,101,102In, 80Zr, 60Zn, and 98,99Cd. Notice that, since the heaviest element included in our network, 107Te, achieved already an abundance of , leakage from the SnSbTe-mass region cannot be discarded. Notice, however, that -emission for 107Te was not included, which may account for the high abundances reported here. Further studies to explore possible nucleosynthesis beyond the SnSbTe-mass region are underway with a larger network, so detailed abundances in this region should be taken with caution. The set of equilibrium (p, )-(, p) pairs is now accompanied by a handful of -decays (such as 80Zr()80Y, 76Sr()76Rb, 84Mo()84Nb, and 82Nb()82Zr) as the nuclear processes with largest absolute fluxes, since H depletion and the low temperature limit the extent of charged-particle reactions. Indeed, these weak interactions will become progressively more important during the last stages of the burst. At this stage, the activity in the A=65-100 mass region is dominated by 76Sr()76Rb(p, )77Sr(p, )78Y, 79Y(p, )80Zr()80Y(p, )81Zr(p, )82Nb()82Zr(p, )83Nb(p, )84Mo()84Nb(p, )85Mo, 89Ru(p, )90Rh (log F -4), and more than 60 different nuclear processes with log F -5 (see Fig. 27, lower panel), involving nuclei in the mass range A= 65-104. Indeed, energy production is driven by (p, ) and processes involving species in this mass range.
At t=65,362 s, the temperature at the envelope base has already declined to K (Fig. 28). H is now fully depleted (), while 4He barely reaches . As before, the most abundant element at the envelope base is 105Sn (0.251), followed by 104In (0.142), and by a large number of species with abundances . The depletion of H dramatically reduces the fluxes of most of the (p, ) reactions, which are now overcome by many -decays (such as those affecting 68,69Se, 68As, 64Ge, 71,72Br, 60Zn, 60Cu, 72,73Kr, 104Sn, 64Ga, 82Zr, or 76Sr), and by a suite of -capture reactions, such as 3C(, )16O(, )20Ne(, )24Mg(, )28Si(, )32S, or 13N(, p)16O.
At t=69,715 s, after a long decline, a minimum temperature is achieved at the envelope base, K (Fig. 29), which we consider to mark the end of the first bursting episode for this model. At this stage, H is fully depleted () at the envelope base, while 4He has a mass fraction of only. The distribution of the most abundant elements almost follows the one described for K (Fig. 28), and is dominated by 105Sn (0.251), followed by 104In (0.147), and by a large number of species with abundances , such as 94Pd, 100,101,102,103In, 68Ge, 64Zn, 72Se, 76Rb, 107Te, 60Ni, 99Cd, 97,98Ag, 89,90Ru, and 80Y. At this stage, the dominant interactions are all -decays (60,61Cu()60,61Ni, 66,67Ge()66,67Ga, 65Ga()65Zn, 51Mn()51Cr, 52Fe()52Mn, 63Zn()63Cu, 56Ni()56Co, or 43Sc()43Ca), except for the triple- reaction.
Depth also influences the extent of the nuclear activity throughout the envelope, but in contrast to Model 1, the nuclear activity in all shells of our computational domain essentially reach the SnSbTe-mass region. Indeed, the inner part of the envelope (encompassing g) is, at the end of the burst, dominated by large amounts of 105Sn and 104In, the most abundant nuclei with mass fractions 0.1 - 0.2; at g above the core-envelope interface, the most abundant isotopes are H (0.26) and 4He (0.12), while the most abundant species in the SnSbTe-mass region achieve a mass fraction ; and close to the surface ( g), shells are largely dominated by the presence of unburned H (0.75) and 4He (0.24), with X(SnSbTe) .
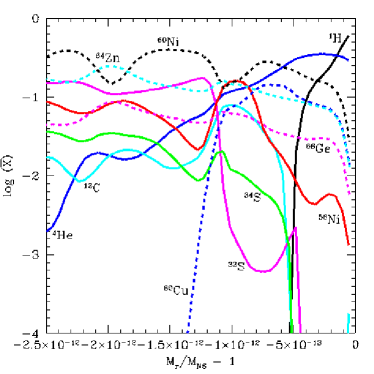
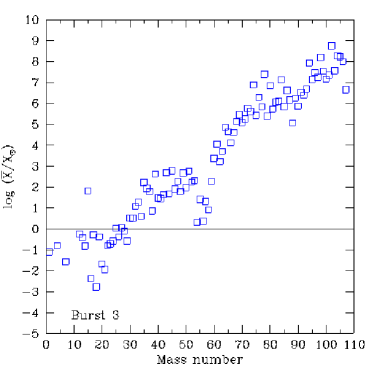
The mean, mass-averaged chemical composition of the whole envelope, at the end of the first bursting episode, is dominated by the presence of unburned H (0.18) and 4He (0.084), followed by 105Ag (0.075), 104Pd (0.053), 64Zn (0.042), 95Ru (0.031), 68Ge (0.028), 94Tc (0.026), and 103Ag (0.026), (see Table 8, for the mean composition of species -stable or with a half-life hr- which achieve X), with a nucleosynthesis endpoint around 107Cd. In contrast, the first burst computed in model 1 yielded, in general, lighter nuclei, 60Ni, 4He, 1H, 64Zn, 12C, and 52,56Fe, with a more modest nucleosynthesis endpoint around 89Nb (Table 2).
In terms of overproduction factors, (Fig. 30), while model 1 showed moderate values () for a handful of intermediate-mass elements, such as 43Ca, 45Sc, 49Ti, 51V, 60,61Ni, 63,65Cu, 64,67,68Zn, 69Ga, 74Se, or 78Kr, model 3 achieves moderate overproduction factors (), for all stable species heavier than 64Zn, and as high as for 98Ru, 102,104Pd, and 106Cd.
4.2 Second, third, fourth, and fifth bursts
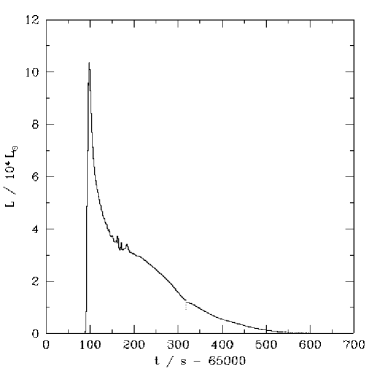
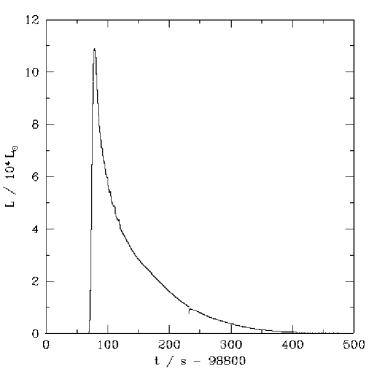
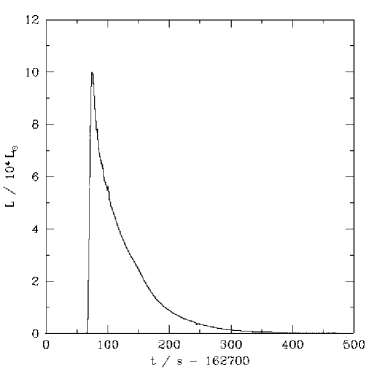
Table 7 summarizes the most relevant properties that characterize the five bursting episodes computed for model 3. Recurrence times between bursts of hr (except for the first one, for which hr), ratios between persistent and burst luminosities of , and peak luminosities around represent the basic observables associated with this model. Indeed, the recurrence times obtained are in agreement with the values reported for the XRB sources (see Galloway et al. 2008) 1A 1905+00 [ hr], 4U 1254-69 [ hr], or XTE J1710-281 [ hr, ], A striking result is the quick stabilization of the recurrence times, that show a regular periodicity after the second burst.
It is worth noting that both the recurrence periods and the ratios between persistent and burst luminosities are larger than those reported for model 1 (see Table 6, for comparison), showing a clear dependence on the metallicity of the accreted material: the smaller the metal content, the larger the recurrence time (and the smaller the value of ).
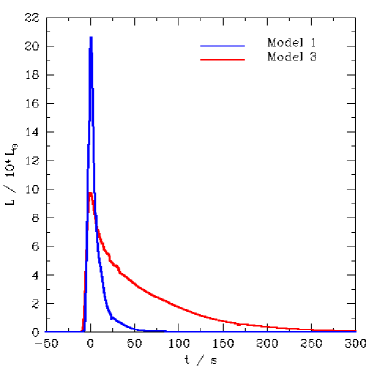
The corresponding light curves (see Fig. 31) exhibit, in turn, a clear pattern: as shown in Fig. 32 (left panel), where light curves of the third bursting episode computed in models 1 & 3 are compared, explosions in metal-deficient envelopes (such as model 3) are characterized by lower peak luminosities and longer decline times. A similar pattern has been reported by Heger et al. (2007), in the framework of 1-D, hydrodynamic models of XRBs performed with the KEPLER code. It is worth noting that no double-peaked bursts have been obtained in model 3.
Larger peak temperatures, around K, have also been obtained in model 3. This, together with the longer exposure times to high temperatures (driven by the slower decline phase) cause a dramatic extension of the main nuclear path towards the SnSbTe-mass region or beyond.
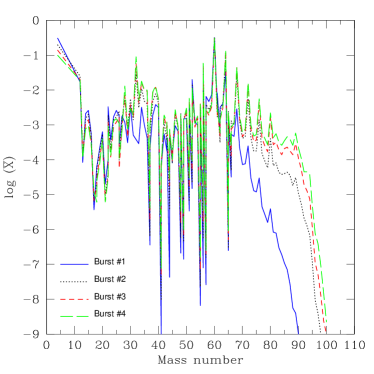
From the nucleosynthesis viewpoint, and as shown in Table 8 and Figs. 31 & 32, the nuclear activity already reaches the end of the network (107Te) at the late stages of the first bursting episode. The overall mean metallicity of the envelope at the end of each burst is now 0.74 (1st burst), 0.85 (2nd burst), 0.90 (3rd burst), 0.92 (4th burst), and 0.93 (5th burst). Notice that, although the accreted material is more metal-deficient in model 3 than in model 1, the post-burst mean metallicity of the envelope is larger in model 3. This results from the combination of higher temperatures and longer burst durations, which favors the extension of the nuclear activity: for short bursts (like those obtained in metal-rich envelopes), only the fastest p- and/or -capture reactions can naturally occur (those that proceed with a characteristic time shorter than the overall exposure time to high temperatures); in contrast, for long-duration bursts, the overall number of p- and/or -capture reactions increases dramatically. This, in particular, affects CNO-breakout through 15O(, )19Ne and 14O(, p)17F, which are favored in the longer bursts obtained for model 3. It is also worth noting that the abundance pattern obtained after the different bursts is very similar. This is clearly shown in Fig. 33, that depicts the main nuclear activity at peak and at the end of the fourth burst computed for Model 3, when compared with that corresponding to the first burst – Figs. 24 & 29. This fact justifies our emphasis on the reaction sequences that characterize the first burst (see discussion in Sect. 5.2).
A final 12C yield of is obtained at the end of each bursting episode (except in the first one, for which X(12C)=). As reported for model 1, the amount of unburned 12C left over turns out to be too small to power a superburst. Finally, huge overproduction factors (see Figs. 31 & 32), involving heavy species such as 102,104,105Pd, 98Ru, or 94Mo (with ) have been obtained in model 3, in contrast with the somewhat more modest values achieved in model 1, where maximum overproduction factors are about , and involving lighter species, such as 76Se, 78,80Kr, or 84Sr.
5 Discussion
5.1 General relativity corrections
The calculations reported here have been performed assuming Newtonian gravity. Since the envelope layers are very thin, it is easy to introduce general relativity corrections to this Newtonian framework (see Ayasli & Joss 1982, Lewin et al. 1993, Taam et al. 1993, Cumming et al. 2002, and Woosley et al. 2004). To this end, the surface gravity is rewritten as , where M∗ is the mass, R∗ is the stellar radius (defined in such a way that the surface area is 4), and is the gravitational redshift given by . Our models of M M⊙ require R km, and a gravitational redshift of .
Following Woosley et al. (2004), once the redshift and radius are determined, it is straightforward to derive the set of correcting factors to the physical magnitudes described above for a suitable observer at infinity. Hence, recurrence times and burst durations should be increased by a factor . The mass-accretion rate as well as the burst luminosity have to take into account both the difference in surface area (compared to the Newtonian framework) and the gravitational redshift term. The energy and rest mass-accretion rate scale as R/, while the luminosity R/. However, when M∗ is taken exactly as (Newtonian framework), the surface area and redshift corrections for energy and mass accretion rate cancel out, since g R, and hence, no correction to the observed burst energy or mass-accretion rate is necessary, while the luminosity correction is simply given by . In addition, the accretion luminosity for an observer at infinity changes only by a factor 1.012, that is, the ratio between gravitational energy released per unit mass in general relativity, , and the Newtonian value, . Finally, the luminosity measured at infinity will be smaller by a factor of .
5.2 Comparison with previous work
For consistency, the results discussed in this paper have been compared with those reported in previous work (obtained with similar hydrodynamic codes or in the framework of one-zone models).
As emphasized in Section 2, model 1 is qualitatively similar to model ZM of Woosley et al. (2004). The twelve bursts computed by Woosley et al. (2004) in a Newtonian frame were characterized by recurrence times of about hr, peak luminosities of L erg s-1, and ratios between persistent and burst luminosities of . Our calculations (model 1, Newtonian frame) yield hr, L erg s-1, and .
The role played by the metallicity of the accreted material (model 3, with Z = Z⊙/20 = 0.001) qualitatively agrees with the pattern reported by Woosley et al. (2004) (see also, Heger et al. 2007). Longer recurrence times of hours, peak temperatures of about K, and ratios between persistent and burst luminosities of (with Lpeak erg s-1) have been obtained in the 5 bursts computed in model 3. In turn, the fifteen bursts computed by Woosley et al. (2004) for model zM are characterized by recurrence times of about hr, peak luminosities of L erg s-1, and ratios between persistent and burst luminosities of . Results reveal a dependence of burst properties on the metallicity of the accreted material: the smaller the metal content, the larger the recurrence time (and the smaller the ). In turn, explosions in metal-deficient envelopes (i.e., model 3) are characterized by lower peak luminosities and longer decline times, in agreement with the pattern described in Woosley et al. (2004) and Heger et al. (2007). Model 3 bears as well a clear resemblance with the model computed by Fisker et al. (2008). In that work, five representative bursting sequences were analyzed, with hr, L erg s-1, and , as measured at infinity.
Despite the qualitative similaries in the gross properties of the bursts presented in this paper (as well as in the role played by the metallicity of the accreted material) and those reported in previous work, a quantitative comparison reveals some discrepancies that are worth analyzing. In model 1 (with Z = Z⊙), our computations yield systematically larger (by a factor of 2) recurrence times and peak luminosities (and hence, lower ) than model ZM of Woosley et al. (2004). Similar results are found in the low-metallicity case (model 3, with Z = Z⊙/20) when compared with model zM of Woosley et al. (2004), except for the peak luminosities that turn out to be very similar. It is also worth noting that the values reported by Fisker et al. (2008) show discrepancies with respect to Woosley et al. (2004), in particular, lower peak luminosities (and larger ). A major difference concerns the much larger effect played by the metallicity of the accreted material in this work as compared with Woosley et al. (2004), who explained the moderate effect found as due to compositional inertia washing out the influence of the initial metallicity. Another striking issue concerns the extremely large differences in the gross physical characteristics -nucleosynthesis, energies or recurrence times- between the first and subsequent bursts, as reported by Woosley et al. (2004). In terms of nucleoynthesis or nuclear activity, Figs. 30, 31, & 32, reveal a similar behavior for the different bursts (although a somewhat lower production of intermediate-mass elements as well as of the heaviest elements is reported for the first burst computed in model 3).
Very limited information on the nucleosynthetic yields obtained in model ZM is given in Woosley et al. (2004). Thus, we will restrict the discussion on the extent of the nuclear activity and on the resulting chemical abundance pattern to model 3, through a brief comparison with the work reported by Schatz et al. (2001), Fisker et al. (2008) and Woosley et al. (2004) (for model zM). It is worth noting that both the nucleosynthetic end-point (located in the SnSbTe-mass region) and the main nuclear path in the A mass region obtained in this work (passing through a suite of different nuclei such, as 55Co, 60Zn, 70Br, 75Rb, 85Mo, 90Rh, or 100,105Sn) are similar to those reported by Schatz et al. (2001) in the framework of one-zone calculations. Whereas the main nuclear path in the first burst of model zM (Woosley et al. 2004) is very similar to the one reported in this work, compositional inertia causes a more limited extension of the nuclear activity in the successive bursts of Woosley et al.: hence, while the three most abundant nuclei at the bottom of the envelope are 106Sn and 104,106In at the end of the first burst, this switches to 64Zn, 68Se, and 32S (a similar trend is also reported by Fisker et al. 2008). In this work, the mass-averaged composition at the end of the first burst computed for model 3 (see Table 8) is dominated (aside from some residual H and 4He) by the presence of 104Pd (0.05, by mass) and 105Ag (0.08), while X(64Zn) 0.04. But the peak at the end of the abundance distribution (see Fig. 30) increases with subsequent bursts up to a plateau value, which indicates that these heavy nuclei are still produced in similar quantities. This is very different to the results reported by Woosley et al. (2004). Indeed, at the end of the fifth burst, the abundance pattern, shows still a significant presence of heavy species (i.e., X(105Ag) 0.1, X(104Pd) 0.08, and X(94Tc) 0.05), together with a simultaneous increase in the abundances of intermediate-mass elements, such as 60Ni (0.06), 64Zn (0.09), 68Ge (0.07), or 72Se (0.04). It is finally worth noting that, in agreement with all previous hydrodynamic studies, both models 1 and 3 yield very small post-burst abundances of 12C, below the threshold amount required to power superbursts. Even though only a few bursts have been computed for these models, they already show a trend on the amount of 12C that may be expected after many more bursts.
Finally, it is also worth mentioning that large differences exist between the hydrodynamic simulations reported here (see also Woosley et al. 2004, and Fisker et al. 2008) and those based on one-zone models (i.e., Schatz et al. 1999, 2001) as regards the shape of the light curve accompanying the bursting episodes (the primary difference being the presence of a long-lasting plateau in the latter).
The origin of the discrepancies reported is not totally clear and would require additional hydrodynamic studies. Notice, however, that the local surface gravity of our model is somewhat smaller than that adopted in the abovementioned works: whereas a 10 km radius is assigned to the 1.4 M⊙ neutron star in Woosley et al. (2004) ( cm s-2), the integration of the neutron star structure from the core to its surface, in hydrostatic equilibrium, yielded 13.1 km (14.3 km, after general relativity corrections are introduced; see Subsection 5.1), for our 1.4 M⊙ neutron star (corresponding to a surface gravity of cm s-2); in turn, the calculations reported by Fisker et al. (2008), in a general relativity framework, relied on a 11 km (1.4 M⊙) neutron star, for which cm s-2. Although XRB properties depend weakly upon the neutron star mass (or surface gravity), part of the differences outlined between the three studies can be attributed to the combined effect of the adopted neutron star size (surface gravity) and to differences in the input physics (i.e., nuclear reaction network, opacities, treatment of convection). In particular, the use of Iben’s opacities may have some effect on the peak luminosities achieved since the larger OPAL opacities will likely decrease the amount of energy radiated away from the star. Moreover, the inclusion of semiconvection and thermohaline mixing would have a minor effect in the properties of the explosions, likely affecting the appearance of marginal convective transport between bursts (see Woosley et al. 2004, Fisker et al. 2008). It is however worth noting that the convective pattern shown in Figs. 18 & 32 is similar to those reported in previous work: namely that convection sets in as soon as superadiabatic gradients are established in the envelope, following the early stages of the TNR and the corresponding rise in temperature; it reaches the surface and begins to recede before the observed burst properly commences, shutting off thereafter (Woosley et al. 2004, Fisker et al. 2008).
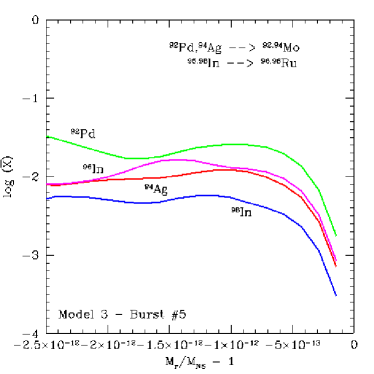
The potential impact of XRB nucleosynthesis on Galactic abundances is still a matter of debate. Matter accreted onto a neutron star of mass and radius releases MeV nucleon-1, whereas only a few MeV nucleon-1 are released from thermonuclear fusion. Thus ejection from a neutron star is unlikely. However, it has been suggested that radiation-driven winds during photospheric radius expansion may lead to ejection of a tiny fraction of the envelope (containing nuclear processed material; see Weinberg et al. 2006; MacAlpine et al. 2007). Indeed, XRBs have been proposed as a possible source of the light p-nuclei 92,94Mo and 96,98Ru (Schatz et al. 1998, 2001). No matter is ejected in any of the models reported in this work, a result fully independent of the adopted resolution and in agreement with all previous hydrodynamic simulations (Woosley et al. 2004, Fisker et al. 2008). Moreover, it is worth noting that, as shown in Figs. 17 & 30, the abundances of many species synthesized during the bursts decrease remarkably towards the outer envelope layers, because of inefficient convective transport (see Figs. 18 & 32). To assess the possible contribution to the Galactic abundances, one has to rely on the abundances of the outer envelope layers (the only ones that have a chance to be ejected by radiation-driven winds). This shows the limitations posed by one-zone nucleosynthesis calculations, in which the chemical species synthesized in the innermost layers are, by construction, assumed to represent the whole (chemically homogeneous) envelope. The mass fractions of these p-nuclei, obtained in model 3, drop by more than an order of magnitude in the outer envelope layers (as compared with the values achieved at the innermost envelope; see Fig. 34); the resulting overproduction factors, , are several orders of magnitude smaller than those required to account for the origin of these problematic nuclei (see Weinberg et al. 2006, Bazin et al. 2008), in sharp contrast with the results obtained on the basis of one-zone calculations (Schatz et al. 1998, 2001).
References
- (1) Angulo, C., et al., Nucl. Phys. A, 656, 3 (1999)
- (2) Arnould, M., & Goriely, S., Nucl. Phys. A, 777, 157 (2006)
- (3) Audi, G., Bersillon, O., Blachot, J., & Wapstra, A. H., Nucl. Phys. A, 729, 3 (2003a)
- (4) Audi, G., Wapstra, A. H., & Thibault, C., Nucl. Phys. A, 729, 337 (2003b)
- (5) Ayasli, S., and Joss, P.C., ApJ 256, 637 (1982)
- (6) Bazin, D., et al., Phys. Rev. Lett., 101, 252501 (2008)
- (7) Belian, R. D., Conner, J. P., & Evans, W. D., ApJ, 206, L135 (1976)
- (8) Bildsten, L., in The Many Faces of Neutron Stars, ed. R. Buccheri, J. van Paradijs, & M. A. Alpar (Dordrecht: Kluwer), 419 (1998)
- (9) Blinnikov, S.I., Dunina-Barkovskaya, N.V., and Nadyozhin, D.K., ApJS 106, 171 (1996)
- (10) Brown, E.F., ApJ 614, L57 (2004)
- (11) Cooper, R. L., Mukhopadhyay, B., Steeghs, D., and Narayan, R., ApJ 642, 443 (2006)
- (12) Cooper, R. L., and Narayan, R., American Astronomical Society 36, 941 (2004)
- (13) Cooper, R. L., and Narayan, R., ApJ 629, 422 (2005)
- (14) Cumming, A., Nuclear Physics A 758, 439c (2005)
- (15) Cumming, A., and Bildsten, L., ApJ 559, L127 (2001)
- (16) Cumming, A., Morsink, S., Bildsten, L., Friedman, J.L., and Holz, D.E. ApJ 564, 343 (2002)
- (17) DeWitt, H.E., Graboske, H.C., and Cooper, M.S., ApJ 181, 439 (1973)
- (18) Elomaa, V.-V., et al., Phys. Rev. Lett., 102, 252501 (2009)
- (19) Fisker, J.L., Thielemann, F.-K., and Wiescher, M.C., ApJ 608, L61 (2004)
- (20) Fisker, J.L., Görres, J., Wiescher, M.C., and Davids, B., ApJ 650, 332 (2006)
- (21) Fisker, J.L., Tan, W.P., Görres, J., Wiescher, M.C., and Cooper, R.L. ApJ 665, 637 (2007)
- (22) Fisker, J.L., Schatz, H., and Thielemann, F.-K., ApJS 174, 261 (2008)
- (23) Fujimoto, M. Y., Sztajno, M., Lewin, W. H. G., and van Paradijs, J., A&A 199, L9 (1988)
- (24) Fuller, G.M., Fowler, W.A., and Newman, M.J., ApJ 25 2, 715 (1982a)
- (25) Fuller, G.M., Fowler, W.A., and Newman, M.J., ApJS 4 8, 279 (1982b)
- (26) Galloway, D.K., Muno, M.P., Hartman, J.M., Savov, P., Psaltis, D., and Chakrabarty, D., ApJS 179, 360 (2008)
- (27) Goriely, S., in Nuclei in the Cosmos V, N. Prantzos, S. Harissopulos (eds.), Paris: Ed. Frontieres, p. 314 (1998)
- (28) Graboske, H.C., DeWitt, H.E., Grossman, A.S., and Cooper, M.S., ApJ 181, 457 (1973)
- (29) Grindlay, J., Gursky, H., Schnopper, H., Parsignault, D. R., Heise, J., Brinkman, A. C., and Schrijver, J., ApJ 205, L127 (1976)
- (30) Hanawa, T., Sugimoto, D., and Hashimoto, M.-A., PASJ 35, 491 (1983)
- (31) Heger, A., Cumming, A., Galloway, D.K., and Woosley, S.E., ApJ 671, L141 (2007)
- (32) Iben, I., ApJ 196, 525 (1975)
- (33) Iliadis, C., D’Auria, J.M., Starrfield, S., Thompson, W.J., & Wiescher, M.N., ApJS 134, 151 (2001)
- (34) Jonker, P. G., Galloway, D. K., McClintock, J. E., Buxton, M., Garcia, M., and Murray, S., MNRAS 354, 666 (2004)
- (35) José, J., and Hernanz, M., ApJ 494, 680 (1998)
- (36) José, J., and Moreno, F., Proc. Science, PoS(NIC-IX) 123 (2006)
- (37) José, J., and Moreno, F., ApJ, in preparation
- (38) Joss, P.C., Nat 270, 310 (1977)
- (39) Koike, O., Hashimoto, M., Arai, K., and Wanajo, S., A&A 342, 464 (1999)
- (40) Koike, O., Hashimoto, M., Kuromizu, R., Fujimoto, S., ApJ 603, 242 (2004)
- (41) Kuulkers, E., in’t Zand, J. J. M., van Kerkwijk, M. H., Cornelisse, R., Smith, D. A., Heise, J., Bazzano, A., Cocchi, M., Natalucci, L., and Ubertini, P., A&A 382, 503 (2002)
- (42) Kutter, G. S., and Sparks, W. M., ApJ 239, 988 (1980)
- (43) Langanke, K., and Martinez-Pinedo, G., Nucl. Phys. A 6 73, 481 (2000)
- (44) Lattimer, J., private com. (2009)
- (45) Lewin, W.H.G., van Paradijs, J., and R.E. Taam, Space Sci. Rev. 62, 233 (1993)
- (46) Lewin, W.H.G., van Paradijs, J., and R.E. Taam, in X-Ray Binaries, W.H.G. Lewin, J. van Paradijs, and E.P.J. van den Heuvel (eds.), Cambridge: Cambridge Univ. Press, p. 175 (1995)
- (47) Liebendörfer, M., Rosswog, S., and Thielemann, F.-K., ApJS 141, 229 (2002)
- (48) MacAlpine, G.M., Ecklund, T.C., Lester, W.R., and Vanderveer, S.J., AJ 133, 81 (2007)
- (49) Maraschi, L., and Cavaliere, A., in Highlights in Astronomy, E. Muller (ed.), Reidel:Dordrecht, vol. 4, Part I, p. 127 (1977)
- (50) Parikh, A., José, J., F. Moreno, and Iliadis, C., ApJS 178, 110 (2008)
- (51) Penninx, W., Damen, E., van Paradijs, J., Tan, J., and Lewin, W. H. G., A&A 208, 146 (1989)
- (52) Prialnik, D., Shara, M.M., and Shaviv, G., A&A 72, 192 (1979)
- (53) Psaltis, D., in Compact Stellar X-ray Sources, W. H. G. Lewin, and M. van der Klis (eds.), Cambridge: Cambridge Univ. Press, p. 1 (2006)
- (54) Rauscher, T., and Thielemann, F.-K., At. Data Nucl. Data Tab. 75, 1 (2000)
- (55) Schatz, H., Bildsten, L., Cumming, A., and Wiescher, M., ApJ 524, 1014 (1999)
- (56) Schatz, H., et al., Phys. Rev. Lett. 86, 3471 (2001)
- (57) Schatz, H., et al., Phys. Rep. 294, 167 (1998)
- (58) Schatz, H., and Rehm, K.E., Nucl. Phys. A 777, 601 (2006)
- (59) Shapiro, S.L., and Teukolsky, S.A, Black holes, white dwarfs, and neutron stars: the physics of compact objects, New York, NY: Wiley, (1983)
- (60) Strohmayer, T., & Bildsten, L., in Compact Stellar X-Ray Sources, W. H. G. Lewin, and M. van der Klis (eds.), Cambridge: Cambridge Univ. Press, p. 113 (2006)
- (61) Strohmayer, T., and Brown, E. F., ApJ 566, 1045 (2002)
- (62) Taam, R.E., ApJ 241, 358 (1980)
- (63) Taam, R.E., Woosley, S.E., Weaver, T.A., and Lamb, D.Q., ApJ 413, 324 (1993)
- (64) Taam, R.E., Woosley, S.E., and Lamb, D.Q., ApJ 459, 271 (1996)
- (65) Tan, W.P., Fisker, J.L., Görres, J., Couder, M., and Wiescher, M.C., PRL 98, 242503 (2007)
- (66) Wallace, R.K., and Woosley, S.E., ApJS 45, 389 (1981)
- (67) Wallace, R.K., and Woosley, S.E., in High Energy Transients in Astrophysics, S.E. Woosley (ed.), New York: AIP, p. 319 (1984)
- (68) Watts, A. L., and Maurer, I., A&A 467, L33 (2007)
- (69) Weinberg, N., Bildsten, L., and Schatz, H., ApJ 639, 1018 (2006)
- (70) Woosley, S.E., and Taam, R.E., Nat 263, 101 (1976)
- (71) Woosley, S.E., et al., ApJS 151, 75 (2004)
- (72) Woosley, S.E., and Weaver, T.A., in High Energy Transients in Astrophysics, S.E. Woosley (ed.), New York: AIP, p. 273 (1984)
| Model | MNS (M⊙) | Metallicity | Envelope shells | Bursts computed |
|---|---|---|---|---|
| 1 | 1.4 | 0.02 | 60 | 4 |
| 2 | 1.4 | 0.02 | 200 | 2 |
| 3 | 1.4 | 60 | 5 |
| Nucleus | Burst 1 | Burst 2 | Burst 3 | Burst 4 |
|---|---|---|---|---|
| 1H | ||||
| 4He | ||||
| 12C | ||||
| 13C | ||||
| 14N | ||||
| 15N | ||||
| 16O | ||||
| 17O | ||||
| 18O | ||||
| 18F | ||||
| 19F | ||||
| 20Ne | ||||
| 21Ne | ||||
| 22Ne | ||||
| 22Na | ||||
| 23Na | ||||
| 24Mg | ||||
| 25Mg | ||||
| 26Mg | ||||
| 26Alg | ||||
| 27Al | ||||
| 28Si | ||||
| 29Si | ||||
| 30Si | ||||
| 31P | ||||
| 32S | ||||
| 33S | ||||
| 34S | ||||
| 35Cl | ||||
| 36Ar | ||||
| 37Cl | ||||
| 37Ar | ||||
| 38Ar | ||||
| 39K | ||||
| 40Ca | ||||
| 41K | - | |||
| 41Ca | ||||
| 42Ca | ||||
| 43Ca | ||||
| 43Sc | ||||
| 44Ca | ||||
| 44Sc | ||||
| 44Ti | ||||
| 45Sc | ||||
| 45Ti | ||||
| 46Ti | ||||
| 47Ti | ||||
| 48Ti | ||||
| 48V | ||||
| 48Cr | ||||
| 49Ti | ||||
| 49V | ||||
| 50Cr | ||||
| 51V | ||||
| 51Cr | ||||
| 52Cr | ||||
| 52Mn | ||||
| 52Fe | ||||
| 53Mn | ||||
| 54Fe | ||||
| 55Mn | ||||
| 55Fe | ||||
| 55Co | ||||
| 56Fe | ||||
| 56Co | ||||
| 56Ni | ||||
| 57Fe | ||||
| 57Co | ||||
| 57Ni | ||||
| 58Ni | ||||
| 59Ni | ||||
| 60Ni | ||||
| 61Ni | ||||
| 61Cu | ||||
| 62Ni | ||||
| 62Zn | ||||
| 63Cu | ||||
| 64Zn | ||||
| 65Cu | ||||
| 65Zn | ||||
| 66Zn | ||||
| 66Ga | ||||
| 66Ge | ||||
| 67Ga | ||||
| 68Ge | ||||
| 69Ge | ||||
| 70Ge | ||||
| 71As | ||||
| 72Se | ||||
| 73Se | ||||
| 74Se | ||||
| 75Br | ||||
| 76Kr | ||||
| 77Kr | ||||
| 78Kr | ||||
| 79Kr | ||||
| 80Sr | ||||
| 81Rb | ||||
| 82Sr | ||||
| 83Sr | ||||
| 84Sr | ||||
| 85Y | ||||
| 86Zr | ||||
| 87Zr | ||||
| 88Zr | ||||
| 89Nb | ||||
| 90Mo | - | |||
| 91Nb | - | |||
| 92Mo | - | |||
| 93Tc | - | |||
| 94Tc | - | |||
| 95Ru | - | |||
| 96Ru | - | |||
| 97Ru | - | |||
| 98Ru | - | - | ||
| 99Rh | - | - | ||
| 100Pd | - | - | - |
| Burst | Tpeak (K) | t(Tpeak) (s) | (hr) | Lpeak (L⊙) | (s) | |
|---|---|---|---|---|---|---|
| 1 | 21192 | 5.9 | 75.8 | 60 | ||
| 2 | 44342 | 6.4 | 62.3 | 40 | ||
| 3 | 62137 | 4.9 | 55.4 | 34 | ||
| 4 | 80568 | 5.1 | 75.7 | 36 |
| Burst | Tpeak (K) | t(Tpeak) (s) | (hr) | Lpeak (L⊙) | (s) | |
|---|---|---|---|---|---|---|
| 1 | 21189 | 5.9 | 59.2 | 62 | ||
| 2 | 37783 | 4.6 | 73.9 | 31 |
| Nucleus | Burst 1 | Burst 2 |
|---|---|---|
| 1H | ||
| 4He | ||
| 12C | ||
| 13C | ||
| 14N | ||
| 15N | ||
| 16O | ||
| 17O | ||
| 18O | ||
| 18F | ||
| 19F | ||
| 20Ne | ||
| 21Ne | ||
| 22Ne | ||
| 22Na | ||
| 23Na | ||
| 24Mg | ||
| 25Mg | ||
| 26Mg | ||
| 26Alg | ||
| 27Al | ||
| 28Si | ||
| 29Si | ||
| 30Si | ||
| 31P | ||
| 32S | ||
| 33S | ||
| 34S | ||
| 35Cl | ||
| 36Ar | ||
| 37Cl | ||
| 37Ar | ||
| 38Ar | ||
| 39K | ||
| 40Ca | ||
| 41K | - | |
| 41Ca | ||
| 42Ca | ||
| 43Ca | ||
| 43Sc | ||
| 44Ca | ||
| 44Sc | ||
| 44Ti | ||
| 45Sc | ||
| 45Ti | ||
| 46Ti | ||
| 47Ti | ||
| 48Ti | ||
| 48V | ||
| 48Cr | ||
| 49Ti | ||
| 49V | ||
| 50Cr | ||
| 51V | ||
| 51Cr | ||
| 52Cr | ||
| 52Mn | ||
| 52Fe | ||
| 53Mn | ||
| 54Fe | ||
| 55Mn | - | |
| 55Fe | ||
| 55Co | ||
| 56Fe | ||
| 56Co | ||
| 56Ni | ||
| 57Fe | ||
| 57Co | ||
| 57Ni | ||
| 58Ni | ||
| 59Ni | ||
| 60Ni | ||
| 61Ni | ||
| 61Cu | ||
| 62Ni | ||
| 62Zn | ||
| 63Cu | ||
| 64Zn | ||
| 65Cu | ||
| 65Zn | ||
| 66Zn | ||
| 66Ga | ||
| 66Ge | ||
| 67Ga | ||
| 68Ge | ||
| 69Ge | ||
| 70Ge | ||
| 71As | ||
| 72Se | ||
| 73Se | ||
| 74Se | ||
| 75Br | ||
| 76Kr | ||
| 77Kr | ||
| 78Kr | ||
| 79Kr | ||
| 80Sr | ||
| 81Rb | ||
| 82Sr | ||
| 83Sr | ||
| 84Sr | ||
| 85Y | ||
| 86Zr | ||
| 87Zr | ||
| 88Zr | ||
| 89Nb | ||
| 90Mo | - | |
| 91Nb | - | |
| 92Mo | - | |
| 93Tc | - | |
| 94Tc | - | |
| 95Ru | - | |
| 96Ru | - | |
| 97Ru | - | |
| 98Ru | - | |
| 99Rh | - |
| Model 1 | Model 3 | |
|---|---|---|
| (g.cm-3) | ||
| Pmax,base (dyn.cm-2) | ||
| (g.cm-3) | ||
| Pmax,ign (dyn.cm-2) | ||
| (hr) | 5.1 | 8.8 |
| (M⊙) | ||
| Tpeak (K) | ||
| Lpeak (L⊙) | ||
| (m) | 40 | 44 |
| 36 | 30 |
| Burst | Tpeak (K) | t(Tpeak) (s) | (hr) | Lpeak (L⊙) | (s) | |
|---|---|---|---|---|---|---|
| 1 | 65110 | 18.1 | 423 | 34 | ||
| 2 | 98879 | 9.4 | 296 | 24 | ||
| 3 | 130816 | 8.9 | 281 | 24 | ||
| 4 | 162777 | 8.9 | 252 | 27 | ||
| 5 | 194266 | 8.8 | 250 | 30 |
| Nucleus | Burst 1 | Burst 2 | Burst 3 | Burst 4 | Burst 5 |
|---|---|---|---|---|---|
| 1H | |||||
| 4He | |||||
| 12C | |||||
| 13C | |||||
| 14N | |||||
| 15N | |||||
| 16O | |||||
| 17O | |||||
| 18O | - | ||||
| 18F | |||||
| 19F | |||||
| 20Ne | |||||
| 21Ne | |||||
| 22Ne | |||||
| 22Na | |||||
| 23Na | |||||
| 24Mg | |||||
| 25Mg | |||||
| 26Mg | |||||
| 26Alg | |||||
| 27Al | |||||
| 28Si | |||||
| 29Si | |||||
| 30Si | |||||
| 31P | |||||
| 32S | |||||
| 33S | |||||
| 34S | |||||
| 35Cl | |||||
| 36Ar | |||||
| 37Cl | |||||
| 37Ar | |||||
| 38Ar | |||||
| 39K | |||||
| 40Ca | |||||
| 41K | - | - | - | - | |
| 41Ca | |||||
| 42Ca | |||||
| 43Ca | |||||
| 43Sc | |||||
| 44Ca | - | ||||
| 44Sc | |||||
| 44Ti | |||||
| 45Sc | |||||
| 45Ti | |||||
| 46Ti | |||||
| 47Ti | |||||
| 48Ti | |||||
| 48V | |||||
| 48Cr | |||||
| 49Ti | |||||
| 49V | |||||
| 50Cr | |||||
| 51V | |||||
| 51Cr | |||||
| 52Cr | |||||
| 52Mn | |||||
| 52Fe | |||||
| 53Mn | |||||
| 54Fe | |||||
| 55Mn | - | - | |||
| 55Fe | |||||
| 55Co | |||||
| 56Fe | |||||
| 56Co | |||||
| 56Ni | |||||
| 57Fe | - | ||||
| 57Co | |||||
| 57Ni | |||||
| 58Ni | |||||
| 59Ni | |||||
| 60Ni | |||||
| 61Ni | |||||
| 61Cu | |||||
| 62Ni | |||||
| 62Zn | |||||
| 63Cu | |||||
| 64Zn | |||||
| 65Cu | |||||
| 65Zn | |||||
| 66Zn | |||||
| 66Ga | |||||
| 66Ge | |||||
| 67Ga | |||||
| 68Ge | |||||
| 69Ge | |||||
| 70Ge | |||||
| 71As | |||||
| 72Se | |||||
| 73Se | |||||
| 74Se | |||||
| 75Br | |||||
| 76Kr | |||||
| 77Kr | |||||
| 78Kr | |||||
| 79Kr | |||||
| 80Sr | |||||
| 81Rb | |||||
| 82Sr | |||||
| 83Sr | |||||
| 84Sr | |||||
| 85Y | |||||
| 86Zr | |||||
| 87Zr | |||||
| 88Zr | |||||
| 89Nb | |||||
| 90Mo | |||||
| 91Nb | |||||
| 92Mo | |||||
| 93Tc | |||||
| 94Tc | |||||
| 95Ru | |||||
| 96Ru | |||||
| 97Ru | |||||
| 98Ru | |||||
| 99Rh | |||||
| 100Pd | |||||
| 101Pd | |||||
| 102Pd | |||||
| 103Ag | |||||
| 104Pd | |||||
| 105Ag | |||||
| 106Cd | |||||
| 107Cd |