ASTROMETRIC JITTER OF THE SUN AS A STAR
Abstract
The daily variation of the solar photocenter over some 11 years is derived from the Mount Wilson data reprocessed by Ulrich et al. 2010 to closely match the surface distribution of solar irradiance. The standard deviations of astrometric jitter are 0.52 AU and 0.39 AU in the equatorial and the axial dimensions, respectively. The overall dispersion is strongly correlated with the solar cycle, reaching AU at the maximum activity in 2000. The largest short-term deviations from the running average (up to 2.6 AU) occur when a group of large spots happen to lie on one side with respect to the center of the disk. The amplitude spectrum of the photocenter variations never exceeds AU for the range of periods – yr, corresponding to the orbital periods of planets in the habitable zone. Astrometric detection of Earth-like planets around stars as quiet as the Sun is not affected by star spot noise, but the prospects for more active stars may be limited to giant planets.
1 Introduction
The prospects of finding habitable planets orbiting nearby solar-type stars are to a large degree associated with the ultra-precise astrometric instruments under development or construction, such as the SIM Observatory (Shao et al., 2009; Unwin et al., 2008; Catanzarite et al., 2006) and Gaia (Casertano et al., 2008). The Earth orbiting the Sun produces an observable astrometric wobble of 3 AU (micro-AU) and a radial velocity variation of 0.089 m s-1, if seen equator-on (inclination ). A pole-on configuration ( or ) is optimal for astrometry, because the reflex motion signal is present in both dimensions of the sky projection, whereas the radial velocity amplitude, which is proportional to , drops to zero. For a high signal-to-noise (S/N) ratio detection, the total error budget of the prospective exoplanet detection techniques should be well below these values. The astrophysical jitter caused by the rotation of magnetic features on the surface (spots, faculae) potentially becomes a significant part of the total observational error in this domain of accuracy, even for fairly common inactive dwarfs. The recently completed double blind test of planet-detection capabilities with the SIM Observatory produced encouraging results even for complex multiple systems (Traub et al., 2009), but magnetic jitter was not taken into account in those simulations. Semi-analytical considerations in (Makarov et al., 2009) supported by Monte-Carlo simulations and indirect observational evidence determined that the astrometric method is much less sensitive to the effects of magnetic features, at least by an order of magnitude for solar-type stars, than the Doppler shift technique. Similar conclusions were drawn by Catanzarite et al. (2008) for the Sun, based on a sophisticated model of sunspot activity and extensive numerical simulation.
The variable distribution of surface brightness is the cause of both the astrometric jitter and the total flux variation. Therefore, the former can be estimated from the latter, given a model describing the number of spots (or bright features), their size and lifetimes. The dispersion of the total solar irradiance (TSI) observed for a few decades with a number of satellites (Fröhlich & Lean, 1998) sets the standard of quiet stars (, or 400 ppm in normalized flux). The light curves from Kepler for some 120000 stars revealed that at least half of all solar-type dwarfs in the field are at least as quiet as the Sun (Basri et al., 2010), displaying lower levels of photometric dispersion. By extrapolation, about half of nearby dwarfs should be as amenable to exoplanet detection as the Sun. The aim of this paper is to determine the solar astrometric jitter directly from observations. The results can be used to verify and correct the existing models of spot activity for other stars.
2 The data
We made use of the set of 2881 images of the solar disk reconstructed from Mount Wilson Observatory magnetogram and intensity ratio images for the period 1996 to 2007 (Ulrich et al., 2010). As described in that paper, two options of the AutoClass analysis yielded an 18 and a 37 class set of solar surface features. The original Mount Wilson images in the intensity ratio and magnetic field strength were expanded in the corresponding sets of classes and calibrated against the TSI data (Fröhlich & Lean, 1998). The resulting solar irradiance images have the full resolution of the original data, with a value of normalized TSI assigned to each pixel. Essentially, these images are two-dimensional maps of bolometric surface intensity. The reconstructed images are only 95% of the full solar disk in radius. The units of pixel values are Wm-2, and they are normalized to unit total area. For this study, we used the 37-class reconstruction, which provides a slightly better match to the TSI, although this improvement is not important for our purpose. Ulrich et al. (2010) discuss the ”ring effect” in the reconstructed TSI maps, which manifests itself as a kind of diffraction ring surrounding high-contrast, compact features, especially dark spots. The spatial scale of these artefacts is small, and the impact on the estimated magnetic jitter is negligible.
The processing of the TSI maps was straightforward. Each of the 2881 images was integrated in first moment with respect to a fixed pixel row, e.g.,
| (1) |
and similarly for . The axis is aligned with the solar equator, and the axis with the rotation axis. The derived offsets were brought to zero mean and converted to AU. Since the TSI images are based on the observed distributions of magnetic strength and the ratio of two monochromatic intensities, they are almost devoid of the limb darkening effects. Therefore, we do not apply any limb darkening corrections as the counter-acting effects of the broad-band intensity reduction toward the limb and the increasing contrast of faculae with respect to the local photosphere (Foukal et al., 2004) have been balanced in the images by construction.
3 Astrometric jitter from the magnetic activity
The main results of this study are shown in Fig. 1. The top panel displaying the integrated TSI is shown only for reference, because the TSI images were constructed to match the space-based TSI measurements as close as possible, thus, the plot does not contain any new information. The middle and bottom panels show the daily photocenter offsets of the solar disk over some 11 years in the equatorial and axial dimensions, respectively. The TSI has been for some time known to vary systematically with the solar cycle (Willson et al., 1981), but the exact contribution of the opposing effects (faculae and spots) to this process is still somewhat controversial. The Sun is brighter when its level of magnetic activity is elevated, while younger and more active stars tend to display the opposite correlation (Radick et al., 1998). The peak-to-peak variation of TSI is approximately 2 Wm-2, or 0.15%. The maximum of activity in 2000–2002 is marked with a brighter average and a much larger dispersion of TSI. A running average standard deviation over 3 months varies between AU and AU in . The overall standard deviations are AU for and AU for . Predictably, the dispersion of is smaller, because major spots occur in the equatorial zone of the disk.
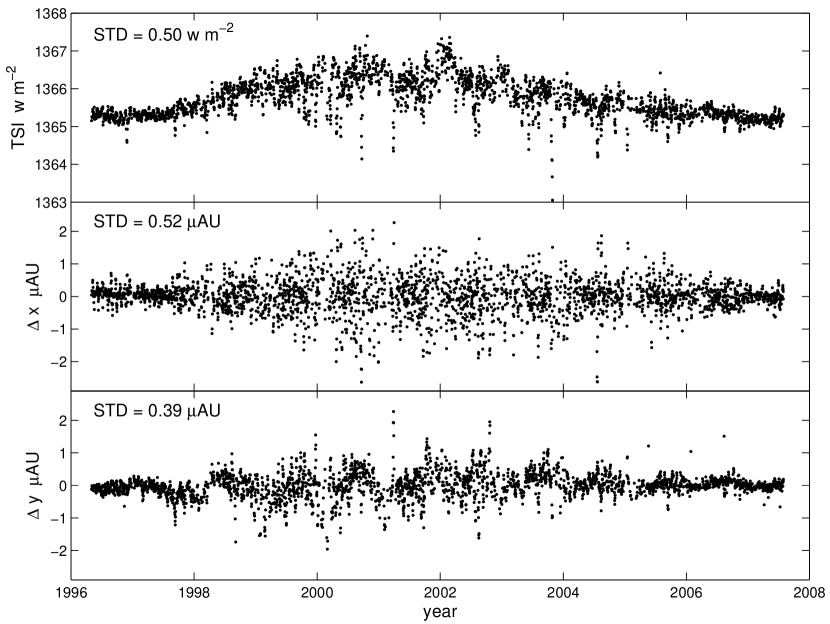
The distinct variation in with a period of 1 year is probably an artefact related to the seasonal change of the solar obliquity. In September, the solar axis is tilted by , with its north pole toward the Earth. Since the distribution of magnetic features is symmetric about the solar equator, more spots and faculae appear in the southern part of the disk than in the northern part, as seen by a ground-based observer. This 1-year modulation of the offset is germane to the Sun and will not be observed on other stars. A periodogram analysis determined that the best fitting sinusoid has a period of 1 yr and an amplitude of AU.
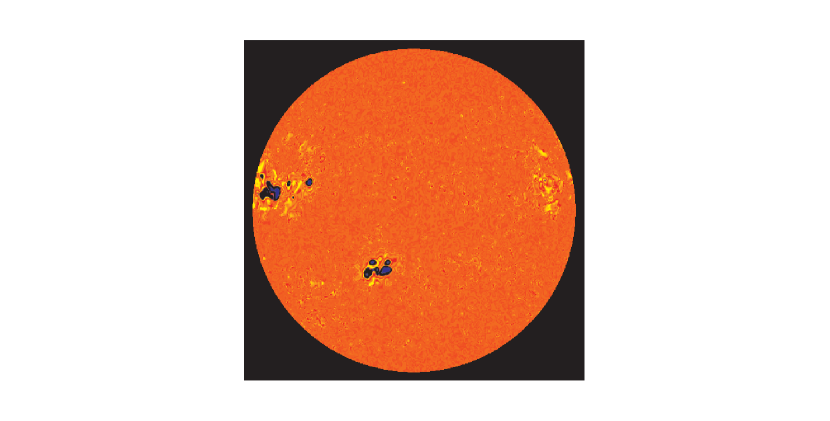
The running average of the perturbations is not correlated with the solar cycle, because the probability of magnetic features to be located in the eastern or western hemispheres is the same. The scatter of daily variation is, however, strongly correlated with the level of magnetic activity. The distribution of TSI perturbations around the running mean is asymmetric, with a longer tail extending toward fainter intensities. These short-lived dips in TSI are caused by particularly large sunspot groups, and normally happen at times of elevated activity. The distribution of astrometric perturbations around the running mean are fairly symmetric, as expected. The largest astrometric perturbation took place on 2000.09.19, when a distant observer would have detected a westward photocenter shift of AU. Fig. 2 depicts the distribution of surface brightness of the Sun on that date. The color scale is arbitrary, adjusted in such a way that the dark spots (black and blue) and the faculae (yellow) can be clearly seen. This unusually large perturbation was caused by two sunspot groups, which happened to be in the eastern hemisphere, and a bright active region in the opposite western hemisphere.
The temporal variations of solar surface brightness are commonly considered to be caused by small- and medium-scale magnetic features, such as photospheric spots and plages. Is it possible that some other, non-magnetic structures are present in the surface brightness distribution, which would not be captured by the Mount Wilson magnetograms that served as the original data for the TSI reconstruction? Ulrich et al. (2010) found that the reconstructed irradiance followed the actual TSI variations, observed with Virgo, to a correlation coefficient of 0.9625. This corresponds to a standard deviation of 28% relative to the variation of TSI, if the error introduced by the proxy reconstruction is uncorrelated with the true light curve. Although it is not possible to tell how this error is distributed across the solar disk, we condend that the true astrometric jitter can not be larger than our estimates by more than this amount, which is 4% when added in quadrature. The error is carried by many classes of different spatial scale, but only large scale perturbations count in the integration in first moment. Most of this error is probably confined to small-scale structures, which should cancel in integration. Known imperfections, such as the ringing features centered on the centers of activity, caused by too many plage classes, do not result in an appreciable image shift. Besides, some of the TSI variation not accounted for by the reconstruction is due to magnetic features appearing in the outer rim of the solar disk (5% of the radius), which is missing in our data.
4 Implications for Earth-like planet detection
Planets revolving around their host stars produce sinusoidal variations in the astrometric position. The main harmonic of these variations has the orbital period of the planet, and an amplitude defined by the mass of the star, the mass of the planet, and the orbital semimajor axis. Planets in eccentric orbits also produce higher-order harmonics (overtones) of smaller amplitudes. The spectroscopic method of exoplanet detection, based on precision measurements of stellar radial velocity, utilizes the Lomb-Scargle periodogram analysis (e.g., Fischer et al., 2008), which is aimed at detecting statistically significant sinusoidal variations in irregularly sampled data with a zero mean (Scargle, 1982). A similar “joint” power spectrum periodogram was suggested for 2D astrometric detection by Catanzarite et al. (2008). In order to evaluate the impact of magnetic jitter on detection of low-mass planets, we employ in this paper a generalized amplitude spectrum analysis, which, unlike the Lomb-Scargle periodogram, includes the constant term in the set of fitting functions. A constant offset in position is a physical astrometric parameter, which can not be simply subtracted from the raw data.
The linear problem
| (2) |
is solved for a grid of frequencies , where is the column vector of observation times, and is the column vector of -coordinate offsets. If is the Least-Squares solution (a 3-vector), the generalized amplitude spectrum as a function of period is
| (3) |
The interpretation of this function is straightforward: it is the amplitude of the best-fitting sinusoid with the given period and a free phase. A planet with an orbital period can be confidently detected if the amplitude of its main harmonic is much larger than . It corresponds to the square root of the “periodogram power” of the Lomb-Scargle periodogram commonly used in exoplanet detection.
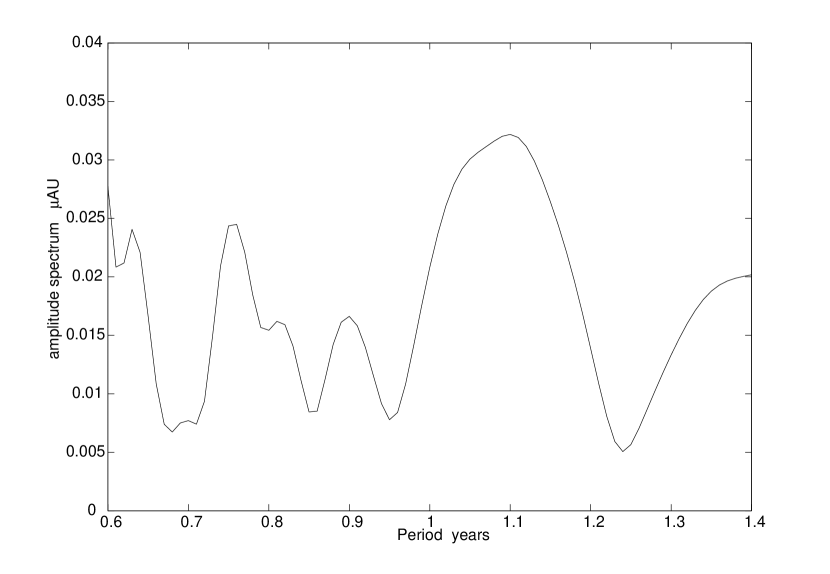
Fig. 3 shows the spectrum of the series derived from the TSI maps. The calculation was restricted to the range of habitable zone around the Sun, which corresponds to, somewhat generously, 0.6–1.4 years in orbital period. The spectrum is distributed non-uniformly, so that white noise would not be a good model for this kind of perturbation. The largest sinusoidal variation has a period of yr and an amplitude of AU. The Earth generates an astrometric wobble of the Sun of 3 AU, whose power is almost entirely in the main harmonic (1 year) due to the very low eccentricity. Thus, the Earth can be detected by astrometric means at a very comfortable S/N of greater than 90, as far as magnetic jitter is concerned, if a similar observational cadence is achieved. For a solar-like star at 10 pc, the amplitude spectrum of magnetic jitter is not greater than as, which is vanishingly small compared to the expected single measurement precision of SIM ( as) or Gaia ( as).
5 Discussion
We determined that the solar jitter caused by magnetic features is small and should not preclude astrometrists from detecting habitable planets as small as the Earth. A few additional considerations should be made when extrapolating this result to other stars or to actual astrometric observations.
The ultra-precise photometric measurements with Kepler confirmed that about half of all solar-type dwarfs are as quiet as the Sun, or more (Basri et al., 2010). The stars that are more active than the Sun have much larger filling factors, and their magnetic features may be long-lived (up to a few weeks). Both photometric and astrometric variability is proportional to the average total area occupied by spots (Makarov et al., 2009). In the model currently adopted for planet detection simulations with SIM (to be published elsewhere), the total area is related to the index of chromospheric activity through
| (4) |
which yields 6137 micro-stellar-hemispheres (MSH) for the Sun. As roughly half of nearby field stars are more chromospherically active than the Sun (Gray et al., 2003), they are expected to have larger spot groups and, therefore, jitter amplitudes. At , the expected area and the jitter are 5 times the solar values, and at , 25 times. This model gives fairly accurate predictions for the active star Ceti, carefully studied with MOST (Walker et al., 2007). Furthermore, an additional factor of 2–6 increase may ensue from the limited duration of an astrometric mission. Both SIM and Gaia will nominally operate for 5 years. This is considerably shorter than the solar cycle. If a solar analog is observed at the height of its activity, the level of magnetic jitter may be higher than the multi-year average. Thus, magnetic jitter can indeed pose the natural limit to the sensitivity of the astrometric method at stars significantly more active than the Sun.
The amplitude spectrum periodogram shown in Fig. 3 is derived from a high-frequency observational cadence of 2881 data points over 11 years. We expect only about 200 2D measurements to be taken for each target star with SIM Lite during its 5-year nominal mission. If the astrometric jitter is completely random and uncorrelated, the variance of the amplitude of a random harmonic in the spectrum is inversely proportional to the number of data points. In that case, the amplitude spectrum will rise by a factor of for SIM. On the other hand, if the magnetic activity underlying the astrometric jitter is systematic and deterministic, the corresponding parts of the spectrum will stay as low is in Fig. 3. Such systematic variations may occur, for example, if sunspots and plages are not randomly distributed on the solar surface, but tend to appear in confined areas called “active longitudes” in the literature. Currently, there seems to be no strong evidence for the existence of such long-term structures. A possible north-south asymmetry in the distribution of magnetic features evolving with the solar cycle is another interesting route of investigation where the reconstructed TSI images can be used.
The results derived in this paper apply to solar-type stars seen equator-on (inclination ). A pole-on configuration is optimal for astrometric detection, because both dimensions are equally engaged, but it is statistically less probable. Even at moderate inclinations to the line of sight, the distribution of magnetic perturbations in -coordinate may be different from that we find for the Sun, if the magnetic features are confined to the equatorial zone. The features would normally be seen closer to the side of the limb opposite to the visible pole, producing a skewed distribution of depending on whether the spots or bright areas are the dominating contributors. However, giant near-polar spots appear to be common on very active, fast-rotating stars.
References
- Basri et al. (2010) Basri, G., et al. 2010, ApJ, 713, L155
- Casertano et al. (2008) Casertano, S., et al. 2008, A&A, 482, 699
- Catanzarite et al. (2008) Catanzarite, J., Law, N., & Shao, M., 2008, Proc SPIE, 7013, 70132K
- Catanzarite et al. (2006) Catanzarite, J., et al. 2006, PASP, 118, 1319
- Fischer et al. (2008) Fischer, D.A, et al. 2008, ApJ, 675, 790
- Foukal et al. (2004) Foukal, P., et al. 2004, ApJ, 611, L57
- Fröhlich & Lean (1998) Fröhlich, C., & Lean, J. 1998, Geophysical Research Letters, 25(23), 4377
- Gray et al. (2003) Gray, R.O., et al. 2003, AJ, 126, 2048
- Makarov et al. (2009) Makarov, V.V., et al., 2009, ApJ, 707, L73
- Radick et al. (1998) Radick, R.R., et al. 1998, ApJS, 118, 239
- Shao et al. (2009) Shao, M., et al. 2009, Astro2010: The Astronomy and Astrophysics Decadal Survey, White Papers, No. 271
- Scargle (1982) Scargle, J.D. 1982, ApJ, 263, 835
- Traub et al. (2009) Traub, W.A., et al., 2009, BAAS, 41, 267
- Ulrich et al. (2010) Ulrich, R.K., et al. 2010, Sol. Phys., 261, 11
- Unwin et al. (2008) Unwin, S.C., et al. 2008, PASP, 120, 38
- Willson et al. (1981) Willson, R.C., et al. 1981, Science, 211, 700
- Walker et al. (2007) Walker, G.A.H., et al. 2007, ApJ, 659, 1611